A Work Project, presented as part of the requirements for the Award of a Master Degree in Economics from NOVA – School of Business and Economics.
THE IMPACT OF THE SOVEREIGN DEBT CRISIS ON THE RISE OF POPULIST PARTIES IN ITALY
SILVIA BIANCOROSSO 31249
A Project carried out on the Master in Economics Program, under the supervision of:
Susana Peralta
Table of Contents
ABSTRACT ... 3
1. INTRODUCTION ... 4
2.1 LITERATURE REVIEW ... 5
2.3 THE ITALIAN SOVEREIGN DEBT CRISIS ... 6
2.4 THE ITALIAN POLITICAL SCENARIO ... 8
2.1 POLITICAL CONSEQUENCES OF THE CRISIS ... 9
3. DATA AND METHODOLOGY ... 11
3.1 DATA ... 11
3.3 METHODOLOGY ... 14
3.3.1 CHOICE OF THE STATISTICAL MODELS ... 16
3.3.2 ROBUST STANDARD ERRORS ... 17
4. EMPIRICAL RESULTS and THEORITICAL ANALYSIS ... 17
CONCLUSION ... 21
BIBLIOGRAPHY ... 24
TABLE OF FIGURES AND TABLES Figure 1: LABOR PRODUCTIVITY ... 7
Figure 2: DEBT AS PERCENTAGE OF GDP ... 7
Figure 3: UNEMPLOYMENT RATE and GDP PER CAPITA, 1995-2017 ... 13
Table 1: % VALUES OF PEOPLE WITH TRUST IN INSTUTIONS ... 11
Table 2: COLECTED VARIABLES ... 13
Table 3: REGIONAL ELECTIONS ... 14
Table 4: DESCRIPTIVE STATISTICS ... 15
Table 5: MODEL I, IMPACT OF THE SOVEREIGN DEBT CRISIS, 1995-2017 ... 18
Table 6: IMPACT OF THE SOVEREIGN DEBT CRISIS AND OTHER VARIABLES MODEL II, 2007-2017 ... 19
Table 7: IMPACT OF THE SOVEREIGN DEBT CRISIS, MODEL III, 2007-2017 ... 20
Table 8: RESULTS FROM MODEL I AND II ... 20
Table 9: Wooldridge’s auxiliary regression for the panel-robust Hausman test ... 23
Table 10: Wooldridge’s auxiliary regression for hausman test robust to very general forms of spatial and temporal dependence – Right Coalition ... 24
ABSTRACT
After the economic crisis burst, the Italian political scenario was characterized by a persistent instability. From 2011 to 2018, the country had four different governments, all heavily criticized for the imposed structural economic reforms and austerity measures. The general dissatisfaction of citizens toward the crisis management may have led voters to think the establishment parties were incapable of dealing with the problems of the country, such the high unemployment rate and the inexistent economic growth. This scenario may explain why voters tended to vote for antiestablishment parties, namely the Northern League and the Five Star Movement in the 2018 political elections.
1. INTRODUCTION
When the global financial crisis initially burst in 2008, Silvio Berlusconi was at the head of the cabinet for the fourth time. The ruling government denied the gravity of the crisis until the summer of 2011, when the country was hit by a speculative financial market attack, following a general lack of confidence toward Eurozone countries, especially the ones with a high debt/GDP ratio (Borghi, 2013). The cabinet fell under the weight of the sovereign debt crisis, and a technocratic executive took its place to secure financial stability and growth. In 2013, none of the parties obtained an outstanding majority and the President of the Republic appointed as Prime Minister, a member of the left Democratic Party. After a short time, also this government fell and was followed by two other governments. The cabinets that ruled the country could have been seen as imposed to proceed with the necessary structural economic reforms and austerity measures, perceived to be against the people and not for the people. The general dissatisfaction for the crisis management may have led voters to think the establishment parties were incapable of dealing with the problems of the country and that populism parties could be a valid alternative.
Therefore, the thesis aims understanding whether the sovereign debt crisis could have affected the rise of populist parties in Italy, namely the Northern League and the Five Star Movement. The remainder of the paper is structured as follows. After the introduction, section 2 presents the literature review, a brief chronology of the crisis, a description of the Italian political framework and a discussion of the political scenario after the crisis; section 3 regards data collection and the econometric approach designed to assess the impact of the sovereign debt crisis on the rise of antiestablishment parties; finally, section 4 discusses the obtained results from the analysis.
2. BACKGROUND
2.1 LITERATURE REVIEW
My paper is linked to many different fronts of literature, but especially with the one studying the roots of populist parties. There is no literature available on the impact of the recession to the Italian political system, therefore I will focus on both the Latin-America Region and Europe Union.
Dornbush and Edwards (1991) emphasize the negative impact of populism in pursuing macroeconomic expansionary policies to boost economic growth and redistribute income in Latin America. In every country of the region, after a brief period of economic recovery, the expansionary policies left space to inflation, important balance of payment difficulties and collapse of real wages. These expansionary macroeconomic plans always implied the help of the International Monetary Fund (IMF) and drastic stabilization programs.
Hernandez and Kriesi (2016) focused on the European Union and analyzed the electoral consequences of the Great Recession by using two theoretical perspectives: economic voting and party system change. According with the first theory, electors tend to punish political incumbents by voting for oppositions, especially in time of economic crisis, when the consequences of punishing the incumbents are more likely to last more. The other theoretical perspective relies on the change of party systems; old political actors adapt to society’s transformations and new actors may emerge as a result of social conflicts, leading a consequent change in the voting pattern. The authors argue that those two perspectives allow understanding the impact of the Great recession on the overall European party systems. From their analysis, it emerged that during the Great Recession, voters heavily punished incumbents, especially in the most penalized countries of Western Europe.
Also, Kriesi and Pappas (2015) assessed the effect of the crisis on populism at a European level. Populist leaders emerged to defend the powerless people against the elite, who led the countries to deeper social and economic inequalities and austerity measures. The strengthening of
populism across Europe is one of the most important consequences of the Great Recession, although the crisis cannot be considered as the starting point. Other issues are at the roots of the expansion of populism across Europe, such as the malfunctioning of the representative democracy and the dissatisfaction for the political incumbent, unable to represent citizens. Kriesi and Pappas both agreed on the perspective that incumbents were punished as a consequence of the crisis and only in few countries, such as Germany, were able to maintain their position. In countries like Greece or Italy, new political actors proposed themselves as an alternative to incumbents, while in others, as in the case of France, already established radical right parties got reinforced.
Finally, Algan, Papaioannou, Griev and Passari (2017) studied the role the Great Recession had in shaping the vote for anti-establishment parties, by using regional data across Europe. Populist actors had their first important success even before the Great Recession in Europe but the crisis, with the weakness of European institutions and the indecisiveness of policymakers, lead European citizens to be dissatisfied with local and EU incumbents. Their political distrust rises – and is reinforced by – anti-establishment parties, that often coincide with populist parties.
2.3 THE ITALIAN SOVEREIGN DEBT CRISIS
Italy was hit by the global economic crisis since 2008, when the Lehman Brothers went bankrupt. In the decade preceding the crisis, the country had one of the worst growth performances in the EU and despite the reforms made to join the Eurozone in 1999, many of the most important problems – such as the limited R&D investment, the low growth rate of GDP, the low productivity and the high debt/GDP ratio-remained unsolved (Borghi, 2013). Figures 1 and 2 show labor productivity and government debt respectively. In 2009, labor productivity registered a huge fall, after a short period of positive trend; the low productivity of the past years was mainly due to the labor market reforms in the late 1990s, disciplining labor market flexibility, especially part-time jobs and temporary jobs. The reforms provided
new availability of cheap labor, which discouraged the innovative ability of many entrepreneurs, who adopt techniques intensively using the part-time workers, now abundantly available in the labor market (Daveri and Parisi, 2010). The government debt-to-GDP ratio was always exceeding the 60% threshold imposed by Maastricht Treaty and with a debt-to-GDP ratio of 112,5% in 2010, Italy was the second most indebted countries in the Eurozone, preceded by Greece and followed by Ireland and Belgium.
Figure 1: LABOR PRODUCTIVITY
Figure 2: DEBT AS PERCENTAGE OF GDP
After some signs of recovery, during the period 2009 - 2011, the country was hit by a speculative financial market attack, following a general lack of confidence toward Eurozone countries, especially the ones with a high debt/GDP ratio (Borghi, 2013) and Italy entered a new phase of recession. The government was quite slow to act in preventing the risk of contagion and was totally incapable of adopting the necessary measures to ensure economic and financial stability. The Italian executive considered the crisis to be a non-event, an unfortunate accident (Boin, t’Hart & McConnell, 2009) and denied the gravity of the economic problems (Bosco &Verney, 2012) but this strategy magnified the impact of an event that was already quite serious per se.
2.4 THE ITALIAN POLITICAL SCENARIO
This section briefly discusses the most important political parties, presenting a more detailed description of the ideology of the two dominating populist parties, the Five Star Movement and the Northern League. The purpose is to introduce the reader to the political scenario and facilitate the understanding of the political consequences of the crisis later.
The Italian political system is dynamic and relatively fragmented. From the end of the II World War to the 1990s, the political scenario was largely dominated by the centrist Party of Christian Democracy and the left-wing Italian Communist Party. The collapse of the Communist regimes and the “Clean Hands” investigation into political corruption, determined a radical change. The Communist Party was transformed into the Democratic Party of the Left (PDS), rebranding itself as a progressive left-wing and democratic socialist party, active until 1997. However, a part of the old Communist Party refused to join the PDS and form the Communist Refoundation Party, still existing. After the corruption scandal, the Christian Democracy was transformed into the Christian-leftist Italian People’s Party, which later merged into the left-wing Democratic Party (PD). The disintegration of the political parties gave rise to new political forces: in 1989, the Northern League (LN) emerged as a union of six independent movements and the center-right Forza Italia (FI), was funded by Silvio Berlusconi in 1994. The two parties often arranged coalitions across time to run together, not only for political elections but also for the regional ones.
In the current scenario, the Democratic Party and Forza Italia are considered the most important mainstream parties, while the recent Five Star Movement (M5S) and the Northern League are considered as anti-establishment forces. The two anti-establishment parties are extremely different in nature since the first represents the traditional party system and the latter is a new political force.
The Northern League was founded in 1989 and had the extraordinary ability of expanding in the country, although it was born as an alliance of Northern regional parties. Across the years,
the party changed consistently its policies, alternating the separation of the North from the rest of Italy to a unification project, Europeanism with a marked Euroscepticism. One element of its ideology, that remained stable overtime, was the strong position on anti-immigration policies, which allow the party to acquire popularity since the very beginning.
The Five Star movement represents a new form of populism. It was lunched through an internet blog in 2009 and its communication strategy has been based on the Internet and on Web 2.0, rather than using old strategies such as square meetings (Lanzone, 2014). The representative democracy is considered to be not totally compatible with the concept of popular sovereignty, therefore the movement proposes the direct democracy, a broader use of the referendum and the development of the so-called e-democracy.
In the recent political elections, Forza Italia formed a right coalition with the Northern League and other minor parties, while the Democratic Party run with other left parties. None of the three main groups– Right coalition, Five Star Movement and the Left Coalition got the majority of seats in the Parliament. After three months of negotiations, the League formed a coalition with the Five Star Movement, to start the so-called “Government of Change”, considered to be the first populist government in Western Europe.
2.1 POLITICAL CONSEQUENCES OF THE CRISIS
Having in mind the structure of the political scenario, it is finally possible to discuss its recent changes. When the crisis burst in 2008, Silvio Berlusconi was at the head of the cabinet for the fourth time. The government was formed by a coalition between Forza Italia, the Northern League and other minor parties. Berlusconi’s resignation in 2011, was mainly due to the government’s incapability of managing the economic crisis, that was rendering the country’s debt unsustainable and the party political leaders less international credible (Bosco and McDonnell, 2012). The country could not sustain the weight of new political elections, and a technocratic executive was called to face the economic and financial emergency in which the
country was trapped. The executive implemented some economic reforms and austerity measures to face the sovereign debt crisis. After 529 days, the cabinet resigned and in the 2013 political elections, none of the parties got the majority. The Left Coalition collected most of the vote (29,55%) followed by the Right Coalition (29,18%), the M5S (25,56%) and other minor parties and the President of the Republic appointed as Prime Minister, a member of the Democratic Party.
In the period 2013-2018, Italy was characterized by a strong political instability: in five years, three different Prime Ministers were nominated, and they were all representatives of the Left Coalition. During this delicate period, the governments had to deal with important challenges, such as the persistent economic hardship, the growing unemployment, restoring international faith in the political institutions and the reorganization of the public sector. All the governments were heavily judged for their economic measures and their high political instability, which led to a general dissatisfaction among Italian citizens. Table 1 shows the percentage of people with trust in the national institutions. For example, in 2010, 71% of citizens had trust in the President of the Republic, while in 2014, the portion decreased to 44%; what is even more astonishing is that in 2014, only 3% of the population had trust in the party system.
Citizens did not have the possibility to express their electoral preferences when the country was recovering from the recession. The lack of political elections could have been seen as imposed and decided by the political institutions to proceed with economic reforms and austerity measures, perceived to be against the people and not for the people. The general distrust of citizens may have led voters to think the establishment parties were incapable of dealing with the problems of the country, such the high unemployment rate and the inexistent economic growth. Following Cubas et al. (2018), unemployment is considered to be the greatest source of concern for citizens in the Southern and Eastern Europe countries and one of the reasons leading the electorate to change voting behavior, together with the concerns for the economic
developments. This scenario might lead to think that the sovereign debt crisis had an impact on the rise of populism parties in Europe, chosen as an alternative to political incumbents.
Table 1: % VALUES OF PEOPLE WITH TRUST IN INSTUTIONS
2014 2013 2010 Difference 2014-2010 The President of the
Republic
44 49 71 -27
The State 15 19 30 -15
The Parliament 7 7 13 -6
The Parties 3 5 8 -5
Source: Demos survey for the journal “La Repubblica” (December 2014)
3. DATA AND METHODOLOGY
3.1 DATA
I considered regional data for the period between 1995 and 2017 in order to have a sample large enough to gather variations before and after the recession in the variables and electoral results. The main sources were the Italian National Institute of Statistics (Istat) and the single regions’ websites.
Italy is made up of 20 regions, but the study presents 21, since the region Trentino Alto Adige/Südtirol is composed of the two autonomous provinces of Trento and Bolzano. The indicators were chosen according to data availability and to broadly represent the Italian society. The dataset includes the following social and economic variables: GDP per capita, unemployment rate, population between 25-64 years with higher education, population between 25-64 with secondary education and annual inflow of non-EU citizens. Data on education were considered since voting studies argue that the less educate people are more likely to vote for populist parties (Arzheimer 2009); on the other side, data on immigration were included since anti-immigration policies were one of the fundamental components that contribute to the
immigrants. Following an analysis presented by the Istituto Cattaneo - regarding the perception of the dimension of the migration flows and their actual size- the country presents the highest perception error (+17.4%)-between the effective percentage of non-EU immigrants and the perceived one- in the EU. In fact, in Italy, the percentage of immigrants over the total population is only 7% but the perception is 24%.
The GDP per capita and the unemployment rate are considered since they are the economic measures that can disclose the impact of the crisis on the country. Figure 3 presents the national trend for the GDP per capita and unemployment rate. GDP per capita decreased after 2008 and the rate of unemployment suddenly increased from the same period, after a long period of decreasing trend. The database considers also the regional electoral results and a distinction between the shares of vote collected by the Left coalition, the Right Coalition, the Five Star Movement and the other minor parties was made. Data for the Five Star Movement are only available from the 2010 regional election and the movement does not belong to any coalition since it declares itself to not have left or right ideologies. Defining coalitions is very difficult since they change not only across time but also across regions; the Left Coalition should group the left-wing parties, such as the Democratic Party or its predecessors; in the Right Coalition, across the years, it is possible to identify two cardinal parties: Berlusconi’s Forza Italia and the League. It must be noted that the League was in the coalition only in Northern Italy in the previous years -although this is no longer true from the 2018 national and regional elections. The main problem of the collection process was the lack of data, due to changes in the computational methodology of statistics or simply because data were not collected for the required period by Istat. Only for some variables, it was possible to collect data for the entire period. Table 2 below summarizes the variables and the collection period:
Figure 3: UNEMPLOYMENT RATE and GDP PER CAPITA, 1995-2017
Table 2: COLECTED VARIABLES
VARIABLE COLLECTION PERIOD
GDP per capita, Unemployment rate, Right Coalition, Left Coalition and Five Star Movement
1995-2017
Population with Higher Education : 25–64 years, Population with Secondary Education : 25-64 years , Annual inflow on non-EU citizens
2007-2017
The 1995 regional elections were the first to be considered in most of the regions; however, in the case of the regions holding the special statute, the elections were held in the following years. In order to avoid having missing observations, I considered elections held in 1994 or before. For example, in Friuli Venezia-Giulia, the regional election took place not in 1995 but in 1998. For the period between 1995 and 1997, therefore, I considered data from the previous election held in 1993. Table 3 shows all the regional elections in the period from the 1990s onwards. Finally, I created two dummy variables: “regular election”, indicating whether the regional election was regular -i.e. held every five year- and “regional election”, telling if there was a regional election for the year.
Table 3: REGIONAL ELECTIONS
Region Years Number of Elections
Piemonte, Emilia-Romagna,
Calabria 1995, 2000, 2005, 2010, 2014 5
Valle d'Aosta Provincia Autonoma Bolzano
Provincia Autonoma Trento Friuli-Venezia Giulia
1993, 1998, 2003,2008,2013,2018 6
Lombardia 1995, 2000, 2005, 2010,2013,2018 6
Liguria, Veneto, Toscana, Umbria, Marche, Campania, Puglia 1995, 2000, 2005, 2010, 2015 5 Lazio 1995, 2000, 2005, 2010,2013,2018 6 Abruzzo 1995, 2000, 2005, 2008, 2014 5 Molise 1995, 2000, 2001, 2006, 2011, 2013, 2018 7 Basilicata 1995, 2000, 2005, 2010,2013,20191 6 Sicilia 1991,1996,2001,2006,2008,2012,2017 7 Sardegna 1994, 1999, 2004, 2009,2014 5 3.3 METHODOLOGY
To assess the impact of the sovereign debt economic crisis, I used different models; in the main one, I included the two economic variables- GDP per capita and the unemployment rate-, the two dummy variables and the electoral results for the full sample. Initially, I did not consider other variables since there were too many missing values. The statistical software used in the analysis is Stata. The alternative versions of the main model consider more independent variables, since the electoral voting shares of the Right and Left Coalitions and the M5S may be affected by other factors, such as the inflow of non-EU citizens or people with higher and secondary education.
The models are built using the fixed effects (FE model) model and the pooled OLS. The first was used for the regressions considering the voting shares for the Left Coalition and M5S as outcome variables; the pooled OLS was used in the regression for the share of vote for the Right Coalition. The general equation for the FE model is (Croissant and Millo, 2018):
Equation 1
𝑦"# = 𝑎" + 𝛽)𝑥"#+. . +𝛽,𝑥"#+ 𝑢"#
𝑎" (i=1) is the intercept, 𝑦"# represents the voting shares for the Left Coalition and M5S, 𝑥"# are the GDP per capita, the unemployment rate, the inflow of non-EU citizens, people with higher and secondary education and 𝑢"# is the error term. Additionally, in all the regressions, I considered four-period lags for the independent variables and a one-period lag for the electoral results.
All the regressions have robust standard errors. I am first going to explain the choice of the statistical models, and then of robust standard errors. Table 3 provides the descriptive statistics of the variables considered in the paper.
Table 4: DESCRIPTIVE STATISTICS
count mean sd min max
GDP per capita 399 1735.941 1720.33 -2417.841 5370.822 Left Coalition 462 -.000889 .047226 -.432 .2921 Right Coalition 462 -.0029385 .0588053 -.3957 .279 M5S 462 .0068857 .032336 0 .2484 Unemployment rate 399 .2382516 2.880614 -7.178319 11.55649 Higher Education 200 4.38 68.9407 -262 85 Secondary Education 210 30.75226 34.93224 -17.858 131.82 Inflow non-EU Citizen 126 14.71429 80.05327 -167 187 N 483
3.3.1 CHOICE OF THE STATISTICAL MODELS
Following Baum, (2013) the FE model is more appropriate when the sample constitutes the entire population and it is considered to be one of the simplest and most robust specifications in panel data econometrics and often the benchmark against more sophisticated methods. To confirm the FE was the best choice, I conducted an alternative formulation of the Hausman test; to compute the test, two steps were taken: first, I run the Wooldridge‘s auxiliary regression for the panel-robust Hausman test with panel robust standard errors (Wooldridge, 2002) to ensure valid statistical inference for the Hausman test; secondly, I performed the test itself: the null hypothesis of no fixed effects is rejected at the 10% level for regressions having as outcome variables the voting shares for the left coalition and M5S (see Appendix); therefore, these regression models should be estimated by using a FE regression, in order to guarantee the consistency of results.
The null hypothesis of the alternative formulation of the Hausman test is not rejected only in the case of the regression with the share of votes of the Right coalition. In this case, it is assumed that there might be correlation caused by unobserved factors, not correlated with the considered regressors (Hoyos and Sarafidis, 2006). In this way, the FE estimators are consistent but inefficient and the estimated standard errors are biased.
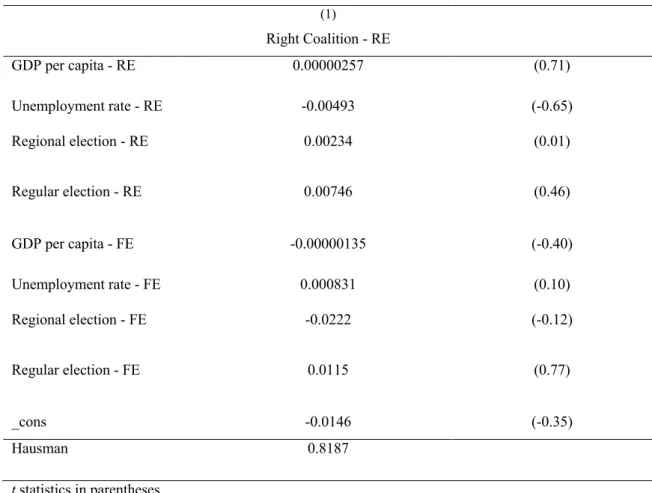
Thus, I proceeded with the correction of standard errors, following the method proposed by Driscoll and Kraay (1998) and I performed a robust Hausman test to check any form of spatial correlation (see Appendix). This time, the test accepts the null and indicates that the coefficients estimates from pooled OLS estimation should be consistent (Hoechle, 2007). Driscoll-Kraay standard errors are appropriate in case of cross-sectional dependence. I tested for whether or not the residuals from a fixed effects estimation of regression model are spatially independent, with a Pesaran’s CD test. The null hypothesis of the CD test sets that the residuals are cross-sectionally uncorrelated (Hoechle, 2007). The output of the test establishes that a FE model
produces regression residuals that are cross-sectionally dependent and I concluded that the regression should be estimated with Discroll-Kraay standard errors.
3.3.2 ROBUST STANDARD ERRORS
The command used for running the FE regression was “xtreg fe”, which estimates the model assuming homoskedasticity; to check for it, I performed a modified Wald statistic for groupwise heteroskedasticity in the residuals, whose null hypothesis accepts homoskedasticity. In my case, the alternative hypotheses of heteroskedasticity was accepted and I included robust standard errors in the regression to account for it. The command used for running the Pooled OLS is “regress”. I checked for heteroskedasticity also in this case, with a Breusch-Pagan test. The null of constant variance is rejected at the 1% level, concluding that heteroskedasticity was present and to account for it, I used robust errors.
Additionally, I performed a Woolridge test for autocorrelation for all the regressions, in which the null establishes no first-order autocorrelation, which is always accepted: therefore, clustered errors are not necessary.
4. EMPIRICAL RESULTS and THEORITICAL ANALYSIS
This section discusses the model outputs obtained by running panel fixed effects and pooled OLS regressions. As explained before, the FE model was used when the Left Coalition and the Five Star Movement were the outcome variables, while the pooled OLS was used for the Right Coalition. The p-value associated with the F-test statistics is below the 10% significance level in all the regressions.
In the first model (table 5), the GDP per capita fuels the voting share for the Left Coalition and has a negative impact on the share for the Movement. The latter result suggests that an increase in GDP per capita has a negative impact on the vote for the Five Star Movement. Unemployment has a negative impact on the voting behavior for the Right Coalition and a
positive one for the M5S. The dummy accounting whether there was a regional election has a positive impact on the Five Star Movement.
Table 5: MODEL I, IMPACT OF THE SOVEREIGN DEBT CRISIS, 1995-2017
(1) (2) (3)
Left Coalition M5S Right Coalition
GDP per capita 0.00000719** -0.00000225* 0.00000123 (0.00000226) (0.000000888) (0.00000227) Unemployment rate 0.00180 0.00181* -0.00425* (0.00147) (0.000644) (0.00174) Regional election 0.00466 0.0378*** -0.0196 (0.00728) (0.00412) (0.0141) Regular election -0.00761 -0.00896 0.0152 (0.00630) (0.00458) (0.00953) _cons -0.00649 0.0113** -0.0145 (0.00348) (0.00335) (0.00834) hausman 0.0151 0.889 0.001 N 399 399 399
FE model for Left Coalition and M5S; pooled OLS for Right Coalition Standard errors in parenthesis
* p < 0.05, ** p < 0.01, *** p < 0.001
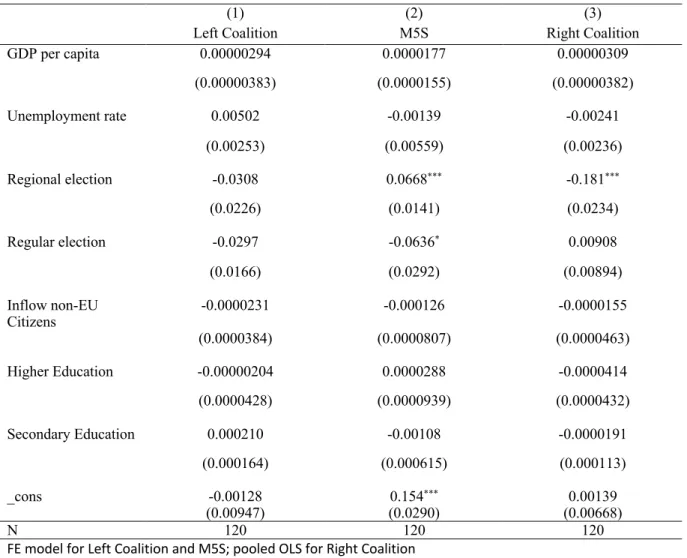
The second model (table 6) introduces some other independent variables: the inflow on non-EU citizens, the number of people with secondary and tertiary education. As explained before, the level of education and immigration might be important factors affecting the voting behavior for antiestablishment parties. In this case, the introduction of other variables has a negative impact on the model, since there are no significant results. However, in interpreting the results, it should be considered that the analyzed period is relative smaller (2007-2017) to the one considered in the first model (1995-2017), due to data availability from official sources. The regional election dummy positively impacts the share of vote for the M5S and negatively the share for the Right Coalition. The dummy accounting whether the election was regular or not had a negative impact on the M5S.
The third model (table 7) considers again only the GDP per capita and the unemployment rate but in the period between 2007-2017, to assess whether the results from the previous model change. The results are quite similar to the first model. In fact, in both cases, GDP per capita fuels voting for the Left Coalition, while the unemployment rate negatively affects the vote for the Right Coalition. However, in this model, the unemployment rate has a positive impact of the vote for the Left Coalition.
Table 6:MODEL II, IMPACT OF THE SOVEREIGN DEBT CRISIS AND OTHER VARIABLES, 2007-2017
(1) (2) (3)
Left Coalition M5S Right Coalition
GDP per capita 0.00000294 0.0000177 0.00000309 (0.00000383) (0.0000155) (0.00000382) Unemployment rate 0.00502 -0.00139 -0.00241 (0.00253) (0.00559) (0.00236) Regional election -0.0308 0.0668*** -0.181*** (0.0226) (0.0141) (0.0234) Regular election -0.0297 -0.0636* 0.00908 (0.0166) (0.0292) (0.00894) Inflow non-EU Citizens -0.0000231 -0.000126 -0.0000155 (0.0000384) (0.0000807) (0.0000463) Higher Education -0.00000204 0.0000288 -0.0000414 (0.0000428) (0.0000939) (0.0000432) Secondary Education 0.000210 -0.00108 -0.0000191 (0.000164) (0.000615) (0.000113) _cons -0.00128 0.154*** 0.00139 (0.00947) (0.0290) (0.00668) N 120 120 120
FE model for Left Coalition and M5S; pooled OLS for Right Coalition Standard errors in parenthesis
* p < 0.05, ** p < 0.01, *** p < 0.001
The fact that the economic variables have again a significant impact on the electoral result may lead to two conclusions: i) the additional variables used in the previous model may not be considered in the analysis; ii) the considered time period is important. In the last two models, the analysis starts in 2007, immediately before the crisis could burst. In the first case, the
analyzed period is much longer; this might lead to think that variables like GDP per capita and the unemployment rate might have a different impact in the short and long terms on voting behavior. The dummies have the same effect as in the second model, but the regular election dummy has positively affected the share of vote for the Right Coalition.
Table 7: MODEL III, IMPACT OF THE SOVEREIGN DEBT CRISIS, 2007-2017
(1) (2) (3)
Left Coalition M5S Right Coalition
GDP per capita 0.00000879* -0.00000506 -0.00000382 (0.00000389) (0.00000419) (0.00000362) Unemployment rate 0.00521 * 0.000771 -0.00740*** (0.00223) (0.00230) (0.00188) Regional election -0.0454*** 0.0284*** -0.0518*** (0.0118) (0.00643) (0.0104) Regular election -0.0245* -0.106** 0.0235* (0.0112) (0.0282) (0.00939) _cons 0.00465 0.134*** -0.00509 (0.00661) (0.0246) (0.00930) N 231 231 231
FE model for Left Coalition and M5S; pooled OLS for Right Coalition Standard errors in parenthesis
* p < 0.05, ** p < 0.01, *** p < 0.001
Table 8 summarizes the results whether the variables had a significant impact on voting shares from the first and third models2.
Table 8: RESULTS FROM MODEL I AND II
Left Coalition M5S Right Coalition
GDP per capita (from model I)
Positive impact Negative Impact /
Unemployment rate (from model I)
/ Positive Impact Negative Impact
GDP per capita (from model III)
Positive Impact / /
Unemployment rate (from model III)
Positive Impact / Negative Impact
By voting antiestablishment parties in the 2018 political elections, voters determined an historical change in the political scenario. The political incumbent, the Left Coalition, was punished by the voters for the general crisis management, satisfying the economic voting theory proposed by Hernandez and Kriesi (2016). The League -that was still part of the Right Coalition- resulted to be the first party in many Northern regions and obtained discrete results in the Center-South. The party conquered the electorate by making the anti-immigration component one of the fundamental points of the electoral campaign (Chiaramonte & al, 2018) and not surprisingly, the party was the most voted in provinces with the highest percentage of foreigners.
The M5S obtained the greatest consensus in the South, considered to be the most competitive area of the country, from an electoral perspective. It obtained 40% of the vote in all the regions, with the greatest peaks in Campania and Sicily. The reason is that the movement proposed a public-founded monthly income for people below the poverty threshold (Chiaramonte & al., 2018). The incapability of incumbents to manage the crisis and restore the economic health of the nation helped the rise of two anti-establishment parties, which can have a deep impact on the relation of Italy with the other EU members and on the European project, in terms of further convergence and integration.
CONCLUSION
Populism is part of the public debate but due to its recent re-birth, it has raised more the attention of political scientists and politicians. Still nowadays, it is difficult to define what populism is, because its nature strictly depends on the context and culture in which it is present. After the crisis, Italy was characterized by a strong political instability and all the governments ruling
from 2011 to 2018 were heavily criticized for their structural economic reforms and austerity measures, perceived to be against the people and not in their favor.
The general dissatisfaction toward crisis management may have led voters to think the establishment parties were incapable of dealing with the problems of the country, like unemployment. The 2018 elections opened a new bipolar phase, characterized by the strong presence of the League and the M5S. The formation of a populist government is not only a novelty for Italy, but for the Western Europe as well. The two leading parties are very different in nature and the effects of this new phase may go much beyond national frontiers and may risk impacting the relationship between Italy and the EU and the project of a further European integration.
APPENDIX
Table 9: Wooldridge’s auxiliary regression for the panel-robust Hausman test
(1) (2) (3)
Left Coalition - RE M5S - RE Right Coalition - RE GDP per capita - RE -0.000000833 -0.000000848 0.00000257 (-0.34) (-0.90) (1.03) Unemployment rate - RE 0.00463 -0.00367 -0.00493 (1.34) (-1.88) (-1.65) Regional election - RE -0.127 * 0.0576* 0.00234 (-2.28) (2.29) (0.04) Regular election - RE 0.00430 -0.00508 * 0.00746 (0.59) (-2.10) (1.19) GDP per capita - FE 0.00000802* -0.00000140 -0.00000135 (2.26) (-1.21) (-0.44) Unemployment rate - FE -0.00282 0.00549 ** 0.000831 (-1.05) (3.32) (0.26) Regional election - FE 0.131 * -0.0198 -0.0222 (2.28) (-0.80) (-0.36) Regular election - FE -0.0119 -0.00388 0.0115 (-1.34) (-0.74) (0.97) _cons 0.0231 0.00301 -0.0146 (1.33) (0.53) (-1.08) Hausman 0.0151 0.001 0.889 t statistics in parentheses * p < 0.05, ** p < 0.01, *** p < 0.001
Table 10: Wooldridge’s auxiliary regression for Hausman test robust to very general forms of spatial and temporal
dependence – Right Coalition (1) Right Coalition - RE GDP per capita - RE 0.00000257 (0.71) Unemployment rate - RE -0.00493 (-0.65) Regional election - RE 0.00234 (0.01) Regular election - RE 0.00746 (0.46) GDP per capita - FE -0.00000135 (-0.40) Unemployment rate - FE 0.000831 (0.10) Regional election - FE -0.0222 (-0.12) Regular election - FE 0.0115 (0.77) _cons -0.0146 (-0.35) Hausman 0.8187 t statistics in parentheses * p < 0.05, ** p < 0.01, *** p < 0.001 BIBLIOGRAPHY
Albertazzi, D., & McDonnell, D. 2010. The lega nord back in government. West European Politics, 33(6),
1318-1340.
Algan, Y., Guriev, S., Papaioannou, E., & Passari, E. 2017. The european trust crisis and the rise of
populism. Brookings Papers on Economic Activity, 2017(2), 309-400.
Borghi, E. 2013. The Impact of Anti-Crisis Measures and the Social and Employment Situation: Italy. European
and Economic and Social Committee, “Visits and Publications” Unit. EESC-2013-33-EN
Bosco, A., & McDonnell, D. 2012. Introduction: The monti government and the downgrade of italian
parties. Italian Politics, 27(1), 37-56. doi:10.3167/ip.2012.270103
Bosco, A., & Verney, S. 2012. Electoral epidemic: The political cost of economic crisis in southern europe,
2010-11. South European Society and Politics, 17(2), 129-154.
Cento Bull, A. 2009. Lega nord: A case of simulative politics? South European Society & Politics, 14(2),
129-146.
Croissant, M., Millo, G. 2018. Panel Data Econometrics with R, First Edition. “Panel Data Econometrics: A
Gentle introduction” , pages 1-4. Hoboken: John Wiley & Sons Ltd.
De Hoyos, R., & Sarafidis, V. 2006. Testing for cross-sectional dependence in panel-data models. The Stata Journal: Promoting Communications on Statistics and Stata,6(4), 482-496.
De la Torre, C. 2014. The many faces of populism : Current perspectives (Research in political sociology, volume
22) (D. Woods & B. Wejnert, Eds.). Bingley, England: Emerald. (2014)
Dornbusch, R., & Edwards, S. 1991. The macroeconomics of populism in latin america (A national bureau of
economic research conference report). “The macroeconomics of Populism”.Chicago: University of Chicago Press.
Engesser, S., Ernst, N., Esser, F., & Büchel, F. 2017. Populism and social media: How politicians spread a
fragmented ideology. Information, Communication & Society, 20(8), 1109-1126.
Franzosi, P., Marone, F., & Salvati, E. 2015. Populism and euroscepticism in the italian five star movement. The
International Spectator, 50(2), 109-124.
HERNÁNDEZ, E., & KRIESI, H. 2016. The electoral consequences of the financial and economic crisis in
europe. European Journal of Political Research, 55(2), 203-224.
Hoechle, D. 2007. "Robust standard errors for panel regressions with cross-sectional dependence," Stata
Journal, StataCorp LP, vol. 7(3), pages 281-312, September.
Ionescu, G., Gellner, E., & London School of Economics and Political Science. 1970. Populism: Its meanings
and national characteristics (Nature of human society series). London: Weidenfeld & Nicolson.
Joaquín Martín-Cubas, Anselm Bodoque, Jose M. Pavía, Vicenta Tasa & Ernesto Veres-Ferrer. 2018. The
“Big Bang” of the populist parties in the European Union: The 2014 European Parliament election, Innovation: The European Journal of Social Science Research.
Kriesi, H., & Pappas, T. 2015. European populism in the shadow of the great recession (Ecpr--studies in
european political science). Colchester, U.K.: ECPR Press.
Lanzone, M. 2014. The many faces of populism: Current perspectives. In The “post-modern” populism in italy: The case of the five star movement(pp. 53-78). doi:10.1108/S0895-993520140000022002
Mair, P. 2011. ‘Bini Smaghi vs. the parties: representative government and institutional constraints’, Robert
Schuman Centre for Advanced Studies and EU Democracy Observatory, EUI working paper no. 2011/22, European University Institute, Florence.
Mudde, C. 2004. The populist zeitgeist. Government and Opposition, 39(4), 542-563.
Wooldridge, J. 2002. Econometric analysis of cross section and panel data. Cambridge, Mass.: MIT Press. Wooldridge, J. 2013. Introductory econometrics : A modern approach (5th ed.). Australia, etc.: