THIS REPORT WAS PREPARED EXCLUSIVELY FOR ACADEMIC PURPOSES BY [INSER STUDENT’S NAME], A MASTERS IN FINANCE STUDENT OF THE NOVA SCHOOL OF BUSINESS AND ECONOMICS.THE REPORT WAS SUPERVISED BY A NOVA SBE FACULTY MEMBER, ACTING IN
M
ASTERS IN
F
INANCE
“Ramaphoria” South Africa is experiencing a drastic increase in consumer and business confidence, as the current regime leadership change from Jacob Zuma to Cyril Ramaphosa is being perceived as extremely positive for the countries future. “Africa Rising” Although Sub Saharan Africa as suffered lower growth rates since 2014, rising commodity prices are bring a rebound in growth. In the long run the continent continues to have plenty of room for growth with a new front growth front being opened in East Africa.
“South African Solid Cash Generation” Operations in South Africa are expected to maintain current market share and stable EBITDA margins, due to Shoprite’s competitive advantage on pricing, which will result in a constant cash generation.
“Price & Choice“ Shoprite’s competitive pricing gives the group an edge over its competition while, the variety of store formats enable the group to take advantage of arising opportunities, assuring the groups long term prospects.
Company description
Shoprite is the largest Food retailer in the African continent, with a presence in 15 countries and the bulk of its operations in South Africa. The company operates a wide portfolio of store formats in food retail, it also has a smaller operations selling furniture, a franchisee store format and other complementary retail stores.
“S
HOPRITE
H
OLDINGS
LTD”
C
OMPANY
R
EPORT
F
OOD
R
ETAIL
23
M
AIO2018
S
TUDENT
:
F
ILIPE
L
OURENÇO
[email protected]
Betting on the African Shopper
Recommendation: HOLDVs Previous Recommend HOLD
Price Target FY18: 24.522 ZAR
Upside / Downside (%)
Price (as of 23-May-18) 23.071 ZAR
Reuters: SHP J.J, Bloomberg: SHP SJ
52-week range (ZAR) 28.190-19.320 Market Cap (ZAR Billion) 9.339.08 Outstanding Shares (m) 591338502
Source:
Source: Bloomberg
(Values in ZAR Millions) 2017 2018E 2019F Revenues 141 B 156B 175B EBITDA 9905 10986 12471 Net Profit 4502 5175 6001 EPS 7.61 8.75 10.15 Sales Growth(%) 8.44 10.62 12.46 Capex 4173 5496 5454 ROIC (%) 20.28 19.71 19.75 ROCE (%) 12.74 12.44 12.87
“SHOPRITE HOLDINGS LTD” COMPANY REPORT
Table of Contents
Company Overview ... 3
Macro-Economic Analysis ... 4
South Africa ... 5
Angola, Nigeria & Zambia ... 5
Kenya: Opening a new growth fronties ... 6
Food Retail Sector Analysis ... 7
South Africa ... 7
Comparables ... 8
Sub-Sahran-Africa ... 9
Shoprite Competitive Strategy ...11
Maintaining the Bottom of the pyramid while seizing the Top ... 11
Expansion Going Long Term in Africa ... 13
Furniture segment ... 14
Forecast ...15
Other Items ...19
Valuation ...21
Valuation Peers ... 22 Capital structure ... 22 WACC ... 22 Comparable analysis ... 24 Sensitivity Analysis ... 25 Scenario anlysis ... 25Financial statements ...26
Appendix ...28
“SHOPRITE HOLDINGS LTD” COMPANY REPORT
Company overview
Company overview
Shoprite Holdings LTD is a South African retail group founded in 1979 with a core focus on food retail and smaller retail operations focusing on complementary retail and services, furniture and franchise offerings (figure 2). It is the largest FMCG retailer in the African continent, in 2017 it had sales of 141 Billion ZAR, 33 distribution centres, and 2689 stores spread threw out 15 countries. The group has a strong presence in South Africa with a 31.9% market share of major supermarket sales and a clear price advantage over its competitors. In the rest of SSA (sub-Saharan Africa) it has a fast growing presence, accounting for 19.6% of supermarket sales, being a first mover among large supermarket chains. The group has a portfolio of store models (figure 1), with a variety of offers that are able to serve different income segments and retail markets.
In the food retail segment its brands include, Shoprite Supermarkets the group’s main store format focused on middle lower income consumer, and the main format used for its expansion outside South Africa, were it has a different positioning as an aspirational brand for the growing middle class. A smaller format Usave focuses on basic goods for lower class consumers. The Checkers and checkers hyper is a supermarket format focused on upper income consumer. The supermarket offering is complemented by a pharmacy offering mediRite, Liquorshop offering alcoholic products, Hungry Lion a fast food chain and Computicket a provider of ticketing services. These formats represent a much smaller share of revenues but are essential for cross selling by increasing shopping in the main supermarket formats.
The group currently has 388 franchised stores with a more adaptable format, also focusing on food retailing present in South Africa Namibia and Swaziland.
On the furniture segment the group’s main store format is Ok furniture focusing on a middle income consumer, Ok power express and Ok dreams are smaller formats which focus on electric appliances and furniture offering. For a higher income customer House & Home is used as an alternative format.
Other smaller businesses of the Group include Transpharma a wholesale distributer of pharmaceutical products, checkers food services providing catering services.
Figure 1: Different Shoprite Brands.
Soucre: Company Information
Figure 2: Percentage of sales by segment
“SHOPRITE HOLDINGS LTD” COMPANY REPORT
Shareholder structure & Payout policy
Shoprite went public in 1986 listing on the Johannesburg Stock exchange (JSE) and since 2008 it has been part of the JSE top 40 index. The stock is both part of the top 40 index and highly exposed to the South African and sub-Saharan African economy, making it a good pick for investors looking for a South African exposure (figure 3). Currently the largest shareholder of the company is its founder and Chairman Christoffel Wiese. Christoffel Wiese position has chairman in the group has become controversial recently since he was also chairman and major Shareholder of Steinhoff international holdings. Steinhoff international holdings was planning on merging with Shoprite a merger proposal in which Christoffel Wiese played a central role. This merger was cancelled due to large scale financial fraud on Steinhoff’s side putting in to question if Wiese was aware of such a situation and if he willingly put Shoprites shareholders at risk. Other major Shareholder includes the South African Government Employees pension fund, institutional investors both national and international, and a smaller but relevant shareholder is White Bassoon holding 1,52% of shares who was CEO of the group for 37 years and retiring in 2016.(figure 4)
The group as consistent pay out policy with an average pay-out of 47.8% of net income in the last five years (figure 5-6). Managing to maintain this pay-out by having, stable cash generation, on its South African operations supplying more than the necessary funds for its value creating expansion opportunities and leaving a substantial amount to return to shareholders.
Macro-Economic Analysis
SSA (Sub Saharan Africa) as had a robust economic growth since the mid 1990´s with region’s economy growing at an average rate of 6.3% between 2001 and 2013, this was the result of political stability, improving business environment and rising commodity prices. The two biggest components of this growth in GDP have been infrastructure spending and private consumption. Private consumption grew above GDP increasing its share of GDP from 66.9% in 2000-2006 to 70.7 in 2010-2013. The increase of both components was largely the consequence of an increase in commodity export revenues. Since 2014 this growth trend as gone down substantially with a drop in commodity prices (figure 7) showing the economics overreliance on commodity exports. The drop in growth was uneven being driven by resource intensive economies (figure8). The regions high population growth, plentiful natural resources and current low base level of GDP per capita mean that it has the potential to sustain previous high growth rates as 15% 2% 3% 27% 53% SHAREHOLDER BY COUNTRY other Singapore UK USA South Africa Shareholders Holding 1% or more Wiese, CH 16,89 Government Employees Pension
Fund 11,22
Shoprite Checkers (Pty) Ltd 5,91 Capital Group 4,07 Lazard 3,49 Vanguard 2,46 GIC Private Limited 2,33 Namibian Government Institutions
Pension Fund 1,92 Oppenheimer Funds 2,11 BlackRock 1,91 Basson, JW 1,52 T. Rowe Price 1,49 Le Roux, JF 1,41 Government Pension Fund – Norway 1,41
Source: Company information.
Source: Company information.
Source: Company information. Figure 3: Shareholder by Country
Figure 4: Major Shareholders
Figure 5: Total dividends
Source: Company information. Figure 6: Payout-Ratio Figure 5: Total dividends paid to Shareholders
“SHOPRITE HOLDINGS LTD” COMPANY REPORT
long as it is able to maintain the momentum of improving its institutional environment.1
Currently SSA as a region is having a mild increase in regional growth from a bottoming in 2016, in the two years it is projected to rise to 3.2% in 2018 and 3.5% in 2019. This improvement in growth is the being driven by currently rising commodity prices and favourable global financing conditions. A general high debt overhang combined with high dependence on external financing dims these projections of economic growth.2 Currently there is a high fiscal deficit average of
4.4 %, a consequence of a decrease in revenues from commodity extraction which has not been accompanied by a similar drop in government spending.
South Africa
In the last few years the South African economy has suffered anaemic growth, high and rising unemployment (figure 9), high inequality, electricity shortages, a deteriorating fiscal position and high level corruption scandals. In 2017 the government suffered a sovereign credit downgrading to below investment grade. Although the economic outlook has been bleak there seems to be a light at the end of the tunnel, which has led to an improvement in business confidence (figure 10). The current change in regime leadership of the ANC (main ruling party) from Jacob Zuma to Cyril Ramaphosa is, seen as extremely positive both internally with business and consumer confidence spiking and externally with a strengthening of the rand (figure 11) and a rise in the JSE as investors view positively the regime change. This improvements will be accompanied by a favourable minerals market that increases the country’s export value.
Angola, Nigeria & Zambia
The groups 3 main markets outside South Africa were severely impacted by the commodity crash, due to their economies high dependence on commodity exports. Zambia being dependent on Copper, Angola and Nigeria being
dependent on Oil. The two Oil exporters are expected to recover in 2018 with the rise in Oil prices, although both countries’ currencies are expected to suffer further devaluations since the current official rates are not sustainable. Nigeria will benefit from an improving investment confidence, a slowdown in inflation with
1 AFDB: Southern Africa Economic Outlook 2018 2 Africa Pulse World bank.
Source: Bloomberg Source: IMF
Figure 9: SA Unemployment Source: IMF.
Figure 10: SA Business Confidence Figure 7: Commodity Prices
Figure 8: GDP growth rate by resource intensity of economy.
Source: IMF Source: IMF
Source: Bloomberg
“SHOPRITE HOLDINGS LTD” COMPANY REPORT
some uncertainty expected with elections in the second half of the year3.
Angola´s regime change in 2017 as been seen as positive, with shake up of the political establishment and a request for non-financial assistance from the IMF to implement reforms to diversify the economy away from oil. The high demand in 2018 for the countries issuing of Dollar bonds being a positive indicator of external investor confidence in the country. Zambia’s economy is recovering in 2018 with better cooper prices and more favourable weather conditions increasing the countries agriculture output, although the countries high debt levels are worsening and fears of hidden debts are decreasing external investor confidence in the country. The country’s fragile recovery and the relative high competition in the food retail sector as means that Shoprite will decrease its expansion in the country in the mid-term.4
Kenya: Opening a new growth frontier
Unlike the three Economies previously mentioned Kenya and the rest of east Africa are not resource intensive economies, which have meant a stronger economic growth since 2014. Kenya’s economy is expected to grow 5.6% in 2018 with 82% of this growth coming from services and 17% from industry. 5 The
nature of East Africa’s economies, makes it a good target for Shoprite’s expansion as it reduces the company’s revenues exposure, to the commodity dependent consumer markets outside South Africa. Currently the largest local players in food retail in east Africa are going through financial difficulties due to mismanagement, Nakumatt (the largest retailer in East Africa) is filing for bankruptcy and Uchumi (second largest retailer) is going through a financial restructuring. The distress situation of local players as motivated international players to take advantage of the competition vacuum left, with Choppies, Carrefour, Massmart and Shoprite entering the country. This year the company plans to open 7 stores taking previous Nakumatt leases, including Nakumatts largest store in the Westgate mall. Entering in to Kenya improves the prospects of expansion in to other east African countries, since Kenyan players were also the biggest players in this markets (figure 12). Possible expansion targets include expanding Ugandan operations and re-entering Tanzania, were the company previously sold its operations to Nakumatt.
3 Nigeria: Economic Outlook Top 10 themes for 2018. 4 AFDB Economic Outlook Zambia
5 AFDB economic Outlook Kenya Figure 12: Nakumatt presence in Africa
“SHOPRITE HOLDINGS LTD” COMPANY REPORT
Food Retail Sector Analysis
South Africa
The South African food retail sector differs greatly from the rest of sub-Saharan Africa with the exception of Namibia and Botswana, being a much more mature sector. The South African food retail sector is closer to developed economies than to other sub Saharan markets in its characteristics, with modern food retail taking the major share of the grocery market in the country. In 2017, 72.5% of packaged food sold in physical stores was sold in modern retailers (Euromonitor) a level closer to developed markets (figure 13). The market has a relative high level of product quality expectations and a defined shopping culture current retail trends in the country are similar to the ones happening in other developed countries, with an increase in the demand for convenience and an early appearance of online shopping.6 The modern food retail in the country is
consolidated and dominated by local players. Although the market is more developed than other SSA countries there is still opportunity for higher growth levels than in developed economies. Values of consumption of groceries per capita is relatively low of 772 USD (current exchange) compared to developed markets (Europe average 2502 USD) as the share of total retail taken by grocery retail still relatively higher than in this markets (67% v.s ≈ 40%). Grocery store area per capita is currently at 0.17 bellow developed and many emerging markets (Figure 14). The growth of the market in the future will not be related to increases in volume, but instead to the value of the food products consumed as shoppers change their consumption habits with rising incomes. In the mid-term term, South African consumer confidence has spiked drastically (figure 15), this will translate in to increase in spending and a decrease in price sensitivity.
Spazas hold market share
The market share of traditional retailers in South Africa is lower than in other emerging markets but resilient. In the past modern retail grew above the grocery market as modern retailers captured market share from traditional retailers. This momentum has been broken in the last two years; Traditional retailers have managed to maintain their market share with an increase demand for more localized stores, due to convenience, more customised offerings and an increase
6 AT kearny: Retail in Africa still the nex Big thing Source: Euromonitor.
Source: Euromonitor.
Source: Bloomberg.
Figure 13: Packaged food sales by channel in different countries
Source: Euromonitor.
Figure 14: Meters square of Food retail store are per capita
Figure 15: Consumer confidence SA
Modern:
> 500 sqm, centralised chain, with own sourcing of products.Traditional:
< 500 sqm, independently owned, products supplied by wholesalers.“SHOPRITE HOLDINGS LTD” COMPANY REPORT
in commuting cost. The lack of transport costs due to proximity along with the fact that most traditional retailers do not pay taxes, give these players an advantage against larger store formats. The Spaza (traditional South Africa corner store) saw an increase in sales greater than supermarket store formats of 13.4% in 2017.7 This resilience shows that traditional retail is here to stay in the midterm
and that other complementary retail formats beyond supermarkets will be essential to serve the South African consumer.
LSM evolution
A common measure to analyse the South African consumer is the LSM (living Standard Measurement) a measurement developed South African Advertising Research Foundation. This analyses divides consumer in to 10 groups by ranking their different living conditions, such as housing, access to certain products and services. The share of the total South African Population taken by each of these groups, as changed over time, with the groups, 8 to10 (Checkers focus) and 4 to 7 (Shoprite focus), both increasing their share by about 20%
while group 1 to 4 (Usave focus) dropped its share between 2008 and
2016(figure 16). This measure gives a better idea of demand for certain products which could not be as well accessed by simply looking at the change in the nominal values of income. The trend is central for Shoprite’s past and future expansion strategy and the focus of its different formats (figure 17).
Comparables
The most direct comparable companies to Shoprite’s food retail business include 4 South African retailers (Massmart, Spas, Woolworths and Pick ´n´ Pay) and one form Botswana (Choppies). The four mentioned South African retailer along with Shoprite control more than half of the countries food retail market share and more than two thirds of the modern retail market (figure 18). These companies are the most comparable to Shoprite, since they operate in the South African food retail market as direct competitors with some level of expansion in the rest of Africa.
As it is the case of any comparative analysis, one as to take in to account the key differences between the company in focus and the comparable chosen. For this analysis we are only comparing the food retail business which makes up most of the groups revenues. These companies differ in different ways. Woolworths has
7 Nielsen: Spazas Boost traditional trade surge in South Africa.
Source: SARF
Source: Company information Source: Euromonitor. 2014 2015 2016 2017 Shoprite 17,3% 17,8% 18,5% 19,0% Pick `n` Pay 13,1% 13,1% 13,4% 13,5% SPAR 9,9% 10,0% 10,1% 10,3% Massmart 8,1% 8,1% 8,1% 7,9% Woolwoths 6,6% 6,7% 6,9% 6,9%
Source: Euro monitor.
Figure 16: SA Population according to LSM groups
Figure 17: Sales and lSM target
Source: Company information
Figure 18: Market share of Grocery retail market
“SHOPRITE HOLDINGS LTD” COMPANY REPORT
a focus on the most upmarket segment of food retail, with an exposure to Australia targeting mainly a different consumer segment. Spar and Pick ´n´ pay targets a middle class consumer with a product offering that is similar to Shoprite, with Pick´n´pay being the most comparable company. Spar is differentiated in its structure operating as a partnership of independently owned stores. Choppies the smaller of the comparable has less exposure to South Africa, with a wide regional presence. The small player status is changing since it has been growing aggressively with the acquisition of local chains in other African countries. Massmart has a much larger component of non-food products and focuses on wholesale retail (Makro) with 90% of its food sales being resold through traditional retail formats. The presence of Massmart represents one of the biggest competitive threat to Shoprite in the long run, since it is 52.4% owned by Walmart, the world’s largest retail group. Walmart applies a similar competitive pricing strategy to Shoprite, with a larger sourcing structure outside the continent. Shoprite margins are currently above most of its competitors both gross and EBITDA margins, maintaining a good sales growth relative to its already large market share. The higher gross margins, are achieved through a highly efficient centralised and integrated supply chain which reduces, the cost of goods sold below competitors. The comparable which is clearly performing above Shoprite and other competitors on margins and growth is Woolworths. The higher margins are mainly due to a large share of revenues coming from clothing retail, but this is not the full reason as its food retail division has gross margins of 25.1%.8
The higher food retail margins are a result of its focus in the niche high income differentiation based food retail market (LSM 9 -10), were it the competition is currently lower than in other segments. This market has grown faster than the rest of the market, as the share of the total market taken by this niche market, grows with rising incomes in South Africa, leading consumers to trade up in to this niche of consumption.
Sub-Saharan-Africa
The rest of Sub-Saharan Africa is characterised by extremely low levels of modern retail, a highly fragmented market, and extremely low level of grocery consumption per capita, being the region with the least developed grocery market in the world. The expansion of modern food retail in developing countries has been attributed to more competitive pricing, higher convenience, product diversity and quality. The penetration rate (yearly increase in share of total
8 Woolworths Annual report 2017 Source: IMF.
Figure 19: SSA real GDP per capita except South Africa
“SHOPRITE HOLDINGS LTD” COMPANY REPORT
market) of the modern food retail format is driven by the following factors: The growth of aggregate demand (increase in population and income per capita). The level of income with lower income countries showing a higher penetration rate. The share of working age population, as working individuals need more convenient shopping, traditional retail tends to be more time consuming as all products are not necessarily present in the same store. The improvement of conditions necessary for a modern supply chain (e.g. regulation, infrastructure).9
All the mentioned drivers for the penetration of modern retail are highly positive in SSA countries, creating the conditions for a high rate of penetration.
The GDP per capita in these markets is either Low-income (bellow 1,025 USD per capita) or low-middle income (bellow 4,035 USD per capita) (figure 19). In these markets price will be extremely important factor, with shoppers looking at value for money trying to maximise their consumption with limited extremely limited resources and therefore most gains in income will be converted in to the consumption of food products.10 The growth in both incomes per capita and
population is expected to rise above world average after 2017(figure 20).11 What
is considered today the African middle class is about 35% of the population, (350 million people) compared to 27% in 1980, this number is controversial as it considers consumers with an income above 2 USD a day with about 80% of this sample being part of a fragile band with incomes between 2-4 USD.12
Above average increases in both SSA has a population of around 1 billion and is predicted to reach 2 billion by mid-century (figure 21) with an annual average growth rate (2.2%) the world’s highest regional rate. This growing population will be migrating to cities, with urbanization level expected to rise from around 38% to 55% by mid-century (figure 22), with an annual average growth rate of 3.3%. The high urbanization levels will be beneficial for modern forms of retail, were modern supply chains are easier to introduce, and due to the high consumer numbers which provides scale for larger store formats. The segment of working age population (25-64 years), is the fastest growing segment of the population, with an increase from 33.3% of the total population in 1980 to 36.5% in 2015.13
Further integration of the African continent both by improvement in infrastructure and reduction of regional tariffs with the future implementation of the African
9 The expansion of Modern Grocery retailing and trade in Developing Countries, Sharad Tandon, Maurice R. landes,
Andrea Woolverton 2011.
10 The Demand for Food and Calories Shankar Subramanian and Angus Deaton. 1996 11 IMF World Economic Outlook April 2018.
12The Rise of a Middle Class in East and Southern Africa: Implications for Food System Transformation,David T
Schirley,Thomas Reardon, Michael Dolislager,Jason Snyder.
13 UNFPA: The Demographic Profile of African Countries Source: UN statistics.
Source: UN statistics.
Figure 20: Population Growth SSA, SSA (urban) and World
Figure 21: SSA Population
Figure 22: SSA Urbanization level
“SHOPRITE HOLDINGS LTD” COMPANY REPORT
Continental Free Trade Area, will substantially benefit Pan African players allowing for the improvement of supply chain efficiency.
The current total grocery market size for the African continent is estimated to be about 125 billion USD in 2017.14
Modern retailers in Africa
Currently most modern South African retailers are present on multiple countries on the continent, with the largest presence after Shoprite (figure 23) being Pick´n Pay (figure 24). Other modern food retailers present in the continent include French retailers such as Casino and Carrefour in francophone Africa, and single country local players. Carrefour has plans to increase its expansion in to Africa through its middle east Franchise partner Majid Al Futtaim.
Shoprite competitive strategy
Maintaining the bottom of the pyramid while seizing
the top.
Shoprite supermarkets and Usave´s big competitive advantage has been based on pricing, consistently having the lowest price among food retailers. In February 2018, it had the second lowest prices according to South African consumer protection group Retail price watch, the first place was taken by a wholesaler (Makro), a retail format which is not directly comparable(figure 25). The
consistent low prices have made it the supermarket of choice for middle to lower income groups, which have a higher price sensitivity. According to the 2015 SACSI (South African customer satisfaction index reports) 47% of respondents said that they would be willing to change their current supermarket for a drop in price of 5% or less. This price strategy has been particularly successful in recent year in a weak economic environment with low consumer confidence. The company measures its price performance by comparing general food inflation to its internal inflation (price increase of similar food basket), being able to
consistently maintain its internal inflation below the general level (figure 26). Shoprite has been able to maintain price competitiveness in the sector through an optimised supply chain and a strong bargaining power against local and international suppliers. The companies bargaining power comes from the high
14 Shifting Market Frontiers: Africa Rising (Euro monitor International) Source: Pick ´n` Pay Annual report.
Source: Sotuh Africa Retail price watch. Source: Company information
nformation.
Source: Sotuh Africa Retail price watch.
Figure 24: Pick ´n` Pay Locations Figure 23: Shoprite Locations
Figure 25: Price of top brands basquet in different supermarkets
“SHOPRITE HOLDINGS LTD” COMPANY REPORT
volumes it sells due to its position as the largest supermarket chain in Africa. The groups Supply chain makes use of large centralised distribution centres, a fully owned fleet and the latest stock management software, in order to attain high levels of cost efficiency.
Lately the group has taken on new measures to maintain this price
competitiveness such as new seasonal discount strategies (e.g. Black Friday) and increasing its private label brands. Shoprite private label brands currently represents 14% of products compared to global industry average of 18% (Nielsen). Having a larger private brands portfolio the group gains bargaining power over producers and therefore lower prices. Currently the group has two lines of private label brands Ritebrand a budget offering and checker choice a premium offering.
In order to maintain and grow market share of the South Africa food retail Market Shoprite will increase its focus on upper income (LSM 8-10) consumers. The strategy is driven by two factors. These factors are that it has a much lower market share in this segment, and this segment is expected to grow faster in relative terms, than the growth of the middle class sector (LSM 4-7). 15 Checker
being positioning for higher income consumers is central to this strategy, in the past it was differentiated in this sector by fair pricing. Currently it is improving its offering in order to change the quality perception, focusing on fresh products and product innovation. This strategy targets the high margins, higher end consumer niche market, currently dominated by Woolworths. The company reported that 2017´s market share gain equivalent to nearly 1, 5 Billion in rand was attributed to gaining market share in this segment. According to the sales projections estimates, the Market Share which Shoprite has of the total Modern food retail Market, would rise according from 19.4% in 2017 to 22.8% in 2023.
15 PWC: South African retail and consumer products outlook 2012-2016
Higher Sales Volume More Scale: -higher supply chain usage. -More Barganing power. Lower costs per unit. Lower price, advantage over competitors.
Source: Statistics SA and Company information.
Competitive Pricing
strategy, Positive
Feedback loop.
Figure 26: Internal Inflation v.s SA Food inflation
“SHOPRITE HOLDINGS LTD” COMPANY REPORT
Other segements
In order to counter localized traditional retailers, the group as improved its franchisee offering which is a store format more able to compete directly with these traders or convert them in to franchisees. The group is planning on increasing the expansion of this network (figure 27), improving the conditions which franchisees receive (fees paid, marketing), to increase the profitability of Franchisees. This strategy is focused on increasing volume and market share (that other formats cannot reach) instead of a focus on the margins generated by this segment. The complementary offers of the group will be essential for cross selling generating sales in its core food retail business, in taking advantage of the increase in disposable income in the rest on the continent and increasing
margins as this businesses have higher margins than the core food retail business.
Expansion: Going long term in Africa
Shoprite has had a presence outside South Africa since 1990. Most of the expansion has been focused on the Shoprite supermarket store format, more appropriate for the low income African consumer (figure 28). The expansion outside South Africa has not been without setbacks, with reversals of country expansion, however the early presence of Shoprite in this markets, gave the group valuable know-how to operate in these markets. In a current scenario of increasing competition, as other modern retail player attempt to expand to the rest of SSA, Shoprite will have the upper hand over its competitors, due to the know how it has gained and the distribution infrastructure it has set up across the region. Since 2014 this division has suffered from sudden currency devaluation (figure 29) and a steep drop in consumer demand, due to the slow economic performance in these markets. However it has managed to maintain a positive like-for-like growth most years except 2015. Nigeria, Angola represent the majority of the groups’ revenues from outside South Africa, and were economies particularly hard hit by the drop in crude oil prices.
The difficulties in trading during this period were used by Shoprite has a means to gain market share, maintaining its supermarkets supplied in countries with foreign currency restrictions. This was made possible by paying imports with group funds external to these divisions something which local players are unable to do, developing local souring and entering in to agro-business joint ventures in this countries. The import payment strategy has increased the groups risk exposure to these currencies but on the positive side it has increased market
Figure 27: Franchise Stores
Source: Company information and analyst estimates
Figure 28: Shoprite Supermarkets Outside South Africa
“SHOPRITE HOLDINGS LTD” COMPANY REPORT
share and customer loyalty. The group has further invested in the efficiency of its operations outside South Africa by opening in 2017 two distribution centres Angola and purchasing one in Nigeria.
The group applies a strategy of continuous search for new markets to enter, entering the East African market this year. The group is expected to enter new countries in the mid-term as SAA region, continues to provide future opportunities for expansion.
Outside Africa the group continues to search for opportunities of expansion outside the continent in other emerging markets, previously it expanded to India on a franchisee model in 2004, being unsuccessful. An expansion to Eastern Europe was contemplated in 2017; however this expansion was dependent on taking advantage of Steinhoff internationals presence and know how in the region. Since plans to merge with Steinhoff have been cancelled such an expansion is highly unlikely.
Furniture segment
The South African Furniture market is extremely competitive putting pressure on margins of companies operating in the sector. The weak economic performance of the last few years as meant a low growth in disposable income. Since 2009 the nominal size of the furniture market has grown at 5,4% annual rate (figure 30) , if one accounts for inflation there was virtually growth during the period. The market for Home furnisher in South Africa is expected to have a negative growth of 1.9% a year from 2017-2022 (Euromonitor international). This scenario could be slightly improved by the current increase in consumer confidence in South Africa. The market in the rest of Africa is characterised by a faster growth levels, as the region is expected to have the fastest growth of disposables income in the globally in the next decade with expectations of 9% CAGR in disposable income until 2030 (Euromonitor international) more than twice the rate of real GDP growth.
Shoprite position itself in this market for both lower and upper income consumers, with the main focus on lower income consumers “ok Furniture”, selling competitive pricing products, which include furniture, home furnishing and home appliances, on cash and credit.
The upper income focus division “House & Home” is going through stagnated same store sales, which makes the future of the division uncertain. The South African operations have sold loss making stores and are expected to limit expansion due to though market conditions, with no expansion plans in the
mid-Source: Euro Monitor. Figure 30: SA furniture Market. Figure 29: Nigerian Naira and Angolan Kwanza, exchange rate for ZAR indexed base year 2014.
“SHOPRITE HOLDINGS LTD” COMPANY REPORT
term. In the rest of Africa, sales growth has been strong with growth 14.4% in 2017. The group is planning on increasing its expansion in the markets outside South Africa with a particular focus on Angola to compensate for the loss of growth in South Africa.
Forecast
Sales Drivers
In order to forecast Shoprite revenues we need identify the main revenue drivers. Being a retailer Shoprite´s revenues are defined by the amount of sales
generated, in the store area it operates. Therefore sales growth will be defined by the growth in store area and the growth in sales per area unit (figure 31/32). This approach in analysing sales has to take in to account that the two mentioned variables are not independent of each other, and therefore adjustments need to be made. The increase in store area can affect the sales of the previously established store, taking market share and therefore cannibalising sales. The second factor which as to be taken in to account is that new stores will not sell at the same rate as previously established stores on the first year. New stores take some time to establish a stable customer base, as customer changes their previous consumption habits. The rate of sales achieved in the first year compared to established stores, is known as the stores conversion ratio. For the case of Shoprite cannibalisation will not have a materially relevant effect. In the South African Market the current retail store space per capita is 0.17 sqm, bellow developed markets (average 0.52 sqm) meaning that there is still future possibility for growth in store area without a strong cannibalisation. The average past store conversion rate for Shoprite supermarkets in South Africa is about 73%. For markets outside South Africa it is about 100%, since these markets are underserved by modern retail the format, meaning that customers switch their consumption at a faster rate. Knowing the conversion rates we can project future sales by defining the growth rate of the store area and the growth in like-for-like/same store sales (the rate of sales growth in stores that were operating in the previous year).
When using the mentioned drivers to forecast sales growth, we make a separate analysis for the different revenue sources of the group (figure 33).
Figure 31: Supermarket SA growth composition
Figure 32: Furniture growth composition
Figure 33: Percentage of total revenue by sources
Source: Company information and analyst estimates.
Source: Analysts estimates. Source: Analysts estimates.
“SHOPRITE HOLDINGS LTD” COMPANY REPORT
Sales projections
The growth rate of store area is assumed to stay similar to the previous years as South Africa has comparatively low levels of store area per capita, the rest of SSA is extremely underserved by modern retail meaning that there is room to maintain the current rate of expansion. The expansion forecasted is based on organic growth. In the past the group grew its store area through an acquisitive strategy, buying checkers in 1991 and OK bazars in 1997 from SA breweries, these acquisitions were not made with the sole intent of speeding up expansion but to also enter new formats and markets in which the group was not present previously, currently the group has no plans of acquisitive growth planning to maintain an organic growth expansion strategy.
In South Africa it is assume that checkers the openings will grow at 125% of the past growth rate and Shoprite openings at 70%. This assumption is made to reflect the company focusing, its expansion increasingly on its Checkers model as this market segment is expected to grow faster than Shoprite’s. With rising incomes current Shoprite shoppers will trade up their shopping to a Checkers offer (Figure 34).
In order to project like-for-like sales one needs to compare previous growth of the South African modern food retail market in relation to Shoprite’s sales.
In the past these sales have grown on average 0.95% below the market while this market has grown 0.92% above GDP. From 2018 to 2022, Euro monitor projections are used to access the size of the Modern Grocery market in South Africa (figure 35). These projections are in constant prices; therefore we inflate the values with the projected CPI as a proxy for food inflation, and maintaining the same gap going forward of 0.95% below market. From 2023 only GDP projections are available we project like-for-like sales in relation to GDP maintaining these gaps in growth (-0.55%). Food inflation in South Africa has been particularly volatile, since there is an assumption of the same inflation as CPI for food due to lack of projections, this could substantially affect the predictions going forward (figure 36).
For the rest of Africa there is no data about past growth of the modern food retail market, or the grocery market. Shoprite’s previous like-for-like sales growth outside South Africa in rand terms is extremely volatile with no clear pattern and no information of like-for-like in local currencies. As mentioned at the current low levels of income most of per capita gains in income will be converted, mainly to grocery consumption. The increase in total grocery consumption, along with the gains in market share of Modern retail, makes it is reasonable to assume that the modern grocery market is going to growth above nominal GDP, as this is the
Source: Euromonitor.
Source: SA statistics.
Source: Company information and analysts’ estimates.
Figure 34: Checker stores as a percentage of store area.
Figure 35: Modern Grocery Market South Africa
Figure 36: CPI & Food Inflation in South Africa
“SHOPRITE HOLDINGS LTD” COMPANY REPORT
case in other more developed emerging markets (e.g South Africa). Since most modern retail is localized in urban areas we have to take in to account the increase of urban population above general population growth. With these limitations we assume Shoprite’s like-for-like sales increase in Rand terms is equal to real GDP growth in these markets (lower competition will mean that it is able to gain most of this increase unlike South Africa), plus the increase in urban population above general population, adding rand inflation to this growth level. A more accurate prediction would take in to account different currencies sales and project the specific exchange of these currencies exchange rate against the rand. Such predictions would lack accuracy and would be impractical, because of the high volatility of these currencies, and high double digit inflation levels. South Africa having the lowest inflation, out of the countries were the group operates, has a moderately high 5,4% inflation rate. Therefore we assume the real increase in the value of sales and add the rand inflation. The inflation differential between South Africa and other African countries will influence the exchange rate long-term trend, adjusting the rand values of sales accordingly. The faster growth of Supermarkets outside South Africa will mean that the segments percentage of total revenue will increase from 17.6% in 2017 to 24.3% in 2018(figure 37).
Expenses
The expense structure of the group is composed of cost of sales and operating expenses which are fixed costs mainly related to operating the store units, distribution centres, transporting merchandise, administrative costs and in this particular case operating leasing costs, related to store rentals. The main variable COGS is most likely to stay flat as it has in the past, since the groups supply chain is already highly optimised above competitor’s levels, with further gains being unlikely. The slight decrease of this cost in 2016 is the result of a restatement of expenses and not an improvement of gross margin (Figure 38). For most operating expenses the same ratio in relation to sales is maintained, with the exception of lease expenses and depreciation which is directly dependent on the number of stores projected and the average past defined annual escalation of lease payments. Certain items will be largely dependent on the expansion of stores but the historical increase in operating cost above inflation(Figure 39), means that estimating such cost based on store area and inflation would underestimate their future values. Instead the constant ratio of these expenses in relation to sales is used in order to forecast future values. Cost which the increased has been particularly pronounced above inflation in previous years, were security costs, water, maintenance and electricity which suffered the
Source: Company Information.
Source: SA statistics Source: Company information Figure 38: Shoprite Gross margin
Figure 39: Modern Grocery Market SA. Figure 37: Forecast of sales by segment
Source: Company information and analysts estimates
“SHOPRITE HOLDINGS LTD” COMPANY REPORT
effects of ESKOM (South Africa Electric public utility) electric production mismanagement.
EBITDA Margin
Shoprite has managed to maintain an EBITDA margin above 7% in the last 5 years(figure 40). The current margin is above its peer’s average (5.53%) and above all its direct competitors with the exception of Woolworths which has a margin above 12%. In the future there will be pressures both upwards and downwards, we project the margin to remain stable with a slight increase, caused by a decrease in the cost of operating leases in relation to sales. Possible
upward pressure on margins will be the increase in the share of checkers sales and the improvement of efficiency in operations outside South Africa with new DC´s, impacting gross margins in these markets. The Downward pressure will come from a continuation of the increase in operating expenses above inflation. In a scenario were the upward pressures are greater than the increase in Operating expenses, an increase in margin would be capped by competition. Currently margins are already high compared to both global and local average (5.53%/5.66%) higher margins would turn the sector extremely attractive,
bringing new entrants in to the market. A similar dynamic is happening already in the market; with Shoprite increasing its expansion in to the high income market, which Woolworths dominates, attracted by the high margins in this market. In a scenario of increasing competition margins would suffer as Shoprite would convert its margins gains in to lower prices for consumers in order to maintain market share through price advantage.
Capex
Shoprite´s Capex is divided in to 5 main items, Land Building & leasehold improvements, Refurbishing, New stores, information technology and other replacements (figure 42).
Land Buildings & leasehold improvements, include developments of stores in areas where there are no available parties willing to invest, purchasing of land in strategic areas for development and expenses with store properties the group leases. This expense is greatly reduced for Shoprite has it does not own most of its stores leasing them instead. The other items include equipping new stores, refurbishing old ones. Investment in intangible assets include investments in software mainly, in merchandise management systems, central stock ledger
Source: Company information and analyst estimates.
Figure 40: Shoprite EBITDA margin
Figure 41: Total Supermarket area Source: Company information and analyst estimates.
“SHOPRITE HOLDINGS LTD” COMPANY REPORT
system, which are essential to maintain the groups supply chain efficiency, translating in to competitiveness in the cost of its products. These IT investments are winding down in 2018 with major updates in 2016 and 2017 meaning that 2015 ratios used to project capex going forward.
Other replacements include a variety of items that are not included in the previous categories, such as office equipment, furniture and equipment in distribution centres, these values will also be kept at 2015 ratios, due to the decrease in the rate of expansion of the distribution network.
Capex will be driven mainly by the size and increase of store area (figure 41), therefore in order to project capex expenses we assume a similar ratio between capex and the increase in store area or total store area going forward (the suitable for each item) increasing this rate according to ZAR inflation.
Net working Capital
The groups NWC efficiency has deteriorated in the last few years. Inventory days have increased from 56 in 2015 to above 60 mainly due to stock clearance issues, in its operations outside South Africa and short term increase due stocking of new distribution centres, since the area of distribution centres has been growing above sales due to the groups push to maintain price
competitiveness. Going forward this position will tend to improve substantially (Figure 43), as the group decreases the rate at which it is expanding its
distribution network. New distribution centres increase stock once they open, but in the following periods increase efficiency in stock management decreases inventory needs of individual stores. For operations outside South Africa, stock management is expected to improve. Stock clearing issues caused by lack of reserves are expected to improve with easing of forex restrictions, and the opening of distribution centres in Angola and Nigeria are going to substantially increase inventory management efficiency in what accounts to more than half of sales outside South Africa. This improvement is already being seen with a drop in stocks in January 2018 in comparison to the previous year. Other networking capital items are expected to stay as a similar ratio of sales going forward, as there is no indication of future change in days payable or receivables.
Other Items
Forex volatility and restrictions
Source: Company information and analyst estimates.
Figure 43: Total Size of inventory in relation to required days of sales Source: analyst estimates.
Figure 42: Capex by category in ZAR millions
Source: Company information and analyst estimates.
“SHOPRITE HOLDINGS LTD” COMPANY REPORT
With operations in 15 different countries forex volatility tends to have quite a large impact on the results of Shoprite’s foreign operations in ZAR terms. This volatility has been quite high in recent years particularly in its 3 largest markets. In order to hedge the risk of currency volatility the group prepays all its foreign suppliers and keeps the minimum cash required for its operations in local currencies outside South Africa converting all excess cash in to USD, since it is an highly liquid and stable currency.
The group also had to deal with local exchange controls in Angola and Nigeria, being forced to keep its cash in local currency. The operations in these countries are in expansion with the local capex needs being greater than the cash
generated; therefore these restrictions do not cause substantial problems in the allocation of funds. The restrictions however have an impact in the increase of the group’s exposure to local currency risk. In order to mitigate the risk of currency devaluation in Angolan Kwanzas the group currently holds 1311 million ZAR in Angolan Government bonds which are paid in Kwanza with its payments indexed to the USD. The bonds are a hedging strategy which substantially exposes the company to Angola Sovereign risk, but the only viable option to hedge Kwanza currency risk.
Excess cash
Shoprite will tend to have a constant amount of excess cash due to the nature of the FMCG business, which tend to have a negative cash conversion cycle. This amount of cash is generated due to the difference between, the numbers of days required to pay supplier (around 60 days for Shoprite) compared to the number of days it takes to convert inventories in to cash, when the latter period is smaller the company generates a negative cash cycle maintaining a constant amount of excess cash. For Shoprite the effect in 2017 was positive as days of inventory sales increased to 60 days. The possibility of a temporary increase in inventory days and other unforeseeable operating cash necessities requires the company to keep 2.5% of sales as operating cash, 0.5% above the necessity for a retail company, due to the lack of access to liquidity in SSA markets.
Operating leases
Shoprite does not own the majority of its stores leasing them from lessor partners (REITS, private investors) instead; such an arrangement means drastically decreases the company’s capital necessity. These leases give some flexibility to the company in relating to divesting from certain areas, but with limitations since
Figure 44: Capital employed
Source: Company information and analyst estimates.
“SHOPRITE HOLDINGS LTD” COMPANY REPORT
most lease agreements are made between 1-5 years. The lease commitments could be compared to debt since they share similar characteristics as fixed tax deductible financial obligations paid despite performance.
Therefore we analyse the impact of using operating leases instead of acquiring these properties through debt financing. The current yield on retail real estate in Africa is on average of 10.2% between a low 9% (South Africa) to 17% (Angola). We access the value of these retail properties by dividing the lease payments by the average yield.16 In this case the leverage of the company increases
considerable compared to its peers with the Net Debt/Enterprise value rising, from a low 2.3% to a ratio of 24.1% above its peer’s average. The group’s ROIC adjusting its Noplat, according to the increase in depreciation expenses and removing lease expenses, drops substantially to 15.7%. The WACC also drops with the increase in financial leverage to 9.99%. In both case the company is creating value however using leases the company manages to greatly increase its ROIC.
Valuation
Based on the DCF valuation performed for Shoprite holdings, the forecasted share price is 251.59 ZAR. This value is accesses by the value of the Enterprise deducting debt, summing Non-operating assets and summing 2018 dividends which will be substantial (9% of equity value) as the company adjusts its net debt to the optimum level, issuing debt and paying the excess cash. The final target price will be a weighted of the DCF of the base scenario and the negative
scenario (85%/15%), giving us a final value of 245.22 ZAR per share. The current price and expected dividend yield (2.23% year, past average yield) will represent a gain of compared to the price estimate FY 2018 of 3.97% which (6.8%
annualised) which would represent a hold recommendation.
Previously the share price of the company had performance in USD above both its direct competitors and the MSCI world index, since November of 2004 until April 2018, with a yearly CAGR of 20.19%, considerable bellow the estimated cost of equity (figure 45).
16 Africa report Knight Frank 2017/2018
2016 2017 2018 2019 2020 2021 2022 2023
ROIC 25.1% 20.8% 19.7% 19.5% 21.8% 23.2% 24.3% 25.0%
ROIC without using operating leases 17.6% 15.7% 15.2% 15.4% 16.3% 16.8% 17.3% 17.6%
Figure 45: Capital gains of stock against MSCI world and direct competitors.
“SHOPRITE HOLDINGS LTD” COMPANY REPORT
The most correct way to Value Shoprite would be a sum of the parts method, taking in to account the value of the different segments, since each segment has a different WACC different capex needs and different growth rates. The company presents limited information on each segment with no description of the split by segment in, operating expenses, gross margins, capex and investment in NWC. Due to the lack of information a DCF analysis is done of the consolidated accounts, instead of each segment.
Valuatio peers
For a broader comparable analysis, the estimation of equity betas and the optimum capital structure 12 food retailers were chosen that have a substantial exposure to emerging markets. The exposure to emerging markets was used as selection criteria due to similarity of markets aspects such as a higher growth of the food retail market, lower share of Modern retail in the grocery market, and less food retail store area per capita. In order to analyse the Furniture division 4 furniture retailers are used in this case the sample available, was much smaller.
Capital sturcutre
Currently Shoprite holds a particularly low Debt to Enterprise value of 2.3%, being mainly financed with equity; however it does take advantage of operational leverage due to its extensive use of operating leases to finance its stores. Fort its peers the average D/EV is around 12%, for its African competitors it is around 7% a consequence of higher costs of debt and access to credit in Southern Africa compared to other regions of the globe. For valuation purposes we assume an optimal capital structure equivalent to its African competitors as the groups financing conditions will be closer to its African competitors.
WACC
The WACC of the company will have to take in to account the cost of capital of the different segments in which the company operates, since there can be differences in both the cost of its equity and the optimum capital structure. The South African food retail segment, the food retail segment in SSA, and other segments (mainly franchisees) are assumed to have the same WACC (figure 48) with a different WACC for the furniture segment (figure 47). Therefore our company WACC will be weighted average according to revenues, with around 3.85% weight for furniture and around for food retail 96.15% (figure46).
Figure 46: WACC Company
Figure 47: WACC Furniture segment
Figure 48: WACC Food retail Segments
WACC Shoprite Holdings Levered Beta 0.96 E/EV 93.2% Taxes 28.0% Risk free 6.4% RE 11.0% RD 7.9% WACC 10.7% WACC furniture Levered Beta 0.99 E/EV 99.2% Taxes 28.0% Risk free 6.4% RE 11.2% RD 7.9% WACC 11.1% WACC Food Retail Levered Beta 0.96 E/EV 93.0% Taxes 28.0% Risk free 6.43% RE 11.0% RD 7.9% WACC 10.7%
Source: Analyst estimate. Source: Analyst estimate.
“SHOPRITE HOLDINGS LTD” COMPANY REPORT
Cost of Equity and Risk free
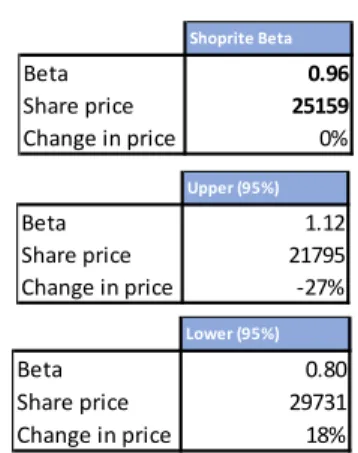
In order to analyse the cost of Equity for Shoprite Holdings we measure the systematic risk, of Shoprite global comparable emerging market food retailers and furniture retailers, against the MSCI world index. We define the sector Beta by regressing the excess dollar returns of the index against the excess dollar returns of the comparable. We analyse the returns in USD because USA investors represent the biggest foreign investors in Shoprite with a 27% share of equity and the USD is the most widely used global reserve currency, therefore the currency in which the global investor will use to benchmark his returns. Once we have the Beta of the comparable, we unlevered each beta according to the each company’s specific capital structure. The average unlevered beta is releveled according to the optimum regional Equity/Enterprise value ratio. The levered Beta for food retail segments is 0.9637 while the levered beta for furniture is 0.9947. The sample used for the regression is, daily returns from 2014 till February 2018. Daily returns were used has regressions have a low P-value comfortably rejecting the null hypothesis and the sample had the lowest variation in the beta value. The highest and lowest beta for a 95% confidence interval varies considerably between 1.12 and 0.8 for the company. Having a considerable impact on the valuation and changing the current recommendation in each extreme.
The market risk premium assumed is the excess returns of the MSCI in dollars over the same period (4.78%). Since we are valuing our results in ZAR (South African Rands) we need to take in to consideration the difference in inflation in comparison to the USD, therefore we use a ZAR risk free rate. In order to calculate the ZAR risk free rate we add the inflation differential to the US 10 year treasury yield.
Cost of Debt
Shoprite being a company with a relatively low level of debt has publicly traded bonds, with its debt being composed mainly of unsecured bank loans in ZAR and USD (the company holds hedging instruments for these loans), with varying interest rates ranging from 1.82% to 10.78%, according to country, currency and the conditions on the loans. Previously the group had most of its debt as
convertible bonds (4655 ZAR million, 2016), these bonds were fully converted in to equity in 2017. Shoprite Beta Beta 0.96 Share price 25159 Change in price 0% Lower (95%) Beta 0.80 Share price 29731 Change in price 18% Upper (95%) Beta 1.12 Share price 21795 Change in price -27%
Figure 49: Levered Betas
Source: Bloomberg. Source: Analyst estimates. Source: Analyst estimate.
“SHOPRITE HOLDINGS LTD” COMPANY REPORT
To evaluate the cost of debt for Shoprite we need to know the current yield according to the company ratting. The group is not rated by any global credit rating agency however the local currency Blomberg rating (no major rating agency gives a rating to the company) is of A1, above the current South African sovereign rating of Baa3. Due to the high exposure to the country we assume that there is a sovereign debt ceiling therefore the yield is assumed to be the same as the South African Government bond. The cost of debt will be the yield subtracting the credit loss rate (probability of default (1.29%) multiplied by the loss given default (37%)).17
Terminal value & Perpetual Growth
The DCF valuation as an explicit forecast period from 2018 until 2023, a period which is reasonable to predict the evolution of the company and which the similar competition and market dynamics will be maintained, after this period a terminal valued is considered. The growth of this terminal value will be ZAR inflation since growth of sales in the South African market sales will trend towards food inflation. The average ROIC of the three final years was 24.1% meaning that the group will need an investment rate of 22.74%.
Comparable analysis
To evaluate how Shoprite is being valued in the market, compared to companies with similar characteristics, we analyse its multiples against comparable
multiples. The two chosen multiples are EV/EBITDA and EV/Sales, as they are the two most relevant multiples to analyse the valuation of a retail company. On a fist analysis Shoprite is overvalued compared to its peers having a higher than average number for both multiples, however we have to consider the differences in the company that could lead to these differences. For the EV/EBITDA multiple, there is a need to take in to account the 3 years average growth of sales. This average is inflated by an outlier from the sample which is Choppies enterprises with 78.2% growth in sales, if one removes this outlier the growth drops to 8.5% below the current 8.7% for Shoprite, a higher growth number leads to a higher multiple all else remaining equal. In the case of EV/Sales multiple Shoprite is substantially above average (0.8 vs 0.55) one explanation for this is the above average EBITDA margin (7.03% vs 5.53%) meaning that the company is able to convert a larger share of its sales to earnings.
“SHOPRITE HOLDINGS LTD” COMPANY REPORT
Sensitivity analysis
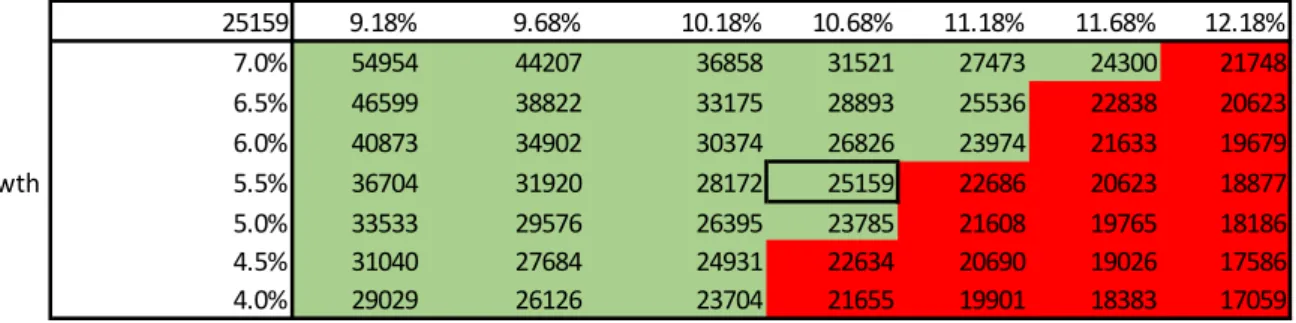
We analyse the current impact of a change in WACC and terminal value on the value of the shares. In this analysis we have to take in to account that a change in the terminal value could have an impact in WACC as both values are affect by ZAR inflation. The WACC is increased and decreased by an absolute value of up to 1.5%, and the terminal value by an absolute value of up to 1%. This analysis shows a high sensitivity of the share value towards the two variables, in red are the values below the current share price wile in green are above.
Scenario Analysis
The main scenario changes that could greatly affect our analysis would be a change in the economic performance of the continent or in the social stability of South Africa. In the case of social instability in South Africa caused by high income inequality and high unemployment, the impact would be negative but extremely uncertain. Different political and social changes could happen with impact on the company’s sales and operations.
A variable that could have the most effect on the economic performance of the continent is the high and increasing debt overhang (figure 50), creating a financial fragility which could lead to a continent wide sovereign debt crisis. A faster than expected increase in US rate hikes, drastically increase lending rates for foreign finance dependent countries and another steep drop in commodity prices contracting government revenues are some of the possible triggers. In order to evaluate the impact of such a scenario would have on the share price, the GDP growth assumptions are change to be 50% of the base level and the expansion levels are assumed to be 75% of the base level. The decrease in expansion would be less substantial as the fall in GDP growth as Shoprite in the past as used such opportunities in the past to maintain expansion in order to gain market share. In such a scenario the Share price would be 209.15 a drop in 16.09% compared to the base case scenario.
WACC 25159 9.18% 9.68% 10.18% 10.68% 11.18% 11.68% 12.18% 7.0% 54954 44207 36858 31521 27473 24300 21748 6.5% 46599 38822 33175 28893 25536 22838 20623 6.0% 40873 34902 30374 26826 23974 21633 19679 Terminal Growth 5.5% 36704 31920 28172 25159 22686 20623 18877 5.0% 33533 29576 26395 23785 21608 19765 18186 4.5% 31040 27684 24931 22634 20690 19026 17586 4.0% 29029 26126 23704 21655 19901 18383 17059
Figure 50: Public Debt level 2013 vs 2016
“SHOPRITE HOLDINGS LTD” COMPANY REPORT
Financial Statements
Consolidated Balance Sheet
ZAR million 2015 A 2016 A 2017 A 2018 F 2019 F 2020 F 2021 F 2022 F 2023 F
current Assets
Excess cash 4219 3533 4242 4242 4242 4242 4242 4242 4242 Operating Cash 2842 3251 3525 3899 4385 4933 5582 6332 7194 Trade and other receivables 5028 5572 5608 8454 7246 8150 9223 10463 11887 Inventories 13 321 15 055 17 794 19 053 20 657 22 372 24 617 27 133 29 924 Current income tax assets 44 146 154 135 152 171 194 220 250 Loans and receivables 606 869 1 321 1 461 1 643 1 848 2 092 2 373 2 696 Derivative financial instruments 0 0 1 1 1 1 1 1 1
Total current Assets 26 060 28 426 32 645 37 246 38 326 41 717 45 951 50 763 56 194
Non current Assets
Property, plant and equipment 15 374 16 908 18 407 21 425 23 802 26 288 29 275 33 256 37 913 Intangible assets 1 458 1 857 2 355 2 381 2 645 2 921 3 253 3 695 4 213 Deferred income tax assets 569 698 859 859 859 859 859 859 859 Held-to-maturity investments 0 0 1 311 1 311 1 311 1 311 1 311 1 311 1 311 Equity accounted investments 178 95 27 27 27 27 27 27 27 Assets held for sale 13 17 119 119 119 119 119 119 119
total Non-current Assets 17 592 19 575 23 078 26 122 28 763 31 525 34 843 39 267 44 442
Total assets 43 652 48 001 55 723 63 367 67 090 73 242 80 794 90 031 100 635 Total Equity 18 893 21 139 27 749 18 873 20 186 23 681 27 942 33 351 39 528 0 0 0 0 0 0 0 0 0 Current Liabilities Borrowings 4 872 5 124 3 274 10 906 10 762 10 569 10 413 10 245 10 067 Bank overdrafts 3 2 965 5 058 10 345 10 208 10 026 9 877 9 718 9 549 Trade and other payables 17 432 16 590 17 414 20 714 23 294 26 203 29 652 33 637 38 215 Current income tax liabilities 960 574 582 883 993 1117 1264 1434 1629 Provisions 457 454 386 386 386 386 386 386 386
total current Liabilities 23 724 25 707 26 714 43 234 45 643 48 301 51 593 55 420 59 847
Non current Liabilities
Fixed escalation operating lease accruals 846 995 1164 1164 1164 1164 1164 1164 1164 Derivative financial instruments 2 32 0 0 0 0 0 0 0 Deferred income tax liabilities 187 128 96 96 96 96 96 96 96
total Non current Liabilities 1 035 1 155 1 260 1 260 1 260 1 260 1 260 1 260 1 260
Total Liabilites 24 759 26 862 27 974 44 494 46 903 49 561 52 853 56 680 61 107