THIS REPORT WAS PREPARED BY JOSÉ MARIA LIMA, A MASTERS IN FINANCE STUDENT OF THE NOVA SCHOOL OF BUSINESS AND
ECONOMICS, EXCLUSIVELY FOR ACADEMIC PURPOSES.THIS REPORT WAS SUPERVISED BY ROSÁRIO ANDRÉ WHO REVIEWED THE VALUATION METHODOLOGY AND THE FINANCIAL MODEL. (SEE DISCLOSURES AND DISCLAIMERS AT END OF DOCUMENT)
See more information at WWW.NOVASBE.PT Page 1/39
M
ASTERS IN
F
INANCE
E
QUITY
R
ESEARCH
We start our coverage of Shoprite Holdings Ltd with a recommendation of SELL and a price target FY14 of 158.6 ZAR. Each share presently trades at a premium of 3.05% at 163.6 ZAR and yield a -19.4% one year return.
Macroeconomic prospects at home may pressure sales. Economic growth is expected to slow down to 2.8% given
the decrease in commodity prices and the capital outflow of the country. Government and trade deficit are long-turn concerns for us. We expect 2014’s LfL to be pressure and to be the smaller ones in the last 3 years, 4.18%, nevertheless the company wishes to trigger growth through the opening of 100 new supermarkets.
Africa sparkles in the horizon. Shoprite desires to continue its expansion strategy, replicating its business model, in Sub-Saharan Africa. An acceleration of store openings and maintenance of two digits growth in sales are expected in the next decade (24.2% in 2014).
Suppliers pressure Working Capital affecting cash flow. Working Capital has turned positive in 2013 and we expect it
to be maintained. This is explained by the relative decrease of Accounts Trade Payables. To control the margin between CPI and PPI, retailers are paying faster to get discounts.
Strong financial and liquid position. The company currently has a D/E of 27.1% and a level of cash equivalent to 6% of sales. We believe that D/E will decrease overtime to reach national competitors and that cash may be used to financing an acquisition outside the continent which is a major concern for us.
S
HOPRITE
H
OLDINGS LTD
C
OMPANY
R
EPORT
F
OODR
ETAIL 6JANUARY 2013S
TUDENT:
J
OSÉM
ARIAL
IMA[email protected]
The start of an International Firm
Strong growth profile abroad, solid cash flow
generation at home
Recommendation: SELL
Vs. Previous Recommendation
Price Target FY14: 158.6 ZAR
Vs. Previous Price Target
Price (as of 5-Jan-14) 163.6 ZAR
Reuters: SHPJ.J, Bloomberg: SHP SJ
52-week range (ZAR) 158.08-206.37 Market Cap (ZAR m) 94,432.140 Outstanding Shares (m) 535.143 Average Daily Volume (last 3M) (m) 2.663
1-Year Return (%) -19.4
Source: Bloomberg and Company’s Data
Source: Bloomberg
(Values in ZAR millions) 2013 2014F 2015F Revenues 92,747 105,603 120,877 EBITDA 6,745 7,854 9,023 EBIT 5,359 6,112 7,041 Net Profit 3,615 4,269 4,952
EPS 6.76 7.98 9.25
DPS 3.19 3.99 5.09
ROIC 36.9% 29.2% 29.8%
Working Capital 2,519 2,868 3,283 CAPEX 3,568 3,338 3,99 Source: Company’s Data and Analyst Estimation
Company description
Shoprite is the biggest food retailer in Africa. The company has its main operations in South Africa but it is also present in other 16 Sub-Saharan countries. The company’s most
SHOPRITE HOLDINGS LTD COMPANY REPORT
PAGE 2/39
Table of Contents
EXECUTIVE SUMMARY ...3
COMPANY OVERVIEW ...4
COMPANY DESCRIPTION ... 4
SHAREHOLDER STRUCTURE ... 5
DIVIDEND POLICY ... 5
MACROECONOMICS ...6
MACROECONOMICS OF AFRICA ... 6
MACROECONOMICS OF SOUTH AFRICA ... 7
THE SECTOR ...9
SECTOR DESCRIPTION ... 9
COMPARABLES ... 11
BUSINESS UNITS: DESCRIPTION AND FORECASTS ...13
SUPERMARKETS IN SOUTH AFRICA ... 13
SUPERMARKETS OUTSIDE SOUTH AFRICA ... 18
FURNITURE ... 21
OTHER OPERATING SEGMENTS ... 23
OTHER IMPORTANT ITEMS DESCRIPTION AND FORECAST ...24
FINANCIAL DEBT ... 24
EXCESS CASH ... 24
SUM-OF-PARTS VALUATION ...25
WACC... 25
TERMINAL VALUE ... 27
PRICE TARGET ... 27
SENSITIVITY ANALYSIS ... 29
SCENARIO ANALYSIS ... 29
MULTIPLES ANALYSIS ... 30
SWOT ANALYSIS ...31
APPENDIX ...32
SHOPRITE HOLDINGS LTD COMPANY REPORT
PAGE 3/39
Executive summary
Shoprite Holdings is South Africa’s biggest Food Retailer, having approximately 92 Billion rands in Sales in the year ending in June 2013. Nearly 86% of the group’s total sales come from the internal market, being the remaining 14% related with the group’s international expansion in other Sub-Saharan African countries. Shoprite is a truly African company.
Africa has been able to present a concrete and sustainable growth profile during the last years, having grown 6.5% in 2012. South Africa is the continent’s most developed nation and it is considered an emerging economy. Nevertheless growth has been slowing down and the country is only expected to grow 2.8% in 2013. Moreover South Africa has numerous structural issues like its deformed labour market, its public and external deficit and its idiosyncratic social and ethnic problems.
Modern Grocery Distribution penetration rates have hugely increased in the last 10 years, representing 55% of total Food Retail market. This is explained by the positive evolution of consumption, living standards and urbanization that changed the way South Africans consume. The market is controlled by 5 major companies: Shoprite, Pick n’ Pay, Spar, Massmart and Woolworths; being Shoprite the biggest player with a share of 32.5% last year.
Supermarkets in South Africa are responsible for 83% of EBITDA, but Supermarkets outside South Africa are the ones that have been presenting greater evolution, growing always above two digits in the last 5 years (27.9% in 2013). Shoprite’s international expansion is already responsible for 12% of EBITDA. The company’s EBITDA Margin is of 7.4% which is above industry average of 5.8%. It is our belief that these margins are not sustainable in the long run because of the pressure that national suppliers are making to increase prices (PPI is above CPI), which has already turned Working Capital positive, damaging the Cash Flow.
Shoprite has a strong financial and cash position. Debt to Equity is of 27.1% and the debt profile is almost entirely convertible bonds. Shoprite currently has a cash position above the requirements for Working Capital (6% of Sales). The possible use of this money for an M&A operation outside Africa is of great concern for us, since the company does not have market know-how outside Africa.
We start our coverage of Shoprite with a SELL recommendation and a target price of 158.6 rands. Despite the growth profile of the company, its robust financial and cash situation and its well planned international expansion, the market is trading the company at a premium of 3.05%.
Shoprite is South Africa’s
major Food Retailer
Africa is passing through a positive period in economic terms. Nevertheless South Africa has been slowing down
The South African Food Retail market has dramatically changed in the last decade
EBITDA Margin of Shoprite is above industry, but it may not be sustainable in the long-run
The possibility of an M&A operation outside the continent is a major threat for the company solid position
SHOPRITE HOLDINGS LTD COMPANY REPORT
PAGE 4/39
Company overview
Company description
Shoprite Holdings is a South African Food Retailer group. Shoprite was founded in 1979 and it is nowadays the major player in the food retail market of the country with 32.5% market share of the Modern Grocery Distribution1 and the biggest supermarket chain in the African continent. The company currently operates 2179 stores in all Sub-Saharan Africa (SSA) within several different businesses and brands. Reaching several target markets and individuals through its different brands and supermarkets types, Shoprite aims to be a company that reaches all people from all classes. The company’s vision is to provide low prices and create a trustful relationship with its customers in an appropriate shopping atmosphere.
Currently one can subdivide the group’s businesses in three segments: Supermarkets, Furniture and Other operating segments. The contribution to Total Sales and EBITDA of each Business Unit has remained stable during the last 5 years as observable in Figures 1, 2 and 3, despite the decrease in the foreign businesses of the company following the 2008 International crisis, this part of the group is the one with the highest potential for future revenue and profit growth. The supermarkets branch includes three different types of brands that are Shoprite2, Checkers and Usave. The Furniture segment has three different kinds
of stores too, which are OK Furniture, OK Power Express and House&Home. The other operating segments include several diverse businesses from a food chain, Hungry Lion, several franchisee operations and Liquor and Pharmacy Stores.
The company is currently present in other 16 Sub-Saharan countries besides South Africa, with a main focus on Namibia, Angola, Zambia and Nigeria. The Sales outside SA represented in June 2013 nearly 14% of Total Sales, which represents an increase in its contribution of 2.1 percentage points since 2010, when it represented only 11.9% of Revenues. Operations abroad and its growth are the crown jewel and future long term drivers of Shoprite Group.
1
Modern Grocery Distribution refers to modern retailing that is basically organized trade. It is the opposite of the concept of Traditional Grocery Distribution.
2
The first and main trademark of the group.
0% 20% 40% 60% 80% 100%
2008 2009 2010 2011 2012 2013
Figure 1: Evolution of Each Business Unit Contribution
to Total Sales
Other Operating Segments Furniture
Supermarkets Non-SA Supermarkets SA Source: Company Data
0 20 40 60 80 100
2008 2009 2010 2011 2012 2013 Billion
Rands
Figure 3: Evolution of Total Sales and Geographical
Contribution
Sales outside South Africa Sales in South Africa Source: Company Data 0%
20% 40% 60% 80% 100%
2009 2010 2011 2012 2013
Figure 2: Evolution of Each Business Unit Contribution to
EBITDA
SHOPRITE HOLDINGS LTD COMPANY REPORT
PAGE 5/39
Shareholder structure
Shoprite Holdings currently has 570,579,460 common shares with a nominal value of 113.4 cents each. The Share Capital of Shoprite remains constant at 650 Million shares with a nominal value of 113.4 cents each. The division of the company’s shares can be seen in Figure 4,5 and 6. As it can be seen, Shoprite has a much diversified base of shareholders both geographically and institutionally. Wiese and Basson, both founders of the company and Chairman and CEO respectively still own 15% and 1.8% correspondingly. They are in the company since day one, and their succession, given their old age, 71 and 67 correspondingly, is one of our major concerns in the long run. The shareholder structure of Shoprite exhibits numerous financial investors like Banks, Funds and Pension Funds, both national and international. This fact is particularly related with the exposure of the company to not only South Africa but also to the rest of Sub-Saharan Africa (Supermarkets outside South Africa represents 13.7% of Enterprise Value), being a good stock for a portfolio that wants an African exposure. The South African Government Pension Fund is the second bigger shareholder of Shoprite. This is the biggest pension fund in Africa3 and it is an independent entity responsible for the pensions and
retirement benefits of South African public employees. So the government has no direct participation in the firm’s equity. Free Float represents 37.9% which is an indicator of this stock’s great liquidity.
Dividend Policy
Shoprite’s dividend for the fiscal year ended in June 2013 was of 3.19 rands per stock. This means that total dividends were approximately of 1.7 Billion rands and represented 47.3% of the company’s earnings. Pay-out ratio advance from 36.8% in 2008 to 47.3% in 2013 (Figure 7), but it is still low considering other companies in the JSE, since the company is still investing a lot in the expansion of its business in SA and in their foreign operations. Nevertheless, Pick n’ Pay has an even lower Pay-out ratio of 21.9%. Dividend yield was of 1.8%, being decreasing since 2009. Shoprite’s dividend yield is very low considering its main comparables and the JSE’s companies, Pick N’ Pay has an expected average dividend yield of 3.9% for 2013, and Spar of 4%. The average dividend yield in the Johannesburg Stock exchange was of 2.83%. This difference can be explained as dividends are not growing at the same pace than the price per share, dividends grew 193% in the last 5 years, while the price per share grew
3
It has more than 1 Trillion rands of assets and 1.2 Million active members.
Source: Company Data
45,3%
32,0% 3,9%
3,3% 2,6%
12,90%
Figure 5: Geographical Break-down of Beneficial
Shareholders
South Africa USA Luxembourg UK Singapore Other Source: Company Data
17,37%
6,21%
76,42%
Figure 6: Management Position
Management Own Shares Public Owners
SHOPRITE HOLDINGS LTD COMPANY REPORT
PAGE 6/39
320%. Consequently Shoprite’s yield is declining in relative terms since the market is valuing more the firm.
Macroeconomics
Macroeconomics of Africa
Unlike the developed world and most of the emerging nations, Africa has been able to present a solid and sustainable growth profile during the last years, in an adverse world economic context. Africa’s future is very optimistic according to several international institutions, nevertheless a change in the economic profile of the continent and the stabilization of institutions is imperative for the concretization of those prospects4.
The continent’s economy grew more than 6.5% in real terms during the last year with projections assuming a slower growth during 2013 and 2014. This economic slowdown is due to the lower growth in countries that have a stronger relationship with the global economy or are facing social and political unrest. Nevertheless we must take into account that the 2012’s growth was positively influenced by the restoration of the Libyan oil production sector. However the forecasts are still one of the highest in the world (Figure 8). This economic evolution originates from a diverse variety of factors: exports, private consumption, public spending and private investment are all increasing.
The main aspect that is influencing African economic prosperity is the evolution of the price of commodities in recent years (Figure 9). Countries that have plenty of resources have been taking advantage by increasing exports and receiving significant private investment from developed countries and even China. Oil, gas and mineral production are at maximums and there is an additional boost in the production of agricultural goods, given good harvest years.
This money flow has been a challenge for governments and society in general. Government spending and private consumption are increasing. Nevertheless government’s fiscal balance does not present a problem giving the increase in revenues from this new economic era. Governments should take this opportunity
4
According to the African Economic Outlook 2013.
Source: Company Data and Analyst Estimation
-2,00% 0,00% 2,00% 4,00% 6,00% 8,00%
2010 2011 2012 2013
Figure 8: Real Economic Growth Evolution
Europe North America Latin America Asia & Oceania Africa
Source: United Nations Data
50 70 90 110 130 150 170 190 210 230 250
2005 2006 2007 2008 2009 2010 2011 2012
2005=10 0 in US$
Figure 9: Commodities' Prices evolution
SHOPRITE HOLDINGS LTD COMPANY REPORT
PAGE 7/39
-8,0% -6,0% -4,0% -2,0% 0,0% 2,0% 4,0% 6,0% 8,0%
2005 2006 2007 2008 2009 2010 2011 2012 2013F 2014F 2015F 2016F
Figure 11: SA Macroeconomics Indicators
Economic Growth Fiscal Balance External Balance
Source: IMF Macroeconomic Forecasts
to develop other sectors in the economy besides the primary. The so call Natural-resource base structural transformation must occur in the continent in the near future, especially in the countries that are benefiting the most from the money inflows. The development of a strong manufacturing sector and the investment in education and human development has to be a priority. Furthermore, both political and administrative structures are still lacking and without a serious investment, which might compromise economic growth in the long run.
Monetary policy has also been a great challenge. Influenced by the price of commodities, the moneys inflows and the stabilization of the external balance, Africa has had high inflation rates around 8% (Figure 10). These prices increases that are especially problematic in oil and agricultural goods have been pressuring the poor urban population, which can be of great concern as it fuels tensions within and lead to political unrest. In addition the interest rate mechanism in most African countries is still very weak. Thus monetary authorities must be careful when weighting its main goals: low inflation and economic growth.
Macroeconomics of South Africa
South Africa (SA) is currently Africa’s main economy and the most developed nation in the continent and it is one of the emerging economies that grew significantly in the last decade. Despite considerable growth in the past, the economy has slowed down. Moreover the country still has a considerable number of structural problems such has social inequality that has been a continuous source of social and political tension.
Economic growth is expected to be 2.8% in 2013 which means a slowdown in relation to 2012 and a very low growth when compared to pre-crisis figures (Figure 11). Several factors are affecting the economy performance, from where we can highlight: Slowdown of commodity prices; Capital outflow from the country that is triggering a great depreciation of the rand; External and fiscal deficit are not controlled; Population challenges and structural problems in the labour market; Problems with the EU, the main trade partner.
The South African economy has a strong primary sector, with mining and the great conglomerates responsible for that sector a very important part of the country’s GDP, total natural resources rents were above 11% of GDP in 20125. Given the slowdown of commodity prices since 2011, the exports of the country are slowing down in this industry.
5
Natural Resources Rents refers to the revenues deducted from the costs of extraction. IMF data.
-5,0% -2,5% 0,0% 2,5% 5,0% 7,5% 10,0%
2011 2012 2013F 2014F
Figure 10: African Macroeconomic Indicators
Economic Growth Inflation Fiscal Balance External Balance
Source: United Nations: African Economic Outlook 2013
0 2 4 6 8 10 12 14
Figure 12: Rand/US$ Evolution
SHOPRITE HOLDINGS LTD COMPANY REPORT
PAGE 8/39
42 44 46 48 50 52 54 56
0,0% 0,5% 1,0% 1,5% 2,0% 2,5%
2005 2006 2007 2008 2009 2010 2011 2012 2013F 2014F 2015F 2016F
Figure 14: Population Evolution
Population Population Growth Source: FMI
Millions
Moreover the country is suffering from an outflow of capitals, which is a tendency that is affecting other emerging countries like Brazil and India. The huge flow of money from developed nations to emerging ones after the financial crisis of 2008, giving the low interest rates in the US and Europe, are starting to going back for those countries, especially with the possibility of an increase in the FED interest rate. This has severely affected the rand, which depreciated more than 15% in the last 12 months (Figure 12). The currency depreciation has a direct effect in inflation, which is forecast to remain high during the next three years (Figure 13). Additionally the country’s external and fiscal balances are in the red and are expected to remain so for the next years. There are some concerns in the short-term financing of the external deficit giving the outflow of capital that SA is suffering. So one of the country’s goals should be to reduce its external deficit through a boost in exports or a decrease in imports. Nevertheless exports are being affected by the restrictions in the labour market and the volatility of the rand, while imports are being powered by the government investment plans. Budget deficit is another problem. The government of Mr. Zuma has been caring out a policy of continuity in relation to high public investment, especially in the transports sector, both rail and road. The infrastructure investment plans and the cut in the corporate tax rate for 28% are pressuring an already negative fiscal balance.
Population has been slowly increasing in the past few years, reaching 51 Million in 2012 as it can be seen in Figure 14. This slow growth is associated with the increase in the mortality rate because of the high incidence of HIV, which is one of the country’s greatest challenges, more than 12% of South Africans have HIV6.
Urban population has been also constantly increasing, reaching 63% in 2013, which bring significant social and way of life changes in the country.
Other issue of concern is the labour market. The country has been passing through a great period of strikes and labour unrest, particularly in the mining sector. This year and until October, a total of 5.4 Million man-days of strike have already occurred, the same than all the year of 2012. It is estimated that this cuts economic growth by 0.5% of GDP7. These situations together with a deformed
and restricted labour law, where there are radical unions like the National Union of Metal Workers and even quotas regarding a person’s colour, are responsible for a great pressure to increase wages, which affects the already huge
6
According to UNAIDS.
7
According to the National Treasury of South Africa.
0,0% 5,0% 10,0% 15,0% 20,0%
2008 2009 2010 2011 2012 2013F 2014F 2015F 2016F
Figure 13: CPI and CPI Food Evolution
CPI CPI Food
Source: IMF Data and Forecasts, Analyst Estimation
20% 21% 22% 23% 24% 25% 26% 27% 28%
2005 2006 2007 2008 2009 2010 2011 2012 2013F 2014F 2015F 2016F
Figure 15: Unemployment Rate
SHOPRITE HOLDINGS LTD COMPANY REPORT
PAGE 9/39
-4% -2% 0% 2% 4% 6% 8% 10%
57% 58% 59% 60% 61% 62% 63% 64%
in % of GDP
Figure 17: Household Consumption Evolution
Household Consumption Expenditure Growth in Household Consumption
unemployment rate8 (Figure 15). Risks of large scale strikes are still very high and of great concern for us.
Furthermore the government unilaterally ended the Bilateral Investment Treaties with EU countries. South Africa wanted only one agreement with the entire bloc but there has been a lot of confusion between both parties in the matter. Although the possible small effect of this decision in terms of exports and FDI, it is an additional problem with the country’s main trade partner.
Notwithstanding all the negative aspects mentioned above, the country has a decent FDI flow (expected of 1% of GDP in 2013), a low external debt (under 45% for 2013) and a respectable value of foreign reserves, which can cover imports. Regarding the country’s most important stock exchange, the Johannesburg Stock Exchange (JSE), for the investors that hedged against exchange rate risk, it has been the best emerging market performance during the previous 3 years, having a real return of 4.1% in 3 years. For investors that did not hedge against the rand, the JSE has been a terrible disappointment.
The Sector
Sector Description
The South African food retail market has been an industry with huge growth during the last decade. Penetration rates of modern grocery distribution (MGD) exploded; South African retail companies grew and started its internationalization process; competition increased in urban areas and consumer’s pattern changed. Basically the industry followed the prosperity period that the country has been enjoying in the last decade and change in a positive way, starting to become more and more like a developed country retail industry.
The grocery distribution industry grew during the last 10 years about 10% per year, and it represented in 2012 about 360 Billion rands in sales. Modern grocery distribution had a tremendous increase, from approximately 40% to more than 55% of the total food distribution market in 2012 (Figure 16). This growth in the industry is directly influenced by the evolution of the industry main drivers and by the change in consumer behaviour.
The evolution of sales in the retail sector is influenced by the price and quantity of goods sold. Price can increase in nominal or in real terms. So price depends on inflation and real factors. These include: household consumption expenditure and
8
In economic theory, if you do not have flexibility in wages, the labor market will adjust through unemployment.
0% 20% 40% 60% 80%
2002 2012
Figure 16: The Food Retail Market
Modern Distribution Traditional Distribution Source: STATSSA Data
SHOPRITE HOLDINGS LTD COMPANY REPORT
PAGE 10/39
consumer’s patterns. If the costs of producing a good increases, its price must follows the same tendency. If a household is wealthier it can purchase further goods and pay more for their grocery products.
Household consumption expenditure has been constantly increasing (Figure 17), besides 2009, a year influenced by the global recession. From 2010 onwards it has been growing faster than GDP. Moreover, looking for government expenditure we can see that it has been constantly increasing, reaching 22.4% of GDP in 2012 (Figure 18). This can be explained by the increase in government social grants for the poor part of the population. Consequently all households including the low income families are spending more each year. This trend is responsible for the increase in the number of stores and sales of major retailers and the increase in the penetration rates of modern grocery distribution.
In addition consumption patterns are changing. Looking to the Living Standards Measure9 (LSM), there is a clear trend of people moving from the lower LSMs to higher ones (Figure 19). This trend influences the type of consumption of each customer, since a population with higher income, different lifestyle and more concentrated around urban centers (Figure 20) consumes differently. An example is the increase in the sales of pre-prepared food due to home cooking declining, given the inclusion of women in the workforce. Or some individuals that had a wrong and poor diet in the past, which are now eating more protein products. Thus, individuals are migrating from the traditional distribution to the modern one when reaching LSM levels 3 and 4. In here there is an opportunity for hard discount chains like Usave in the case of Shoprite and some Pick n’ Pay brands. On the other hand the higher LSM categories are also increasing, which means that consumers desire higher value brands, giving a great opportunity to companies like Massmart or chains like Checkers.
Regarding the margins of the sector, they can be evaluated through the evolution of the consumer’s price in relation to the producer’s price . This is, retailers gain through the gap between the price that sell the goods and the price at which they purchase them, so this difference can be seen as a proxy for the sector’s margins. Looking to Figure 21 it can be seen that in the previous months, margins are being pressure by the increase in the producers’ price and in the control of the consumers’ price by the retailers. The increase in PPI is reflecting the increase of electricity, labour and fuel in the country. The control in CPIs and the low reflection on the sector margins have been achieve at the cost of Working Capital that I will explain further ahead.
9
LSM is a measure of poverty calculated by SAARF (South African Audience Research Foundation). It divides people by its living standards in 10 groups, taking into account degree of urbanization, ownership of cars among other factors. LSM1 is the poorest group while LSM10 is the richest one.
15% 16% 17% 18% 19% 20% 21% 22% 23%
2005 2006 2007 2008 2009 2010 2011 2012
in % of GDP
Figure 18: General Government Final Consumption Expenditure
Source: World Bank Data
0% 10% 20% 30% 40% 50% 60%
2008 2009 2010 2011 2012
Figure 19: LSM Evolution in % of Total Population
LSM 1-5 LSM 6-7 LSM 8-10 Source: SAARF Data
0% 20% 40% 60% 80% 100% 120%
2005 2006 2007 2008 2009 2010 2011 2012 2013F 2014F 2015F 2016F
Figure 20: Urbanization Evolution
Urban Population Rural Population Source: United Nations Data
4,0% 5,0% 6,0% 7,0% ja n -1 3 fe v-1 3 m a r-1 3 a b r-1 3 m a i-1 3 ju n -1 3 ju l-1 3 a g o -1 3 se t-1 3
Figure 21: Prices Evolution
SHOPRITE HOLDINGS LTD COMPANY REPORT
PAGE 11/39
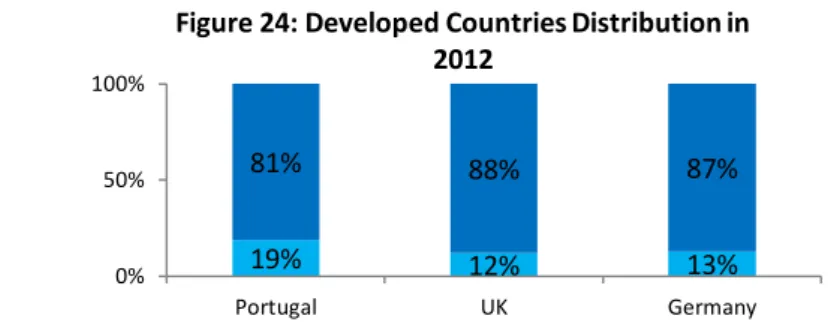
It is our expectation that although there is a short-term pressure in margins especially in the low income target supermarkets which have consumers that are more price sensitive (retailers cannot reflect the increase in PPI in price in this case because sales might decrease), the retail sector still has good growth prospects in the country. The penetration rates are still low if compared to other developed markets (80 to 90% of total distribution) and even lower than other emerging markets like Brazil, where the MGD accounts for 60% of the market or some eastern Europe countries (Figures 23 and 24). With the continuation of the increase of urbanization and a change in the consumer patterns of South Africans it is our expectation that although growth will likely slow down, estimates give us a penetration rate of 66.2% in 2016 (Figure 22). Moreover each company can continue to have an organic growth strategy, unlike many markets where M&A is the only way to further develop a retailer.
Comparables
Currently the food retail sector in the country is controlled by 5 major companies that together control over 93% of the market (Figure 25), which are: Shoprite, Pick n’ Pay, Spar, Massmart and Woolworths. The concentration in the South African market is different from other emerging countries where the market shares of top retailers are still very low. This is evidence that in the case of industry segmentation SA is a very mature market. These retailers are characterized by a high growth profile (sales CAGR of 12.07% in the last 3 years), low CAPEX needs (due to the use of leasing in relation to stores), respectable margins (industry EBITDA margin in the last 3 years was of 5.8%) and low leverage ratios (comparables median of 8.6% debt to equity). Moreover all are expanding its model to other Sub-Saharan countries despite the still huge development that the SA market offers.
The company that is more similar to Shoprite is Pick n’ Pay (Figure 26 presents the firm’s main financials), which is one of the oldest modern retailers and is listed since 1968. It used to be the number one retailer and is has been going
53% 40%
19%
3%
47% 60%
81%
97%
0% 50% 100%
Russia Brazil Romania Poland
Figure 23: Other Emerging Countries Distribution in 2012
Traditional Grocery Distribution Modern Grocery Distribution Source: Planet Retail
19% 12% 13%
81% 88% 87%
0% 50% 100%
Portugal UK Germany
Figure 24: Developed Countries Distribution in 2012
Traditional Grocery Distribution Modern Grocery Distribution
Source: Planet Retail 0%
20% 40% 60% 80% 100% 120%
2012 2013F 2014F 2015F 2016F
Figure 22: Distribution Forecast Evolution
Modern Grocery Distribution Traditional Grocery Distribution
Source: Analyst Estimation
32,5%
27,8% 21,7%
7,6%
4,0% 6,4%
Figure 25: Market Share of the Food Retail Industry in
2012
Shoprite Pick n Pay Spar Massmart Woolworths Others
SHOPRITE HOLDINGS LTD COMPANY REPORT
PAGE 12/39
through a great process of restructuring. Nowadays it has the second highest market share and operates through the Pick n´ Pay and the Boxers brands. The company shifted its business profile in 2012, selling its poor operations in Australia and focusing on the internal market and in neighbouring countries. Moreover the company changed its management recently in order to become more efficient. These changes are not yet reflected in company’s financials, nevertheless we believe that EBITDA margin and sales growth should recover in the medium run. Pick n’ Pay is exposed to all type of customers, from the lowest LSM to the highest one. Nevertheless the firm is still very concentrated in low middle income consumers (LSM 3 to 6), which can be problematic in the short term.
Spar (Figure 27 summarizes the company’s core data) is the third largest company of the industry and has a different business model being a typical wholesaler, being responsible for the purchase of groceries and to sell them for independent supermarkets than operates with its name and brand. Nevertheless this business model has major risks since independent supermarkets that constitute the bulk of the company’s clients are not obliged to buy from the firm. For that reason the company has low CAPEX needs and a high cash flow generation, nevertheless Spar does not control its growth.
The fourth player in the industry is Massmart (Figure 28 presents its key statistics). The company had a strong investment plan during the last 4 years that was accelerated with the entrance of its now major shareholder, Walmart10. The plan consisted on diversifying its retail offer, enhance the supply chain and expand to other African countries. Currently, the company operates in all LSM segments through its different 10 brands (Game, Dion Wired, Makro, Builders Warehouse, Builders Express, Builders Trade Depot, CBW, Jumbo Cash & Carry, Cambridge Food and the Shield buying group).
Finally, the last large retail company is Woolworths (Figure 29 summarizes the firm’s financials). The firm operates through two different retail chains that are food and clothing11. Food accounts for more than 50% of total sales. This firm is the one with the highest ROIC and ROE of the industry because its business model is very different than the previous retailers since it targets only high income consumers that are in the higher LSM categories (8 to 10). The company is geographically present in SA and in Australia.
10
In 2011 Walmart acquired 51% of the company.
11
In the clothing business it has an agreement with the British Marks & Spencer.
SHOPRITE HOLDINGS LTD COMPANY REPORT
PAGE 13/39
Business Units: Description and
Forecasts
Supermarkets in South Africa
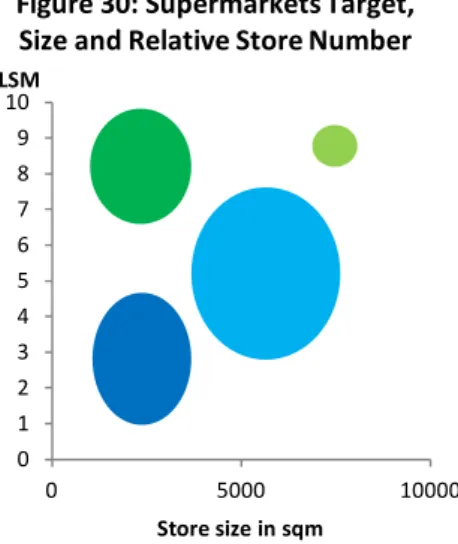
This business unit of the group comprises all the supermarkets stores in the country. For the year ended in June 2013 Shoprite had approximately 71Billion rands in Sales from its 810 supermarkets in the country. EBITDA Margin was of 8.1% (Figure 31). This represents approximately 76.5% of the group’s Total Sales and 83.1% of its EBITDA in 2013. As it was previously mentioned, Shoprite has three types of Supermarkets that are Shoprite, Checkers and Usave. There is also one sort of hypermarket that is Checkers Hyper (the three Shoprite Hyper were shutdown in 2011). As it was beforehand stated each supermarkets aims to target different food retail customers (look to Figure 30). It is important to mention that it is company’s policy not to own its stores, but leasing it in order to reduce the PP&E investment demand to open new ones and the CAPEX demands during its life. Moreover leasing has the advantage to provide a greater flexibility and make it easier to open and close stores.
Usave is a hard discount supermarket that is focused on low income people. In 2008 there were only 91 Usave’s stores in the country, nevertheless by 2013 there were 243 stores, this represents a cumulative growth of 167% in just 5 years. This store is usually smaller and concentrated in poor urban areas and smaller cities. It is estimated that each Usave Store as 600 sqm and given the location of the store, the CAPEX needs of this supermarket are expected to be very low. Being concentrated on low income customers, Usave is the perfect vehicle of growth in South Africa, given the country’s population income profile.
Shoprite is the group main brand and supermarket chain. It was the group’s first brand and serves and targets the middle income class. Despite not being a hard discount supermarket like Usave, Shoprite attempts to serve its clients with the lowest prices as possible, since middle class customers are still very price sensitive. There are currently 361 stores in South Africa. The increase in the number of stores has been stable and between 10 to 20 shops per year (roughly 2 to 6% YoY). These stores are typically larger than Usave’s having an average of 4000 sqm. They are usually located in shopping malls and great metropolitan areas of country, especially in Cape Town, which increase the price of sqm of each store. CAPEX demands are usually higher in a Shoprite store than in a Usave one.
0 1 2 3 4 5 6 7 8 9 10
0 5000 10000
Store size in sqm Figure 30: Supermarkets Target, Size and Relative Store Number
Usave Shoprite Checkers Chekers Hyper
LSM
Source: Analyst Estimation
Usave is a supermarket focused on low income consumers
SHOPRITE HOLDINGS LTD COMPANY REPORT
PAGE 14/39
Checkers is the group brand for upper middle class and upper class customers. It is a supermarket focused on prime quality products, from meat to cheese and wines, having a greater attention to the quality of the products and its brand. At present there are 168 stores in SA, opening an average of 10 supermarkets each year. Checkers are usually smaller stores than Shoprite, being estimated to have around 1500 sqm each, nevertheless they are located in shopping centers and prime zones of SA’s urban areas, being subject at a higher price per sqm than both Usave or Shoprite stores. CAPEX demands are higher in these shops, but so are the margins of this market segment.
Besides the three supermarket chains there is still one hypermarket chain that is Checkers Hyper. At the time, there are 29 Checkers Hyper within the country, having opened on average one hyper per year in the last five years. These stores have around 5500 sqm per store and are located in road intersections in the main South Africa Urban zones. They have the same concept as Checkers, but with a wider and higher variety of products. They are the stores that have the great CAPEX expenditures and that need the biggest investment of all according to our estimates.
Total Stores reach 801 in 2013, coming from a base of 536 stores in 2008 (Figure 32). This represents a growth of 53 per year or an average growth of 8.3% YoY (Figure 33). The development and expansion of Usave was the main responsible for such increase and penetration in the country’s food retail market. Total sqm of the supermarkets increased from 1573100 sqm to 2001300 sqm. This represents an average YoY growth of 4.9% since 2008. One may see that the sqm grown less than the number of stores, which is associated with the fact that the small Usave shops where the main driver of growth in SA. Average space per store decreased from 2935 sqm to 2499 sqm. It is estimated an opening of 100 new stores in 2014, especially from the Shoprite and Usave brands. It is our belief that from 2014 onwards the firm will continue to invest in the South African market, with a notable emphasis in the Usave brand, which has a great possibility of growing in peripheral urban areas which are increasing in the country. There is also still growth possibility for the Shoprite and Checkers brand, mainly because of the tendency of improvement of the living standards of South Africans (seen through the LSM categories) and the change in consumer behaviour in developed urban areas.
Sales and its drivers are the most important variables in a Food Retail Business, like Shoprite Holdings. Posing as a growth company during last years, the division between the Sales performed in mature supermarkets and the new ones must be performed. So Total Sales depend of the Sales per sqm of the existent stores and the total sqm space of those stores, and the Sales per sqm of the new
Source: Company Data, Analyst Estimation
Source: Company Data, Analyst Estimation
-20,0% -10,0% 0,0% 10,0% 20,0% 30,0% 40,0% 50,0%
Figure 33: Stores Growth Supermarkets SA
Usave Shoprite Checkers Checkers Hyper Source: Company Data, Analyst Estimation
SHOPRITE HOLDINGS LTD COMPANY REPORT
PAGE 15/39
shops and its total space. In order to perform this division, we had to assume that the ramp-up of a new supermarket is of 1 year12. We have also assumed an average percentage of Sales for the new stores during its first year of 33% of the existing ones, which is a value based on market know-how.
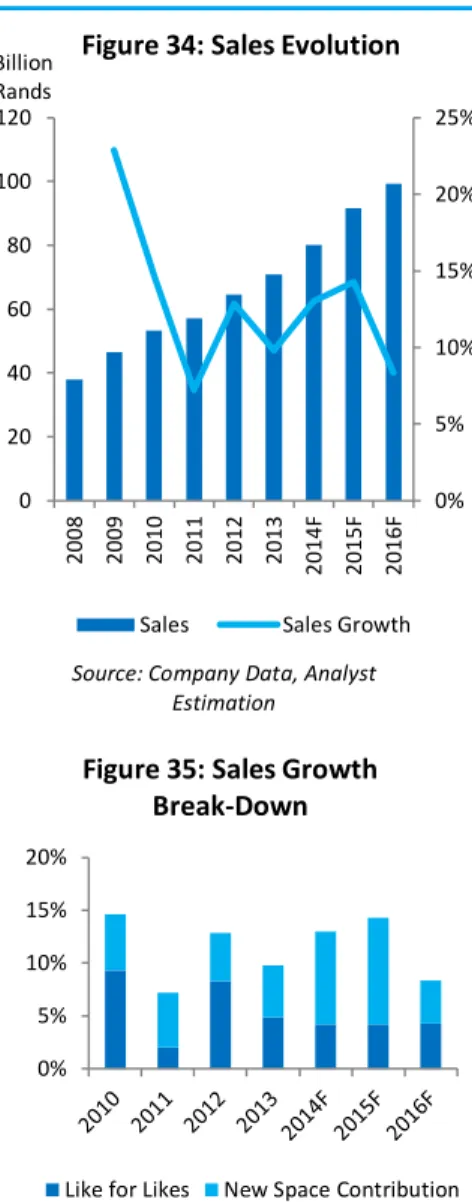
As one can see Sales have been increasing at an average of 13.5% per year since 2008, which is a very attractive rate (Figure 34). If we break-down the sales growth profile between Like for Likes13 and New Space contribution, it can be
seen that Like for Likes is the main contributor for the evolution of Total Sales (Figure 35), despite the opening of several supermarkets per year. Like for Likes may be influenced by the growth in quantity of a supermarket or the growth of the price per item of that store. Taking into account that we are talking about mature stores and that quantity has a restriction that is space, we may look to LfL to a proxy of the internal inflation of a supermarket. In Figure 36 we can look for the evolution of South Africa CPI Food and a two years CPI Food Average. It is very evident the relationship and the same tendency that LfL has with these variables which is a proof of what I previously alleged. Consequently we can conclude that not only the opening of new stores have been contributing to the company’s sales growth in South Africa, but also its ability to increase the Sales in the existing supermarkets. It is important to notice that in 2013 LfL (4.8%) was smaller than Food CPI (6.1%), which means that Shoprite is not passing to consumers all the increase in prices, maintaining its policy of affordable and competitive prices in comparison with other industry players. Sales per sqm in the existing stores and in the new ones have been also increasing. Total sales per sqm are now of 35.4 thousand rands, and total sales per store of 88.5 Million rands per year.
Comparing Shoprite’s sales evolution against its main comparables it can be seen that the company is not having a bad performance (Figure 37). Shoprite has been growing during the last 3 years at a faster rate than Pick n Pay and Spar, which are the most similar ones in terms of market share with the company. Massmart and Woolworths have been presenting an astonishing growth but they still have a low sales base.
Our sales prospects are much in line with the store ones. Given the lower investment from 2014 onwards the main contribution for the increase in sales in the long-run is LfL and not the opening of new stores. We estimate that LfL will trend and follow the path of the country’s Food CPI. Sales per sqm will constantly
12
Means that a supermarket takes 12 months in order to be considered mature and for its sales growth and path to be normalized.
13
Like for Likes is a terminology used in the Retail Sector to denominate the growth of Sales that does not take into account the opening of new stores, so it is the growth of an already mature and existing supermarket.
0% 5% 10% 15% 20%
Figure 35: Sales Growth Break-Down
Like for Likes New Space Contribution Source: Analyst Estimation
0% 5% 10% 15% 20% 25%
0 20 40 60 80 100 120
2008 2009 2010 2011 2012 2013 2014F 2015F 2016F
Billion Rands
Figure 34: Sales Evolution
Sales Sales Growth Source: Company Data, Analyst
Estimation
0,0% 2,0% 4,0% 6,0% 8,0% 10,0% 12,0%
Figure 36: Relation between CPI and LFL
CPI Food CPI Food Average LFL
SHOPRITE HOLDINGS LTD COMPANY REPORT
PAGE 16/39
continue to increase with the effect of internal inflation and the investment in smaller supermarkets like Usave.
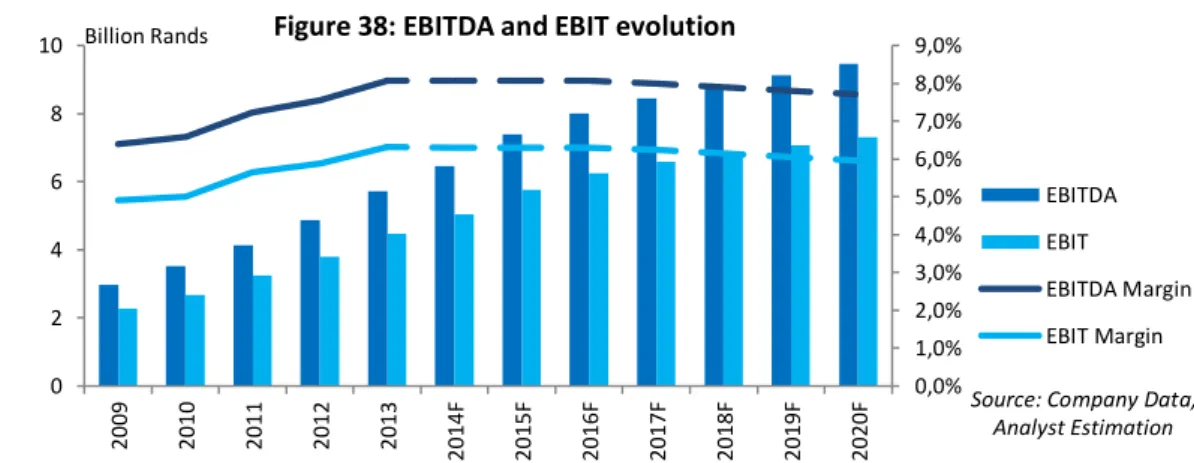
Regarding margins, SA supermarkets have been presenting a stable slightly increase in its business margins as one can see in Figure 38.
EBITDA margin has been increasing, reaching 8.1% of Sales in 2013. This fact was due to the small decrease in the Cost of Goods Sold, the increase of Other Operating Income within the group and the ability of the group to hold Salaries when it is even hiring more staff. The increased of EBIT Margin takes not only all these effects into account but also the constant decrease in depreciation from 13.9% of Sales in 2008 to 11.6% in 2013 and the smaller losses in Items of Capital Nature. The firm’s EBITDA Margin is in very good shape comparing with its main peers as one can see in Figures 39A and 39B. Pick n’ Pay, which is the most comparable one, only had an EBITDA Margin of 3% in 2013. The only one with higher margin is Woolworths given its specialization in the premium and high worth clients segment. Furthermore it is important to mention that these players also use leasing contracts which makes the EBITDA a measure comparable between them. It is our belief that Shoprite’s higher margins are related with a very efficient management of costs and the strong brand value of its supermarkets.
Margins are too high to be maintained in the long run given the huge pressure in wages and some external costs like electricity in SA. Nevertheless the company’s management could increase the business margins in the last 5 years, so we believe that it would hold them in the next 3 years. Our estimations indicate a slow decrease in margins starting in 2017 and continuing in the following years. PP&E and Intangible Assets, according to our estimates, represent about 14.8% of Sales in 2013 when they only represented 10.3% in 2008. One may think that this value is really low for a company that should have stores, warehouses, great distribution channels in terms of PP&E and a great value in trademarks, costumer relationship and software in terms of Intangible Assets, nevertheless it should be
0% 5% 10% 15% 20% 25% 30%
2011 2012 2013
Figure 37: Comparables Sales Growth
Shoprite Pick n Pay Spar Massmart Woolworths
Source: Companies Data 0,0%
1,0% 2,0% 3,0% 4,0% 5,0% 6,0% 7,0% 8,0% 9,0% 0 2 4 6 8 10
2009 2010 2011 2012 2013 2014F 2015F 2016F 2017F 2018F 2019F 2020F
Billion Rands Figure 38: EBITDA and EBIT evolution
EBITDA EBIT
EBITDA Margin EBIT Margin
Source: Company Data, Analyst Estimation 2% 4% 6% 8% 10% 12%
2011 2012 2013
Figure 39A: Comparables EBITDA Margin
Shoprite Pick n Pay Spar Massmart Woolworths
Source: Companies Data
0% 2% 4% 6% 8% 10% 12% 14%
Figure 39B: Comparables Margin in 2013
SHOPRITE HOLDINGS LTD COMPANY REPORT
PAGE 17/39
0,0 0,5 1,0 1,5 2,0 2,5 3,0 3,5
Figure 40: Capex Break - Down
Investment in New Stores, Equipments and Others
Depreciation Billion rands
-20 -15 -10 -5 0 5 10 15
20 Billion Rands
Figure 41: Working Capital break-down
Cash and Cash Equivalents Provisions
Trade & Other Payables Inventories
Trade & Other Receivables Working Capital
Source: Company Data, Analyst Estimation
0% 5% 10% 15% 20%
2008 2009 2010 2011 2012 2013
Figure 42: Working Capital Items in percentage of Sales
Trade & Other Receivables Inventories
Trade & Other Payables Provisions
Cash and Cash Equivalents Source: Company Data, Analyst Estimation
taken into account that the group’s supermarkets in South Africa are based on lease contracts, not entering in the PP&E account, being out of the Balance Sheet. The use of these contracts give the company greater flexibility and it spreads the payment of the investment over a larger time frame. Thus the evolution of PP&E during the last years is not only related with the increase in the number of supermarkets, but likewise to the investment in distribution channels that the company is performing. During 2013 the distribution space in South Africa increased 21% mainly in Centurion, Durban, Port Elizabeth and Brackenfell. The investment in the company master-data and merchandizing is also significant. In relation to CAPEX, it has been growing at an average of 20% YoY. As one can see in Figure 40, approximately 58% is related with new investments and 42% is depreciation of already existing investments in 2013. This is another indicator of the firm strategy and growth profile. In the future, given the lower investment in new stores and the one already performed in new distribution channels, CAPEX growth will be more constant. Its break-down will also be different, being depreciation the majority of capital expenditures in 2016 and the following years.
Considering Working Capital, a very important measure in a retailer, we can see that Shoprite has managed to maintain it mostly negative from 2008 to 2012. Nevertheless there is a shift in 2013, where NWC turns positive. Intuitively it is better for a company to have a negative working Capital, since it means that you can manage your day to day operations with others people money, this was what happened with Shoprite until 2013. As one can see in Figures 41 and 42 the main responsible for the change in the working capital was the relative reduction of Trade Payables, which is the amount in debt by the company to its suppliers. This situation is a clear response to the price pressure that occurred regarding producers, making retailers paying quicker in order to control the prices at a reasonable level. This is also happening with the firm’s main comparables: Pick n’ Pay and Spar. Working Capital will remain positive in the future and it is going to increase in absolute terms, given the increase in operations. We consider that this situation will continue to occur in the next decade if Shoprite does not alter its supplier base. Including more foreign suppliers would give the company the possibility of gaining bargain power with the national ones. Nevertheless this is a very difficult modification in the retail business and would take significant time and effort. So we estimate that Working Capital will continue to be positive in the years to come.
As it can be seen in Figure 43 the Cash Flow has been changing almost each year, reflecting that the business in South Africa is not yet stabilized. Most of the changes in the Cash Flow during the last years are related with the instability of
SHOPRITE HOLDINGS LTD COMPANY REPORT
PAGE 18/39
Source: Company Data and Analyst Estimation
Working Capital. In 2013 the Cash Flow was negative since it is reflecting the pressure of high investment through the CAPEX and a great change from negative to positive in Working Capital in comparison with 2012. In the future the Cash Flow will be positive and with a constant growth, influenced by the stabilization of CAPEX and Working Capital and the continuing growth of Operations.
Supermarkets outside South Africa
Even though the main operations of Shoprite are in South Africa, the company is present in many Sub-Saharan countries, especially West Coast countries, where it tries to replicate the model and the success the firm has in the national front. In Figure 44 one can see the presence of the company in terms of Supermarkets outside South Africa em 2013. Namibia, Zambia, Angola and Nigeria are the principal markets, the first three because of the already established presence and Nigeria because of the incredible reception and growth the group is having. Supermarket operations outside South Africa have been considered the golden star of Shoprite giving the growth profile of the business and its potential, derived by the competitive advantages that an African well-known company has and specially the first mover advantage that the company has in these new markets. The supermarket models in these countries are the same as in South Africa, only Checkers Hyper is not replicable outside the country giving it’s developed and target market characteristics. This Business Unit is responsible for 12.6% of the group’s Total Sales and 11.9% of EBITDA in 2013. Looking to the numbers, Shoprite and Usave are the main drivers of expansion, having in 2013, 92 and 56 stores respectively. Figure 45 give us the main statistics of these Operations. Total Stores have been growing at an average of 9% YoY since 2008. The growth in Usave shops is relatively important. Being all these countries in a development position below South Africa but having achieved a great growth during the last decade, the profile of stores opening is accordingly to the group strategy. Shoprite decided to especially expand Usave that targets low income consumers, and Shoprite stores that targets middle income customers. Checkers expansion was smaller, opening just one store during this period. In that way the group aims to reach not only the people that are starting to use Modern Grocery, as it is pointing to the new middle classes that are emerging in those countries. For that, Shoprite is increasing the perception of the brand and consumers loyalty using platforms like social media and press. Assuming the same sizes in the type
-1 -1 0 1 1 2 2 3 3 4
Figure 43: Operational Cash Flow SA Supermarkets
Billion Rands
Source: Company Data, Analyst Estimation
Figure 44: Company’s Operations Abroad
SHOPRITE HOLDINGS LTD COMPANY REPORT
PAGE 19/39
Source: Company Data and Analyst Estimation
-10% 0% 10% 20% 30%
Figure 49: Growth of Sales Break-down
Like for Likes Space Contribution Figure 47-49 Source: Company Data, Analyst
Estimation
of stores than in South Africa, total space increased approximately 34% in the last 5 years.
We estimate that the low penetration rates of MGD, the first mover advantage of the firm, the great adaptation of its model to these markets and the reception of the population to the brand would allow the company to increase the number of stores in the coming years (Figure 46). Usave and Shoprite will continue its strategy, while Checkers can focus on the fastest growing countries like Nigeria14. We believe that 320 stores will be operating by 2020.
One may think that Sales had a mixed pattern in the last years as it can be seen in Figure 47. Nevertheless this is a misleading idea. During 2010 there was a slight decrease in sales in rands but not in local currency, where the turnover achieved 18%. The great valuation of the rand during both 2010 and 2011 may lead to wrong conclusions when looking at these numbers. In fact the supermarkets operation outside South Africa has been always growing. The lack of information regarding each country does not allow a very detail analysis, but we know that Shoprite uses not only local suppliers in these countries but also South African producers, therefore the price of imports giving a higher rand also affected prices. Notwithstanding and doing an analysis in rands, it can be seen that overall sales increase more than 124% in the last 5 years and 18.6% YoY average, which is an impressive growth (Figure 48). The profile of this growth can be seen in Figure 49. Space contribution is increasing every year and has a great contribution to the growth than in the case of Supermarkets in South Africa. LfL has been extremely positive during the last two years, being the double of the CPI of all Sub-Saharan Africa15 (Figure 50). This means that the company is
managing to increase prices in real terms and not only nominally, besides the influence that the rand path had. Sales per sqm reached 30.4 thousand rands in 2013 which is about 86% of the value in SA, nevertheless it has been increasing constantly even in relation to the same measure in SA. It is important to mention that the break-down of the Sales was performed in the same way as in the South African case.
Sales will continue to exhibit two figures growth in the near future according to our estimations. LfL and space contribution will both increase and will almost have the same contribution for overall growth. We estimate that LfL will trend to the Food CPI of the region in the long-run, while space contribution will take
14
Shoprite has been adopting social media marketing especially through Facebook in Nigeria, which increased its brand awareness in the country.
15
Sub-Saharan CPI takes into account the CPI of all countries of Sub-Saharan Africa. This value is from the African Outlook for 2013 of ONU.
-10% 0% 10% 20% 30% 40% 50%
0 5 10 15 20 25
2008 2009 2010 2011 2012 2013 2014F 2015F 2016F
Billion Rands
Figure 47: Sales evolution in Supermarkets Non-SA's Sales
Total Sales Sales Growth
-20% 0% 20% 40%
2010 2011 2012 2013
Figure 48: Sales Growth in Different Currencies
SHOPRITE HOLDINGS LTD COMPANY REPORT
PAGE 20/39
advantage of the opening of new stores. According to our estimations Sales will reach 32 Billion rands in 2020 with a CARG of 17.8%.
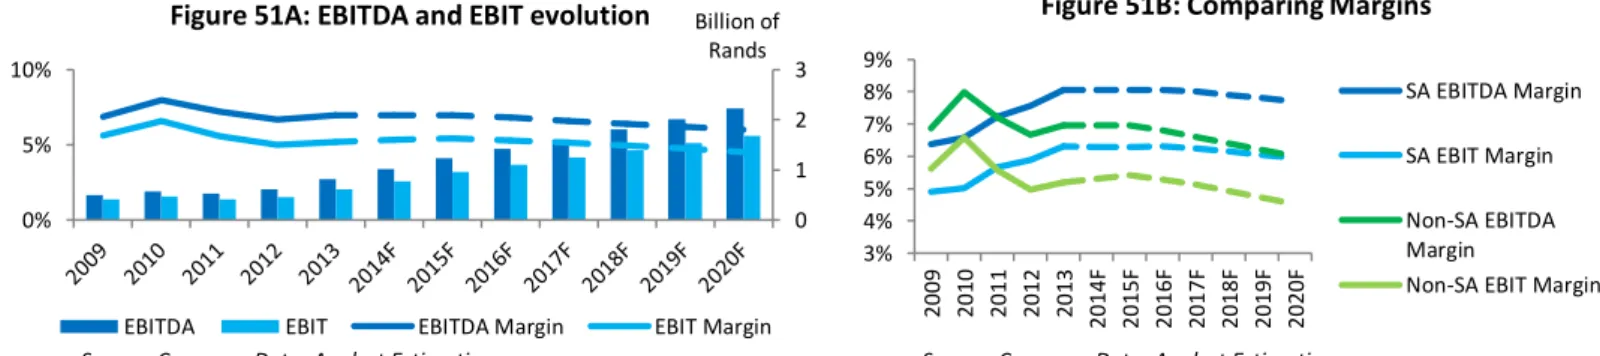
Regarding Margins, they have marginally increased in 2013, presenting a stable path during the last 3 years (Figure 51A). EBITDA Margin was of 7% in 2013 and EBIT Margin of 5.2%. Looking for the comparison between the margins in international operations with the South Africa ones, it may be seen that SA margins are presently better than the previous ones (Figure 51B). There are several factors that explain this difference. For starting the Costs and General expenses outside SA are greater than in SA in relation to sales, given that as we mention most suppliers in the external front are South African. Moreover in relation to EBIT there are losses regarding exchange rates that affect margins calculated in rands. We estimate that margins will slowly decrease in 2016 and the coming years. As in the case of SA, there is a lot of pressure regarding labour costs and electricity. Even thinking that with local suppliers COGS may decrease, we must take into consideration the increase in competition that will occur in the long-run and the superior maturity of these markets.
PP&E and Intangible Assets, according to our estimates, represent about 15% of Sales in 2013 when they only represented 8.6% in 2008. As in the South African case most of the International Stores are leased, nevertheless the group in Angola and Nigeria owned its stores, which is a factor of why PP&E and Intangibles has been increasing and is relatively bigger than in SA. CAPEX has been growing at an average rate of 53% YoY (look to Figure 52). The Investment part of CAPEX accounts for 70% of total CAPEX in 2013. This is a higher value than in the case of SA, indicating the strategy of the group to invest abroad. We estimate CAPEX to increase around 15% a year in the future except in 2014, when it will decrease because of the reduction in new openings of Usave supermarkets. Unlike SA, the break-down of the CAPEX will be almost equal between new investments and depreciation given the estimated opening of new stores in these geographies.
The Working Capital of the international supermarkets has trailed the same path than the ones at home, evolving from a negative situation to a positive one
-5% 0% 5% 10% 15% 20%
2011 2012 2013 2014F 2015F 2016F
Figure 50: Relation between SSA CPI and LFL
CPI LFL Source: Analyst Estimation
0 1 2 3
0% 5% 10%
Billion of Rands
Figure 51A: EBITDA and EBIT evolution
EBITDA EBIT EBITDA Margin EBIT Margin Source: Company Data, Analyst Estimation
3% 4% 5% 6% 7% 8% 9%
2009 2010 2011 2012 2013 2014F 2015F 2016F 2017F 2018F 2019F 2020F
Figure 51B: Comparing Margins
SA EBITDA Margin
SA EBIT Margin
Non-SA EBITDA Margin
Non-SA EBIT Margin
Source: Company Data, Analyst Estimation
0,0 0,1 0,2 0,3 0,4 0,5 0,6 0,7 0,8
Billion rands
Figure 52: Capex break-down
Investments in New Stores, Equipment and Other
Depreciation
SHOPRITE HOLDINGS LTD COMPANY REPORT
PAGE 21/39
(Figure 53). Working Capital in 2013 was of approximately 320 thousand rands. This was one more time caused by the decrease of Trade Payables in relation to Sales, which was a strategy used by the firm to control the pressure in producers prices. We must take into account that most of the goods sold in foreign supermarkets are supplied by domestic producers, so the same effect that affected the national supermarkets, affected foreign operations. We estimate that Working Capital will continue to be positive in the following years and even higher in absolute value given the huge increases of the operations abroad. There could be some attempt of start using more local suppliers than national ones, nevertheless suppliers are still very unprofessional and with a low scale in those countries, making it difficult for a retail company to heavily depend on them. Lastly the Operational Cash Flow of the business unit has been very instable during the last years and was in the red in 2013 as it can be seen in Figure 54. This value represents a switch from positive to negative in relation to 2012, and as in the case of the national supermarkets reflects the switch from negative to positive in Working Capital and the acceleration of investment seen during the year through a higher Capital Expenditure. Nevertheless, we estimate a positive Cash Flow from 2014 onwards, given the stabilization of CAPEX and the lower change in Working Capital.
Furniture
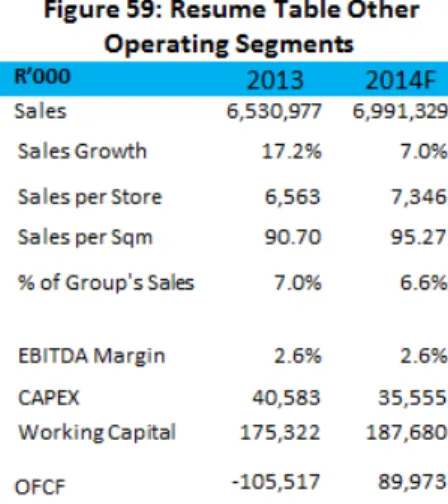
In addition to the Supermarkets Business in South Africa and in other SSA countries, the firm has a Furniture section that includes three brands: OK Furniture, OK Power Express and House&Home. This area of the company was responsible for 3.8% of the Sales and 2.6% of the EBITDA of the group. Besides the opening of new stores and the growth of sales, this part of the group has been losing relative importance for Shoprite. Figure 55 presents the unit most important statistics.
OK Furniture is focused on selling cheap quality Furniture and electrical applicants and currently has 268 stores; of these 233 are in South Africa and 35 in other SSA Countries. OK Power Express is specialized in home entertainment and carpeting goods, being present in very dense urban areas, currently it has 19 stores, of which 18 are in South Africa and 1 in Lesotho. And finally, House&Home is a store focused on quality and sells a large number of furniture and home entertainment products; it has 49 stores open, including 3 abroad. Therefore the Furniture business has 336 stores in 2013. From 2008 until today, 100 new stores opened, presenting a YoY growth of 7.3% on average. We
-4.000 -2.000 0 2.000 4.000
Million of Rands
Figure 53: Working Capital Break-down
Cash and Cash Equivalents Operational
Provisions
Trade & Other Payables
Inventories
Trade & Other Receivables
Working Capital
Source: Company Data, Analyst Estimation
-400 -200 0 200 400 600
2009 2010 2011 2012 2013 2014F 2015F 2016F
M
il
li
o
n
o
f
Ra
n
d
s
Figure 54: Operational Cash Flow Non-SA Supermarkets
Source: Company Data, Analyst Estimation
SHOPRITE HOLDINGS LTD COMPANY REPORT
PAGE 22/39
estimate each one to have an average of 247sqm. Space has increase in the same proportion than the number of stores through the last 5 years. It is expected an opening of 25 new stores in 2014 and we estimate that from than onwards an additional 10 net new stores per year given the opening profile of the previous years.
Sales have been growing at an average YoY rate of 9.7%, reaching 3.56 Billion rands in 2013 (Figure 56). Nevertheless great part of this growth came from the opening of new stores than of Like for Likes. LfL is presenting very low values that are cause by the continuing pressure of household expenditure in durable goods in South Africa, influencing the sales of home entertainment and furniture. This underperformance affected the Sales per sqm, which decrease last year and only had an average YoY growth of 2.1% during the last 4 years. Given this situation that affects LfL together with the decrease in new stores, we believe that the future evolution of the business sales is going to be through a lot of pressure. In relation to the business Margins, as we can see in the Figure 57, both the EBITDA and EBIT has been decreasing, being of 5% and 3.6% respectively in 2013. Pressure from cogs and general costs like electricity and labour costs were the main responsible for the shrink of Margins. This pressure is going to continue in the near future according to our estimations. We believe that EBITDA Margin is going to stabilized at 5%. EBIT is particularly worrying since depreciation is growing at a faster rate than EBITDA.
In relation to PP&E and Intangibles they have been following the same tendency than sales, representing 11.9% of sales in 2013. Despite the management argument that it is performing an aggressive investment in the segment, the reality is that the percentage of new investments has been decreasing, representing only 38% of Total CAPEX in 2013 and even declining in absolute terms from 2012 to 2013. Estimations give us the same proportion of CAPEX coming from investments and from depreciation (Figure 58). Working Capital in the Furniture sector, according to our estimates, has been following the same path than the rest of the group, with a shift to positive in 2013 caused by a faster payment to suppliers. As in the rest of the group we believe that this value will continue to be positive in the future.
Therefore the Operational Cash Flow of this segment, pressure by the decline in margins and the change in the working capital profile, was negative in 2013. For the future we estimate a stabilization of a positive Operational Cash Flow.
-10% -5% 0% 5% 10% 15%
20% Figure 56: Evolution of Sales
Sales Growth Like For Likes
New Space Contribution Source: Company Data, Analyst Estimation
0% 2% 4% 6% 8% 10%
Figure 57: Margins evolution Furniture sector
EBITDA Margin EBIT Margin Source: Company Data, Analyst Estimation
0 20 40 60 80 100 120 140
M
il
li
o
n
o
f
Ra
n
d
s
Figure 58: CAPEX Break-Down