www.elsevier.pt/acup
ACTA Urológica Portuguesa
ORIGINAL ARTICLE
The utility of apparent diffusion coefficient values in
the risk stratification of prostate cancer using a 1.5 T
magnetic resonance imaging without endorectal coil
João Lopes Dias
a,∗, João Magalhães Pina
b, Nuno Vasco Costa
a, Sandra Carmo
a,
Cecília Leal
a, Tiago Bilhim
a, Rui Mateus Marques
a, Luís Campos Pinheiro
baDepartment of Radiology, Hospital de São José, Centro Hospitalar de Lisboa Central, Lisboa, Portugal bDepartment of Urology, Hospital de São José, Centro Hospitalar de Lisboa Central, Lisboa, Portugal
Received 6 November 2015; accepted 23 June 2016 Available online 2 August 2016
KEYWORDS Multiparametric magnetic resonance imaging; Prostate cancer; Apparent diffusion coefficient; Gleason score; Risk stratification Abstract
Purpose: To evaluate the relationship between mean apparent diffusion coefficient (ADC) and post-surgical Gleason scores. To determine the diagnostic accuracy of multiparametric magnetic resonance imaging (mp-MRI) on a 1.5 T magnet in distinguishing low, intermediate and high-grade prostate tumors.
Material and methods: This is a retrospective institutional-review-board-approved, single-center study including 30 patients (median age, 60 years) who underwent mp-MRI before prostatectomy for prostate cancer. Using histological reports for guidance, the tumors were localized in ADC maps, and mean ADCs were measured and examined for correlation with Gleason scores. 2 patients had 2 measurable foci, so a total of 32 tumors were studied. The diag-nostic accuracy of the mean ADC was assessed by using the area under the receiver operating characteristic curve (ROC).
Results:In the differentiation of tumors with a Gleason score of 6 from those with a Gleason score of at least 7, mean ADC yielded an AUC of 0.76 (95% confidence interval: 0.59, 0.93). In the differentiation of tumors with Gleason scores of 6 or 7 from those with a Gleason score of at least 8, mean ADC yielded an AUC of 0.94 (95% confidence interval: 0.86, 1.00).
Conclusion: Mean ADC values may allow a correct assessment of the patient risk using a 1.5 T magnet without ERC.
© 2016 Associac¸˜ao Portuguesa de Urologia. Published by Elsevier Espa˜na, S.L.U. This is an open access article under the CC BY-NC-ND license (http://creativecommons.org/licenses/by-nc-nd/ 4.0/).
∗Corresponding author.
E-mail address:[email protected](J.L. Dias). http://dx.doi.org/10.1016/j.acup.2016.06.002
2341-4022/© 2016 Associac¸˜ao Portuguesa de Urologia. Published by Elsevier Espa˜na, S.L.U. This is an open access article under the CC BY-NC-ND license (http://creativecommons.org/licenses/by-nc-nd/4.0/).
PALAVRAS-CHAVE Ressonância magnética multiparamétrica; Cancro da próstata; Coeficiente aparente de difusão; Score de Gleason; Estratificac¸ão de risco
A utilidade da quantificac¸ão do coeficiente aparente de difusão na estratificac¸ão de risco do cancro da próstata por ressonância magnética em 1,5 T sem sonda endorretal Resumo
Objetivo:Avaliar a relac¸ão entre os valores de coeficiente aparente de difusão (ADC) e os scores de Gleason (SG) pós-cirúrgicos e determinar a acuidade diagnóstica da ressonância magnética multiparamétrica (RM-Mp) 1.5 T sem sonda endorretal na distinc¸ão de carcinomas da próstata de baixo, intermédio e alto grau.
Material e métodos:Estudo retrospetivo, científica e eticamente aprovado, incluindo 30 doentes (idade média: 60 anos) submetidos a RM-Mp pré-prostatectomia. Utilizando os relatórios histológicos como guia, os tumores foram localizados nos mapas de ADC, com vista a quantificar os coeficientes. Dois doentes apresentaram 2 focos mensuráveis, pelo que foram estudados 32 tumores. A relac¸ão entre os valores de ADC e o SG foi analisada através do coefi-ciente de correlac¸ão de Spearman. Para avaliar a acuidade diagnóstica dos valores ADC, foram obtidas receiver operating characteristic curves (curvas ROC).
Resultados: Os valores de ADC mostraram uma correlac¸ão negativa significativa com o SG. Na diferenciac¸ão de tumores com SG de 6 e SG ≥ 7, obteve-se AUC de 0,76 (intervalo de confianc¸a 95%: 0,59; 0,93). Na diferenciac¸ão de tumores com SG de 6 ou 7 e SG ≥ 8, obteve-se AUC de 0,94 (intervalo de confianc¸a 95%: 0,86; 1,00).
Conclusão:A medic¸ão dos valores de ADC num aparelho de 1,5 T sem sonda endorretal é útil na estratificac¸ão de risco do cancro da próstata.
© 2016 Associac¸˜ao Portuguesa de Urologia. Publicado por Elsevier Espa˜na, S.L.U. Este ´e um artigo Open Access sob uma licenc¸a CC BY-NC-ND ( http://creativecommons.org/licenses/by-nc-nd/4.0/).
Introduction
The use of multiparametric magnetic resonance imaging (mp-MRI) has significantly changed the diagnostic approach and management of prostate cancer. It combines the con-ventional sequences, T1 and T2 weighted imaging (WI), with at least two functional studies which may include diffusion weighted imaging (DWI), dynamic contrast-enhanced (DCE) and spectroscopy.1,2
Detection, staging, tumor aggressiveness assessment, and recurrence suspicion constitute its main indications. The adding of functional studies improved the accuracy of MRI and allowed the analysis of new parameters like tumor aggressiveness that inspires the use of mp-MRI in active surveillance. Both DWI and spectroscopy allow this assessment, the first by studying the effect of the increased cellular density on free water motion, and the second by analyzing changes on the concentration of some metabolites like choline, creatine and citrate.3---5
This functional imaging technique assesses the random movement of water molecules in different physical media. It is possible through the application of diffusion-sensitizing gradients with distinct strengths, known as b values and measured in seconds per square millimeter (s/mm2). It
means that with a b value of 0 s/mm2, there is no gradient
and the signal intensity is based on T2 weighting. At high b values, such as 1000 s/mm2, the water molecules within
a highly cellular tissue retain their high signal and persist bright on DWI, as may occur within a tumor. In contrast, tis-sues containing water moving freely, like the bladder, will lose their signal.6---9
DWI allows a quantitative analysis through the calculus of the apparent diffusion coefficient (ADC), measured in
square millimeters per second. This quantification is dis-played parametrically in a gray-scale map, where areas of restricted diffusion appear with a darker shade of gray (lower ADC values) and tissues with freely moving water show lighter shades of gray (higher ADC values). Some stud-ies have shown a significant negative correlation between the ADC values of prostate tumors and prostatectomy specimen Gleason scores. Moreover, ADC values appear to perform better than TRUS biopsy Gleason scores in the asso-ciation with prostatectomy Gleason scores. ADC values may allow a risk stratification and correct guidance of low-risk patients toward active surveillance.6,10,11
This manuscript will focus on the role of DWI in evaluating tumor aggressiveness. The purpose of our study was to eval-uate the relationship between mean ADCs and post-surgical Gleason scores, and to determine the diagnostic accuracy of mp-MRI on a 1.5 T magnet without endorectal coil in distin-guishing low, intermediate and high-risk prostate tumors.
Material and methods
This is a retrospective institutional-review-board-approved, single-center study.
Patients
Within a 2-year period (from January 2013 to December 2014), 198 patients underwent prostate mp-MRI for detec-tion, staging and active surveillance purposes. Among these patients, 32 patients with biopsy-proven cancers underwent radical prostatectomy. Two patients were excluded from the study because of motion artifacts on MRI. The remaining
30 patients were included in the study (median age, 60 years, range 50---74).
MRI protocol
Mp-MRI studies were performed on a 1.5 T body scanner (Magnetom Avanto; Siemens) with a 33 mT/m maximum gra-dient capability using an eight channel pelvic phased array (PPA), without endorectal coil (ERC). Peristalsis was not sup-pressed. In order to avoid post-biopsy hemorrhage, mp-MRI was performed at least 6 weeks after biopsy.
The study of the pelvis included an axial turbo spin-eco T1WI imaging and an axial blade T2WI with fat saturation. With regard to the prostate gland study, we performed a set of axial, coronal and sagittal high-resolution T2WI (3 mm; gap 0.6 mm; FOV 20 cm; matrix 310 × 320). An axial DWI with b values of 0, 50, 1000 and 1200 s/mm2, and ADC maps
were automatically generated by the imager software. DCE-MRI using an axial fat-saturated 3D Vibe T1W MR sequence after administration of gadoterate meglumine, with a dose of 0.2 mmol/kg of body weight as a bolus injection, was also performed.
Imaging and histological analysis
Two radiologists with 3 years of experience in interpreting mp-MRI worked in consensus and reviewed all images on a workstation (Advantage, GE Healthcare). Using histolog-ical reports for guidance, the tumors were retrospectively localized in DWI and ADC maps, as bright and dark areas, respectively. Axial T2WI and DCE sequences were synchro-nized with the ones above for a better localization of the lesions and a clearer anatomic depiction. T1WI were also reviewed in order to exclude hemorrhage-related artifacts. Six sextants were considered: left base, right base, left midgland, right midgland, left apex, and right apex. Each sextant was also divided into anterior, posterior, lateral, and medial sections. When possible, each sextant was further divided into central and peripheral gland. All these divisions were considered and reported in order to precisely localize the tumors and achieve a better association with the histo-logic reports. Only tumors originating in the peripheral zone were included in our study.
Mean ADCs were measured and examined for correlation with Gleason scores. The radiologist was blinded to the Glea-son scores. All measurements were performed through the application of a single slice region of interest (ROI) within the tumor in the ADC map, trying to avoid tumor edges. ROIs had the same size for all tumors (27 mm2). In
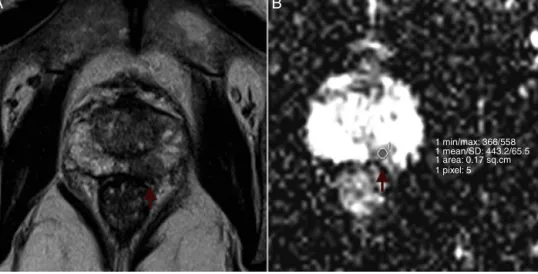
multi-focal tumors, the two largest foci were considered for ADC measurement. In large, heterogeneous tumors, ROIs were placed in the darkest area of the tumor. Due to limitations in spatial resolution, tumors smaller than 5 mm in bigger axis were not studied.Fig. 1shows an example of ROI placement. Among the 30 patients, 2 had multifocal pathology with vol-ume enough to measure on the ADC map, so a total of 32 tumors were studied.
All prostatectomies were performed within 15 days of mp-MRI, and no treatment was implemented between them. Two pathologists with 5 years of experience reviewed the specimens and were blinded to the MRI results. The
prostates were received fresh from the operating room, and both weight and dimensions were recorded. All specimens were then covered with two different color inks and fixed for 24 h in 4% neutral buffered formalin. After fixation, the apex and base were removed from each specimen as thin shave margins, and the seminal vesicles were amputated, cut into two halves and processed in toto. Then midglands were sectioned at 5 mm intervals perpendicular to the long axis of the gland. After that the cut specimens were dehy-drated in graded alcohols, cleared in xylene, embedded in paraffin, and examined histologically as 5 m-thick whole-mount hematoxylin and eosin (H&E) stained sections. Each slice was examined for the presence of gross and/or micro-scopic lesions. Similarly to the MR analysis, six sextants were considered: left base, right base, left midgland, right midgland, left apex, and right apex. Each sextant was also divided into anterior, posterior, lateral, and medial sections. Each tumor was measured in three dimensions and a Glea-son score was given. When several foci were found, GleaGlea-son scores were given separately. In order to better locate the tumor and improve correlation with MRI findings, the short-est transversal and longitudinal distances were measured between each lesion and the capsule and base and/or apex margins, respectively.
Statistical analysis
Two variables were considered: ADC values, a numeric vari-able, and Gleason scores, an ordinal variable. In relation to the Gleason scores, eight different grade groups were identified according to the primary and secondary features present. Gleason score was discretized into two new binary variables (score 6 vs score higher than 6; scores 6, 7 vs scores 8, 9). An exploratory analysis was carried out for all variables. Continuous variables were presented as mean or median, standard deviation (SD) or inter-quartile range (25th percentile---75th percentile), as required.
The relationship between ADCs and ordinal Gleason score groups was firstly analyzed by applying Spearman’s correla-tion coefficient. Data was also displayed in a scatterplot. Moreover, in order to study the diagnostic accuracy of the mean ADC, logistic regression models were fitted to the data considering the two previous defined binary variables as the outcome. Predictive and discriminative abilities of the models were assessed by the Hosmer---Lemeshow good-ness of fit test and by the area under the receiver operating characteristic curve (ROC), respectively. A model with good fit will have a lower observed Hosmer---Lemeshow chi-square statistic value and a non-significant p-value. A level of sig-nificance ˛ = 0.05 was considered. Statistical analyses were performed with software (SPSS, version 22.0.01).
Results
30 patients were included in the study, and a total of 32 tumors were considered to ADC measurement. 12 (37.5%), 13 (40.7%), and 7 (21.4%) had Gleason scores of 6, 7, and more than or equal to 8, respectively.
Mean ADC showed a significant negative correlation with Gleason ordinal scores. The Spearman p value for mean ADC was −0.594 (p < 0.001). According to the scatterplot, some
1 min/max: 366/558
A
B
1 mean/SD: 443.2/65.5 1 area: 0.17 sq.cm 1 pixel: 5
Figure 1 Example of ROI placement. Left peripheral prostate cancer in a 67-year-old man (PSA 9.5 ng/mL; Gleason Score of 8). (A) Axial T2-weighted MR image shows a left peripheral hypointense tumor (arrow). (B) ADC map reveals left suspicious hyposignal lesion and ROI placement (arrow).
9.00 8.00 Gleason score 7.00 6.00 250.0 500.0 750.0 Mean ADC 1000.0 1250.0
Figure 2 Scatterplot: relationship between Gleason scores and mean ADC.
overlap is found between the ADCs measured in tumors with Gleason scores of 6 and 7 (Fig. 2).
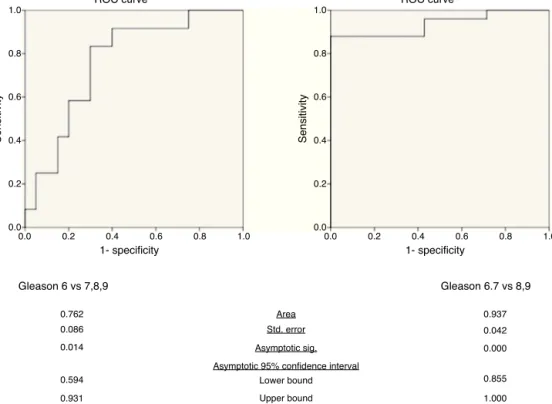
In the differentiation of tumors with a Gleason score of 6 from those with a Gleason score of at least 7, mean ADC yielded an AUC of 0.76 (95% confidence interval: 0.59, 0.93) (Fig. 3). The p value of Hosmer---Lemeshow test was 0.789. For an ADC of 0.906 × 10⁻³mm2/s, sensitivity and
speci-ficity were 83.3% (95% confidence interval: 51.6%, 97.9%) and 70.0% (95% confidence interval: 45.7%, 88.1%), respec-tively.
In the differentiation of tumors with Gleason scores of 6 or 7 from those with a Gleason score of at least 8, mean ADC yielded an AUC of 0.94 (95% confidence interval: 0.86, 1.00) (Fig. 3). The p value of Hosmer---Lemeshow test was 0.965. For an ADC of 0.649 × 10⁻³mm2/s, sensitivity and specificity
were 88.0% (95% confidence interval: 68.8%, 97.5%) and 100% (95% confidence interval: 59.0%, 100%), respectively.
Discussion
This study shows a significant negative correlation between ADC values and Gleason scores, which is consistent with other studies like those of Bittencourt et al.6 or Verma
et al.12 This manuscript also shows that mp-MRI on a 1.5-T
magnet without ERC allows a good discrimination between Gleason scores of 6 and more than 6, and an excellent discrimination between Gleason scores of 7 or lower and more than 7. We were able to provide cut offs with good sensitivity and specificity levels between different Gleason scores, which may constitute an indirect way of determin-ing biologic aggressiveness of the tumor, with consequent treatment implications. However, it remains unclear how to use ADC quantification across imaging platforms and institu-tions since some deviainstitu-tions have been shown, with greater variation reported at 1.5-T. These variations are probably multifactorial and depend on gradient systems, coil systems, pulse sequence design, imaging parameters, susceptibility artifacts, and postprocessing. Furthermore, when compar-ing 3.0-T and 1.5-T magnets, slightly higher values have been obtained at the former.13---15By now, the authors believe that
it is not possible to get a reliable cut-off ADC value for malignancy that may be used across different systems. ADC values should then be obtained and compared across dif-ferent examinations using the same protocol and magnet, which may be particularly useful in set of active surveil-lance.
Patients with Gleason scores of 6 are stratified as low risk patients. Depending on clinical and laboratorial findings, a protocol of active surveillance may be performed. Serum PSA (which should be less than 10) is the most important laboratorial feature, but PSA velocity and PSA density may also be considered. Since the randomized biopsy tends to underestimate the Gleason score, mp-MRI seems to have an important role in non-invasive aggressiveness assess-ment and, when combined with serum PSA, may be able to accurately estimate the risk. Many centers consider other features like the percentage or number of positive scores
1.0
0.8
0.6
0.4
Sensitivity
ROC curve ROC curve
0.2 0.0 0.0 0.2 0.4 0.6 1- specificity Gleason 6 vs 7,8,9 Gleason 6.7 vs 8,9 0.762 0.937 0.042 0.000 0.855 1.000 Area Std. error Asymptotic sig. Asymptotic 95% confidence interval
Lower bound Upper bound 0.086 0.014 0.594 0.931 0.8 1.0 0.0 0.2 0.4 0.6 1- specificity 0.8 1.0 1.0 0.8 0.6 0.4 Sensitivity 0.2 0.0
Figure 3 ROC curves of mean ADC in the differentiation of tumors with Gleason score of 6 from those with Gleason score of at least 7 and tumors with Gleason score of 6 and 7 from those with Gleason score of at least 8.
to estimate tumor volume and select patients for active surveillance.16,17New studies should be developed in order
to evaluate if mp-MRI findings better estimates tumor vol-ume than these biopsy features.
According to our results, mp-MRI is able to exclude high-risk patients, which are those with Gleason scores of at least 8. However, the distinction between low and intermediate risk was not so good (sensitivity of 83%). This difference was already expected since an overlap between ADCs on Gleason scores of 6 and 7 had been apparent. As a result, it seems not to be possible to obviate a guided biopsy whenever ADC values decrease. A decrease on ADC is probably related to an increase in the histological aggres-siveness and should be considered as tumor progression. Other features should obviously be evaluated, like the size, the existence of new foci, changes on post-gadolinium dynamic patterns, and signs of extra-prostatic extension.
It is not possible for all institutions to acquire the most recent technology and accompany the evolution on proto-cols, so each department should adapt technical parameters according to the magnet and software characteristics, and evaluate its own diagnostic accuracy. In the particular set of ADC measurements, the results should be compared with those derived from similar MR systems and protocols.13,14
According to some authors, optimal mp-MRI on a 1.5 T mag-net requires the use of an endorectal coil (ERC) combined with a pelvic phased-array coil (PPA) in order to produce high signal to noise ratios (SNR) and therefore improve the image resolution and acquisition speed. However, there is no consensus about this item and others suggest that the use of ERC might not be mandatory for tumor detection and localization. It may consequently save time and costs,
and cause the patient less discomfort.2,18---21 Our results are
concordant with the most recent studies with and without ERC. Therefore, we conclude that mp-MRI on a 1.5-T mag-net without ERC is highly specific and sensible, and may be used for assessment of tumor aggressiveness.
Our study had some limitations. First, it was retrospec-tive. Second, our results may not apply to a large patient population, because we have only considered patients who underwent radical prostatectomy and only 7 patients (21.4%) had a Gleason score of 8 or higher. Third, these results may only apply to peripheral tumors. Considering central and transitional tumors show distinct behavior on DWI, a specific study should be performed. Fourth, our ADCs were derived from single slice-based ROIs. Moreover, only a ROI was placed within each tumor foci (in the darkest area). So, we performed a visual, qualitative evaluation, and did not quantitatively study the entire foci. Fifth, the slice thicknesses of prostatectomy step-sections and ADC maps were not exactly the same.
Overall, our study shows results similar to other manuscripts. Nevertheless, it is important to emphasize that limitations in acquiring the most recent technology should not constraint protocol evolution and adaptation by each institution. Sustained analysis with internal tech-nology should be performed in order to assess diagnostic accuracy and validate technical protocols. In summary, our results show that mean ADC values are inversely correlated with prostatectomy Gleason scores of peripheral tumors. In combination with PSA levels, mean ADC values may allow a correct assessment of the patient risk for treatment and active surveillance purposes, on a 1.5 T magnet without ERC.
Ethical disclosures
Protection of human and animal subjects. The authors declare that no experiments were performed on humans or animals for this investigation.
Confidentiality of data. The authors declare that they have followed the protocols of their work center on the publica-tion of patient data.
Right to privacy and informed consent. The authors must have obtained the informed consent of the patients and/or subjects mentioned in the article. The author for correspon-dence must be in possession of this document.
Conflicts of interest
The authors have no conflicts of interest to declare.
Acknowledgments
We thank Ana Luísa Papoila, PhD, and Marta Alves, MD, for guidance and help with statistical analysis.
References
1.Chabanova E, Balslev I, Logager V, Hansen A, Jakobsen H, Kromann-Andersen B, et al. Prostate cancer: 1.5 T endo-coil dynamic contrast-enhanced MRI and MR spectroscopy --- correla-tion with prostate biopsy and prostatectomy histopathological data. Eur J Radiol. 2011;80:292---6.
2.Turkbey B, Albert PS, Kurdziel K, Choyke PL. Imaging localized prostate cancer: current approaches and new developments. Am J Roentgenol. 2009;192:1471---80.
3.Barentsz JO, Richenberg J, Clements R, Choyke P, Verma S, Villeirs G, et al. ESUR prostate MR guidelines 2012. Eur Radiol. 2012;22:746---57.
4.Turkbey B, Mani H, Aras O, Ho J, Hoang A, Rastinehad AR, et al. Prostate cancer: can multiparametric MR imaging help identify patients who are candidates for active surveillance? Radiology. 2013;268:144---52.
5.Vargas HA, Akin O, Franiel T, Mazaheri Y, Zheng J, Moskowitz C, et al. Diffusion-weighted endorectal MR imaging at 3 T for prostate cancer: tumor detection and assessment of aggressive-ness. Radiology. 2011;259:775---84.
6.Bittencourt LK, Barentsz JO, de Miranda LCD, Gasparetto EL. Prostate MRI: diffusion-weighted imaging at 1.5T correlates better with prostatectomy Gleason Grades than TRUS-guided biopsies in peripheral zone tumours. Eur Radiol. 2012;22:468---75.
7.Chen M, Dang HD, Wang JY, Zhou C, Li SY, Wang WC, et al. Prostate cancer detection: comparison of T2-weighted imaging, diffusion-weighted imaging, proton magnetic resonance spec-troscopic imaging, and the three techniques combined. Acta Radiol. 2008;49:602---10.
8.Qayyum A. Diffusion-weighted imaging in the abdomen and pelvis: concepts and applications. Radiographics. 2009;29:1797---810.
9.Shimofusa R, Fujimoto H, Akamata H, Motoori K, Yamamoto S, Ueda T, et al. Diffusion-weighted imaging of prostate cancer. J Comput Assist Tomogr. 2005;29:149---53.
10.Turkbey B, Shah VP, Pang Y, Bernardo M, Xu S, Kruecker J, et al. Is apparent diffusion coefficient associated with clinical risk scores for prostate cancers that are visible on 3-T MR images? Radiology. 2010;258:488---95.
11.Kitajima K, Takahashi S, Ueno Y, Miyake H, Fujisawa M, Kawakami F, et al. Do apparent diffusion coefficient (ADC) val-ues obtained using high b-valval-ues with a 3-T MRI correlate better than a transrectal ultrasound (TRUS)-guided biopsy with true Gleason scores obtained from radical prostatectomy specimens for patients with prostat. Eur J Radiol. 2013;82:1219---26. 12.Verma S, Rajesh A, Morales H, Lemen L, Bills G, Delworth M,
et al. Assessment of aggressiveness of prostate cancer: correla-tion of apparent diffusion coefficient with histologic grade after radical prostatectomy. Am J Roentgenol. 2011;196:374---81. 13.Koh D, Sohaib A. Diffusion-weighted imaging of the male pelvis.
Radiol Clin N Am. 2012;50:1127---44.
14.Giannarini G, Petralia G, Thoeny HC. Potential and limita-tions of diffusion-weighted magnetic resonance imaging in kidney, prostate, and bladder cancer including pelvic lymph node staging: a critical analysis of the literature. Eur Urol. 2012;61:326---40.
15.Sadinski M, Medved M, Karademir I, Wang S, Peng Y, Jiang Y, et al. Short-term reproducibility of apparent diffusion coeffi-cient estimated from diffusion-weighted MRI of the prostate. Abdom Imaging. 2015;40:2523---8.
16.Lawrentschuk N, Klotz L. Active surveillance for low-risk prostate cancer: an update. Nat Rev Urol. 2011;8:312---20. 17.Large M, Eggener S. Active surveillance for low-risk localized
prostate cancer. Oncol Willist Park. 2009;23:974---9.
18.Ravizzini G, Turkbey B, Kurdziel K, Choyke PL. New horizons in prostate cancer imaging. Eur J Radiol. 2009;70:212---26. 19.Hricak H, Choyke P, Eberhardt SC, Leibel SA, Scardino PT.
Imag-ing prostate cancer: a multidisciplinary perspective. Radiology. 2007;243:28---53.
20.Ben CA, Girouin N, Colombel M, Maréchal JM, Gelet A, Bissery A, et al. Evaluation of T2-weighted and dynamic contrast-enhanced MRI in localizing prostate cancer before repeat biopsy. Eur Radiol. 2009;19:770---8.
21.Heijmink S, Fütterer JJ, Hambrock T, Takahashi S, Scheenen TW, Huisman HJ, et al. Prostate cancer: body-array versus endorectal coil MR imaging at 3 T --- comparison of image quality, localization, and staging performance. Radiology. 2007;244:184---95.