Pedro Miguel Fernandes Ramos de Carvalho
Porto, 2014
Effect of Sugary Beverages
Ingestion on Thirst Sensation
Dissertation submitted to the Faculty of Nutrition and Food Sciences of the University of Porto for the degree of Doctor of Philosophy in Food Consumption and Nutrition Sciences
Supervisor:Prof. Doutor Vitor Hugo Teixeira
This investigation was partially funded by Instituto de Hidratação e Saúde and European Hydration Institute
Contents
Acknowledgements 9 List of Abbreviations 11 Abstract 13 Resumo 15 1. Introduction 172. Hypothesis and aims 23
3. Studies 3.1 – The physiological, sensory and environmental regulation of thirst 27
3.2 – Effect of energetic and non-energetic sweetened beverages ingestion on thirst sensation 39
3.3 – Effect of beverage sweetness on thirst sensation and fluid intake 59
3.4 – The impact of different energetic beverages on thirst sensation 77
Acknowledgments
This thesis was made possibly thanks to the contribution of a lot of people and institutions to whom I am grateful:
My beloved parents and sister
My supervisor, example and friend Prof. Dr. Vitor Hugo Teixeira Arq. Luzia Gama
Prof. Dr. Pedro Moreira Dra. Mónica Sousa Profª. Dr.ª. Patrícia Padrão Mestre Renata Barros Prof. Dr. José Soares Prof. Dr. Nuno Borges Eng. Rui Chilro Engª. Maria de Jesus Prof. Dr. Paulo Marques
Prof. Dr. Franklim Marques and his team Prof. Dr. João Tiago Guimarães and his team Dr. Gustavo Costa
Dr. Ricardo Pinto Dr. Filipe Barbosa
Sr. João Noronha, Sra. Mónica Lamas and Sra. Fernanda Cardoso All my PhD colleagues
All the participants of the trials Sumol+Compal
SASUP
Instituto de Hidratação e Saúde European Hydration Institute
List of Abbreviations
BIA - Bioelectrical impedance Analysis BMI– Body Mass Index
CCK– Cholecystokinin
ECW– Extracellular Body Water
GIP – Gastric Inhibitory Polypeptide GLM– General Linear Model
GLP-1 – Glucagon-like Peptide-1 GLUT 5– Glucose Transporter 5
HFCS – High Fructose Corn Syrup HS– “High” Sucralose
ICW– Intracellular Body Water
IT – Iced Tea
LS– “Low” Sucralose
NFM– Non-fat Milk
NRS– Numeric Rating Scale
NST– Nucleus of the Solitary Tract
OJ – Orange Juice PDS– Pinapple Diet Soda
PS– Pineapple Soda
SGLT-1 – Sodium-glucose Cotransporter 1 SPSS– Statistical Package for Social Sciences
TBW– Total Body Water
VAS– Visual Analog Scale
Abstract
Sugary beverages are believed to increase thirst sensation due to their hyperosmolality face to plasma but the few studies that analyzed this relationship show contradictory results. In addition to this, non-energetic sweetened beverages and beverages with different sweetness levels and sugars could be hypo-osmolar in comparison to blood and their impact on thirst is still unknown. This work aimed to compare the effect on thirst sensation of: beverages sweetened with sugar and non-caloric sweeteners; beverages with different sweetness levels and beverages with distinct dietary sugars.
In three distinct clinical trial series with a crossover design, participants consumed a standardized breakfast followed by three different chilled preloads: 1) 500ml of water, regular and diet pineapple soda; 2) 500ml of water, high-sweetened diet pineapple soda and low-sweetened pineapple soda; 3) 330ml of water, non-fat milk, orange juice and iced tea. They rated thirst, desire to drink, mouth dryness, nausea, hunger and desire to eat at baseline and at 30-min intervals until a standardized lunch with ad libitum water intake being served 2h30 after preload. Hydration status, glycaemia, plasma osmolality and sodium (in third trial) were evaluated at baseline and before lunch. Until the end of the day, participants recorded all food and fluid intake.
Thirst sensation does not differ greatly between all beverages studied and only a tendency to higher thirst ratings after non-fat milk intake face to water and iced tea was observed in men. A tendency to higher water intake at subsequent meal was detected in high-sweetened, low-sweetened and regular pineapple soda face to water, and in non-fat milk face to water and iced tea. Sugary beverages led to a more pronouncedly decrease in glycaemia face to water but hydration status, plasma osmolality and sodium does not exhibited major differences between beverages. Energy, sugars, caloric beverages and total fluid intake after lunch and until the end of the day does not differ significantly regardless of the morning preload.
Thus, despite different sugar, sweetness and osmolality levels, our work suggests that sugary and sweetened beverages, when presented chilled, are as thirst-quenching as water, with a potential exception of non-fat milk. These beverages does not elicit major differences in hydration status and other physiological parameters involved in thirst regulation and in short-term nutritional intake.
Resumo
Presume-se que as bebidas açucaradas aumentem a sensação de sede pelo facto de, na sua maioria, serem hiperosmolares em relação ao plasma. Ainda assim, os estudos que analisaram esta relação mostraram resultados bastante contraditórios. Para além disso, as bebidas com edulcorantes e com diferentes graus de doçura e açúcares distintos, podem ser hipoosmolares relativamente ao plasma e o seu impacto na sensação de sede é ainda desconhecido. Este trabalho teve assim como objectivo comparar o efeito na sensação de sede de: bebidas açucaradas e com edulcorantes; bebidas com diferentes níveis de doçura e bebidas com diferentes fontes de açúcar. Em três series distintas de ensaios clínicos com design crossover, os participantes ingeriram um pequeno-almoço estandardizado seguido da ingestão de 3 conjuntos de bebidas-teste frescas: 1) 500ml de água, refrigerante de ananás e refrigerante light de ananás; 2) 500ml de água, refrigerante de ananás muito doce e refrigerante de ananás pouco doce; 3) 330 ml de água, leite magro, sumo 100% laranja e chá gelado. Foram classificadas as sensações de sede, desejo de beber, secura da boca, náusea, fome e desejo de comer no início do ensaio clinico e a cada 30 minutos até a um almoço com ingestão de água ad libitum ser servido, 2h30 após a ingestão das bebidas-teste. O estado de hidratação e glicemia, osmolaridade e sódio plasmático (no último ensaio) foram avaliados no início no protocolo e antes do almoço, sendo que após este e até ao final desse dia, os participantes registaram em diários alimentares todos os alimentos ingeridos. A sensação de sede não diferiu de modo significativo entre todas as bebidas estudadas, sendo que apenas uma tendência para maiores níveis de sede após a ingestão de leite magro comparativamente a água e chá gelado foi observada nos homens. Uma tendência para uma maior ingestão de água no almoço subsequente foi igualmente detectada após a ingestão de todos os refrigerantes de ananás em comparação com a água e após a ingestão de leite magro em comparação com a água e chá gelado. As bebidas açucaradas levaram a uma descida mais pronunciada dos níveis de glicemia em comparação com a água mas os níveis do estado de hidratação, osmolaridade e sódio plasmático não mostraram diferenças significativas entre bebidas. A ingestão energética, de açúcares, bebidas calóricas e fluidos ao longo do dia do ensaio clínico não foi substancialmente diferente independentemente da bebida-teste ingerida nessa manhã.
Assim, apesar dos diferentes níveis de açúcar, doçura e osmolaridade, o nosso trabalho sugere que bebidas com açúcar e edulcorantes, quando ingeridas frescas, são tão eficazes quanto a água na saciação da sede, com uma potencial excepção do leite magro. Nenhuma das bebidas promoveu diferenças significativas no estado de hidratação e nos outros parâmetros fisiológicos envolvidos na regulação da sede bem como na ingestão nutricional a curto prazo.
Health, and particularly nutrition, are perhaps the matters more susceptible to myths and fads. The classical recommendation to avoid sugary beverages when thirsty, due to their hypothetic inefficacy in thirst-quenching capacity is a great example of a nutrition myth with no scientific evidence. The mechanism behind this recommendation is the fact that most of sugary beverages are hyperosmolar face to plasma and an increase in blood osmolality could possibly trigger thirst sensation. However, until now, no studies have analyzed specifically the impact of commercially available sugary beverages on thirst sensation. The few ones that partially investigate the impact of sugar and sugary beverages on thirst does not show a coherent pattern that allow us to draw any conclusion. Firstly, in a study that infused various hypertonic solutions in healthy humans, revealed that saline and mannitol infusions led to increases in plasma osmolality and vasopressin concentration, but hypertonic glucose, although had significantly increase plasma osmolality, decreased plasma vasopressin and had no detectable effect on thirst [1]. Other studies [2-6]
have analyzed the impact of different beverages such as milk, fruit juices and cola beverages on satiety and subsequent energy intake but with thirst assessment only as a secondary outcome. Even so, the results were contradicting. In a study when participants ingested 360g of water, diet cola, regular cola, orange juice, 1% milk or no beverage during an ad libitum lunch reveal that thirst ratings were lower after consumption of diet cola than after consumption of juice or milk. Subjects’ ratings of fullness after lunch did not differ among beverages, but were lower for the non-beverage condition, and energy intake from lunch (including beverage) did not differ among the caloric beverage conditions [2]. Another study compared the effects of 590ml of orange
juice, low-fat milk (1%), regular cola and sparkling on hunger, thirst, satiety and energy intake at next meal. Although four beverages have satisfied thirst equally well, a significant beverage by gender interaction occurred with water and orange juice satisfying thirst better than did the cola beverage in women. The three energy-containing beverages were associated with higher fullness and reduced hunger compared to water, but energy intake at subsequent lunch were the same across all four beverage conditions [3]. A study of Monsivais et al, compared the effects
of 475ml diet cola, 495ml 1%milk, 525ml sucrose-sweetened cola, 475ml of high-fructose corn sweetened cola with 42% of fructose (HFCS 42) and 525ml of high-fructose corn syrup-sweetened cola with 55% of fructose (HFCS 55) on hunger, satiety and energy intake at next meal. Here, the 5 beverages did not differ significantly from each other in thirst ratings, hunger and satiety profiles with milk being the only beverage to partially suppress energy intake at next lunch [4]. Another study that aimed to measure the effects of oro-sensory stimulation and energy
content on taste-related brain activations of 450ml of sucrose-sweetened orangeade and non-caloric sweetened orangeade, reported that thirst decrease equally in the two beverages [6].
The only study that reported an effective increase in thirst after the intake of sugary beverages is from 1990 and showed that thirst sensation decreased less after the consumption of 235ml of sucrose sweetened lemonade than of the same amount of water and aspartame-sweetened
1.
lemonade. However, this was observed when the beverages were ingested in a context of an ad
libitum self-selected lunch, and when the beverage volume doubled to 470ml this effect faded [7]. Since the main objective of almost all of these studies was to evaluate the effect of beverages
on satiety, hunger and energy intake at subsequent meal, physiological parameters involved in thirst regulation were not evaluated nor as ad libitum water intake in subsequent meal. Even with this methodological issues, in this short review, we can thus conclude that does not exist a linear relationship between the amount or even the presence of sugar in a beverages and a positive impact on thirst sensation.
Regarding the ingestion of sugary beverages and their metabolic effect, Kristek et al [8],
proposed an interesting theoretical model. In this model, it is postulated that sucrose drinks, with an osmolality near 400mOsm/kg, require small amounts of water to reach isotonicity (0.5 liters only needs 0.16 liters of water to become 300mOsm). Then, 50% of the total intestine volume (near 0.33 liters) will be quickly absorbed with glucose, and the rest will slowly follow fructose absorption with fluid volume load being optimized within 3 or 4h. A different process would occur with HFCS-containing soft drinks, because, when 500ml of a soft drink with HFCS (800mOsm/Kg) is ingested, it needs to be diluted to a total volume of more than a 1 liter to become isotonic. Nearly 45% of this volume is expected to be absorbed within 2 hours, along with glucose absorption, but the reestablishment of hydration levels, affected by the need to dilute the hyperosmotic HFCS beverage, takes the next 2 hours along with slow fructose absorption, not being thus a surprise (according with the author) that thirst can be sooner and better satisfied by fresh water than by hyperosmolar soft drinks.
Nevertheless, this mechanism and expected results in thirst sensation was not confirmed in clinical trials cited above.
References
1. Zerbe, R.L. and G.L. Robertson, Osmoregulation of thirst and vasopressin secretion in
human subjects: effect of various solutes. Am J Physiol, 1983. 244 (6): p. E607-14. 2. DellaValle, D.M., L.S. Roe, and B.J. Rolls, Does the consumption of caloric and
non-caloric beverages with a meal affect energy intake? Appetite, 2005. 44 (2): p. 187-193. 3. Almiron-Roig, E. and A. Drewnowski, Hunger, thirst, and energy intakes following
consumption of caloric beverages. Physiol Behav, 2003. 79 (4-5): p. 767-73.
4. Monsivais, P., M.M. Perrigue, and A. Drewnowski, Sugars and satiety: does the type of sweetener make a difference? Am J Clin Nutr, 2007. 86 (1): p. 116-23.
5. Almiron-Roig, E., S.Y. Flores, and A. Drewnowski, No difference in satiety or in
subsequent energy intakes between a beverage and a solid food. Physiol Behav, 2004. 82 (4): p. 671-7.
6. Smeets, P.A., et al., Consumption of caloric and non-caloric versions of a soft drink
differentially affects brain activation during tasting. Neuroimage, 2011. 54 (2): p. 1367-74. 7. Rolls, B.J., S. Kim, and I.C. Fedoroff, Effects of drinks sweetened with sucrose or
aspartame on hunger, thirst and food intake in men. Physiol Behav, 1990. 48 (1): p.19-26. 8. Kristek, B., S. Kurbel, and I. Banjari, Characteristics of dietary sugars compared with
Hypothesis
Sugary beverages are less effective than water in thirst satisfaction due to their hyperosmolality face to plasma
Aims
The specific aims of this thesis were:
1. Compare the effect of beverages sweetened with sugar and non-caloric sweeteners on
thirst sensation
2. Analyze the impact of the beverage sweetness level on thirst
3. Compare the effect of energetic beverages with distinct dietary sugars on thirst
2.
Abstract
The correct physiological function of all systems in the body and body fluid homeostasis re-quires a constant supply of water and sodium. Fluid balance is maintained via thirst, a feed-back-controlled process regulated acutely by central and peripheral mechanisms. Increases in blood osmolality draws water from cells into the blood, dehydrating specific brain receptors that stimulate drinking and the release of vasopressin. Water losses are lowered by increases in water reabsorption in kidneys and reduction of urine volume. Dehydration caused by losses of water from extracellular compartment, stimulate vascular receptors that signal brain centers to initiate drinking and vasopressin release. In kidneys, baroreceptors release renin that starts a cascade of events to produce angiotensin II that in addition to initiate drinking and vasopressin release, also stimulates aldosterone to reduce the sodium losses in urine. At same time, vasopressin and angiotensin II exerts a vasoactive effect to reduce blood vessel diameter around the remain-ing blood. This integrated response to dehydration allow cardiovascular system to maintain a constant perfusion pressure particularly to the brain, however, other factors beyond osmolality and plasma volume seem to affect thirst and drinking since pre-absorptive mechanisms such as oropharyngeal receptor stimulation are capable to decrease thirst sensation before body fluid restoration is achieved. Sensory characteristics of beverages are also a major determinant of their thirst-quenching ability with attributes intimately related with mouth-wetting effect such as cold, sour and acid having a thirst supressing capacity, with the opposite being observed for beverage sweetness, thickness and after taste.
3.1
The Physiological, Sensory
and Environmental
Regulation of Thirst
pedrocarvalho a, mónicasousa b,renatabarros a, pedromoreira a, c, d, patríciapadrão a, d, vitorhugoteixeira a, c
a – faculdadedeciênciasdanutriçãoealimentação, universidadedoporto, portugal b – centrodeinvestigação, formação, inovaçãoeintervençãoemdesporto,
faculdadededesporto, universidadedoporto, portugal c – centrodeinvestigaçãoematividadefísica, saúdeelazer, faculdadededesporto, universidadedoporto, portugal d – institutodesaúdepública, universidadedoporto, portugal
Introduction
Thirst is a sensation that is difficult to describe and a physiological state often difficult to diag-nose, despite being a process very finely controlled [1]. It has been described as “the perception
of one’s need for drink” [2], as “the consequence of the need to moisten the mouth” [3] or as “a
physiological state linked to fluid deficit” [4, 5]. Thus, despite being a subjective perception, thirst
plays a key role in the regulation of body fluid homeostasis since correct physiological function of all the systems in the body requires a constant supply of water and sodium [6]. Fluid balance
is then maintained via thirst, a feedback-controlled variable, regulated acutely by central and peripheral mechanisms.
Physiological Regulation
of Thirst
Under ideal conditions, where all physiological systems function correctly, the osmolality of all fluid compartments is the same and water is distributed proportionally (2/3 intracellular and 1/3 extracellular). Sodium is the principal cation of the extracellular fluids with potassium being that of the intracellular compartment. The balance between this two cations plays an essential role in the regulation of plasma osmolality, the gradient that regulates the movement of water within the body [1]. Small increases of 1-2% in the effective osmotic pressure of plasma result in stimulation
of thirst. This can be achieved by an increase in sodium concentration like a meal or solutes like sodium chloride or sucrose [7]. In intracellular or osmotic thirst, when an increase in osmolality
of extracellular space occur, water draws from the intracellular space to reestablish the condition of equiosmolality. This increase in osmolality trigger a response by neurons existing in central nervous system and in the periphery (osmoreceptors) transmitting a neural input to the brain to initiate the search for water and reduce osmolality to a physiological set point. This search for water is then mediated by osmoreceptors existing in the brain and in the periphery (kidneys) and baroreceptors present in cardiopulmonary system and arterial walls which connect with the paraventricular and supraoptic nuclei of hypothalamus to liberate vasopressin from their axon terminals in the posterior neurohypophysis into blood stream (reviewed by [1, 8]). The osmotic
threshold for both thirst and vasopressin release is generally considered to be very similar and once defined as 281mOsm/Kg for thirst and 285mOsm/Kg for vasopressin [9]. This antidiuretic
hormone is also responsible for increase the membrane permeability in distal tubules and col-lecting ducts of nephrons and thereby increases water reabsorption and the concentration of excreted urine [10]. Any water drunk at this time would be rapidly absorbed into the blood supply
reducing the concentration gradient and reestablishing the normal concentrations and volumes in both compartments [6].
In extracellular or volemic thirst, a fluid loss from the vasculature in the order of 5-8% (e.g. hem-orrhage, vomiting, sodium loss or edema) leads to a decrease in blood volume and, consequently, fluid from the interstitial compartment move into the blood flow to reestablish the homeostasis. Detectors in the arch of aorta, carotid sinus and great veins sense this decrease in plasma volume and increase the production of vasopressin with consequent reduction in urine production. Si-multaneously, pressure detectors in juxtaglomerular apparatus of the kidney sense the decrease in perfusion pressure and promote the release of renin. Renin acts on circulating angiotensino-gen released from liver producing angiotensin I. This decapeptide is then converted in the lung to angiotensin II, by angiotensin-converting enzyme and this octapeptide exerts several actions having a vasoactive effect in the reduction of the diameter of the blood vessels and also stimulate the release of vasopressin and another hormone – aldosterone - from the adrenals. Aldosterone is the hormone responsible for sodium regulation, decreasing the excretion of this cation in urine via stimulation of sodium potassium ATPase pump in kidney distal tubule and collecting duct. Al-dosterone also sensitizes hypothalamus to the circulating levels of angiotensin II which stimulates the ingestion of sodium, the “sodium appetite”. This concerted actions promote the ingestion of water and sodium and ensure that blood volume does not decrease to a volume that is dangerous to health. As blood volume increases, the stimuli for thirst disappear, and vasopressin and renin levels goes down allowing the vasculature to accommodate the increase in volume without the consequent increase in blood pressure that in inherent to the vasoconstrictor character of vaso-pressin (reviewed by [1, 6]).
Besides hypothalamic control of thirst, other neural mechanisms are involved in homeostatic reg-ulation of fluid intake. Since angiotensin and vasopressin cannot cross the blood-brain barrier, the translation of the endocrine signal into conscious awareness of thirst occurs by activation of re-ceptors for these hormones in two circumventricular organs (subfornical organ and the organum vasculosum of the lamina terminalis) situated in the anterior wall of third ventricle, outside the hy-pothalamus [11]. The destruction by lesion of these organs cause an inhibition of thirst in rodents [12]. Even knowing that data on this kind of lesions in humans is obviously limited, disease states
affecting hypothalamus, such as Huntington’s disease, are associated with altered vasopressin levels, increased thirst levels and dry-mouth sensations [5, 13]. So, although hypothalamus was
classically considered the “thirst center”, these interactions with extra-hypothalamic regions cre-ate a complex neural circuitry regulating fluid intake [14, 15].
Nevertheless, other factors beyond osmolality and plasma volume seem to affect thirst and drink-ing [16]. The fact that humans stop drinking following dehydration-induce thirst well before body
fluid restoration is achieved [17] and osmolality only starts to decrease about 10 minutes after
cessation of drinking [4] shows that pre-absorptive mechanisms such as oropharyngeal receptor
stimulation need to be involved. At this regard, a study where the water previously ingested was extracted from the stomach via nasal-gastric tube found that subjects’ thirst returned to baseline values even though no water as absorbed [17]. This same oropharyngeal receptors are
respon-sible for the ergogenic effect of carbohydrate mouth rinses in athletic performance, since it has become clear that the underlying mechanisms for the ergogenic effect during exercises with
rel-atively short duration (~1h) may reside in the central nervous system and are not confined to its conventional metabolic advantage [18].
Thus, it is clear that hyperosmolality and/or hypovolemia stimulate thirst. However, it is not clear whether drinking is a response of changes in osmolality or plasma volume during normal daily conditions since fluid consumption can be made well before any water deficit occur [19] and ap-proximately 75% of fluid intake occurs peri-prandially [20] which reinforces the importance of the non-homeostatic influences on drinking [21].
How can we measure thirst?
Thirst assessment relies upon and individual’s recognition, perception, and explanation of the sensation [15]. The methods more commonly used to measure thirst were visual analog scales
(VAS) and categorical scales, such as numeric rating scales (NRS). A recent review [22] of clinical
trials that investigated the relationship of thirst to specific physiologic thirst-related correlates and associated thirst mediators showed that all studies used VAS or NRS to quantify thirst sen-sation. To our knowledge, a comparison of the sensitivity or applicability of these instruments in thirst assessment has never been made. Although the majority of the trials included in the review cited above used VAS as a method to assess thirst, the opposite succeed in studies that inves-tigated the impact of sugary and sweetened beverages on thirst. Here, most of the studies used unipolar adjective scales anchored at each end with labels 1=not thirsty at all and 9=extremely
thirsty [23-26], notwithstanding that some of them used a 100-mm VAS with the same labels [27, 28]. In addition to this, correlations between thirst and biomarkers of the physiological systems
that regulate fluid balance (e.g. short-term body mass (water) loss, serum osmolality, plasma vol-ume) are weak and there is no single index that is a reliable predictor [29, 30].
Regardless of the method used, a very pertinent question remains: Is perceived thirst translated into higher ad libitum fluid intake? Most of the studies does not include a procedure that evaluate this relationship and it is known that thirst ratings, in particular, does not show an unequivocal correspondence with drinking raising the concept of hedonic thirst, where drinking may be driven more by pleasure and reward than by fluid balance [31].
Sensory and environmental
influences in thirst
The environmental changes that promoted a constant availability of foods and beverages and the multiple social contexts that encourage eating and drinking in the absence of energy and fluid needs have partially degraded the functional relationship between appetitive sensations and food and beverages intake [31]. On the other hand, when we try to find some reasons to the
lack of response to physiological signals of thirst, we see that the same environmental issues can also be responsible for this situation, as showed by the main barriers to fluid consumption by kidney stone formers: “not knowing the benefits of fluid”, “not remembering to drink”, “disliking the taste of water”, “lack of thirst and lack of availability”, and finally “the need to void frequently and related workplace disruptions” [32]. Particularly in these individuals with chronic lower fluid
ingestion, the high palatability of many energy-yielding or non-energetic sweetened beverages may facilitate their consumption through the enhancement of rewarding sensory associations. Beverage properties such as flavor [33], color [34], sweetness [35] and temperature [36, 37] can
all be manipulated to enhance non-homeostatic ingestive behaviors such as drinking highly pal-atable energy-yielding beverages to satisfy thirst in the absence of energy need. In the study of McKiernan et al [20] where relationship between human thirst, hunger, drinking and feeding was
evaluated, individuals responded “appropriately” by consuming water in response to thirst, in the absence of hunger, only 2% of the time. They responded “inappropriately” (i.e., thirsty and hungry but did not drink or eat; not thirsty and not hungry but drank and/or ate; not thirsty but hungry and drank but did not eat; thirsty but not hungry and did not drink but ate) 62% of the time. Regarding the influence of beverage sensory characteristics on thirst sensation, the review from Labbe et al [5] present a very interesting relationship between specific beverage attributes
and their thirst-quenching capacity (Fig. 1). In this context, beverages that promote a higher mouth-wetting effect due to their cold temperature or due to their acid flavor and subsequent increase in saliva secretion are perceived as more effective in thirst satisfaction [38].
Senso-ry trained panels [38-40] are also in agreement regarding the attributes positively (coldness,
sourness, clear appearance) and negatively (thickness, sweetness, after-taste) correlated with the refreshing perception and thirst-quenching ability of beverages. Beverage carbonation play also a role in thirst perception. Levels of carbonation equal or in excess of 2.3 volumes of CO2 can negatively impact drink acceptability, voluntary fluid intake and thirst quenching capacity
[41], although a more recent study does not report any difference in thirst ratings between
sug-ar-sweetened beverages with low (1.7), medium (2.5) and high (3.7) volumes of CO2[42].
There-fore, sensory characteristics of the beverages have a crucial role in thirst satisfaction and in drinking behavior.
Thus, regarding the physiological, sensory and environmental factors comprising thirst sensation, the conclusions of the review of Richard Mattes [21] provide a great comprehension about the
integration of all these dimensions on drinking behavior: A) thirst sensations are high and stable over the day; B) the health consequences of drinking in moderate excess of need are minimal; C) there are strong non-homeostatic influences on drinking; D) beverages are highly palatable, inexpensive and convenient; E) it is socially acceptable to drink in many social and professional settings and F) beverages elicit weak compensatory dietary responses.
Figure 1. Schematic representation of the construction of refreshing perception Image from D. Labbe et al. (2009)
References
1. Thornton, S.N., Thirst and hydration: physiology and consequences of dysfunction. Physiol Behav, 2010. 100 (1): p. 15-21.
2. French, S., et al., Satisfaction of hunger and thirst by foods and drinks. Brit Food J, 1995.
95: p. 19-26.
3. Brunstrom, J.M., P.M. Tribbeck, and A.W. MacRae, The role of mouth state in the
termi-nation of drinking behavior in humans. Physiol Behav, 2000. 68 (4): p. 579-83. 4. Saltmarsh, M., Thirst: or why do people drink? Nutr Bull, 2001. 26: p. 53-8.
5. Labbe, D., et al., Sensory basis of refreshing perception: role of psychophysiological
factors and food experience. Physiol Behav, 2009. 98 (1-2): p. 1-9. 6. Thornton, S.N., Regulation of thirst. Nutr Today, 2013. 48 (4S): p. S4-S6.
7. Zerbe, R.L. and G.L. Robertson, Osmoregulation of thirst and vasopressin secretion in
human subjects: effect of various solutes. Am J Physiol, 1983. 244 (6): p. E607-14. 8. Sewards, T.V. and M.A. Sewards, The awareness of thirst: proposed neural correlates.
Conscious Cogn, 2000. 9 (4): p. 463-87.
9. Thompson, C.J., et al., The osmotic thresholds for thirst and vasopressin release are
similar in healthy man. Clin Sci (Lond), 1986. 71 (6): p. 651-6.
10. Guyton, A. and J. Hall, Textbook of Medical Physiology. 2006: Elsevier.
11. McKinley, M.J. and A.K. Johnson, The physiological regulation of thirst and fluid intake. News Physiol Sci, 2004. 19: p. 1-6.
12. Fitts, D.A., et al., Effects of forebrain circumventricular organ ablation on drinking or
salt appetite after sodium depletion or hypernatremia. Am J Physiol Regul Integr Comp
Physiol, 2004. 287 (6): p. R1325-34.
13. Wood, N.I., et al., Increased thirst and drinking in Huntington’s disease and the R6/2
mouse. Brain Res Bull, 2008. 76 (1-2): p. 70-9.
14. McKinley, M.J., et al., Water intake and the neural correlates of the consciousness of
15. Millard-Stafford, M., et al., Thirst and hydration status in everyday life. Nutr Rev, 2012. 70 Suppl 2: p. S147-51.
16. Kavouras, S.A., Thirst - Survival Instinct or Sensitive Fluid Balance Homeostatic
Mecha-nism? Nutr Today, 2013. 48 (4S): p. S7-S9.
17. Figaro, M.K. and G.W. Mack, Regulation of fluid intake in dehydrated humans: role of
oropharyngeal stimulation. Am J Physiol, 1997. 272 (6 Pt 2): p. R1740-6.
18. Jeukendrup, A.E., I. Rollo, and J.M. Carter, Carbohydrate mouth rinse: Performance
ef-fects and mechanisms. Sports Science Exchange, 2013. 26 (118): p. 1-8.
19. Phillips, P.A., et al., Body fluid changes, thirst and drinking in man during free access to
water. Physiol Behav, 1984. 33 (3): p. 357-63.
20. McKiernan, F., J.A. Houchins, and R.D. Mattes, Relationships between human thirst,
hunger, drinking, and feeding. Physiol Behav, 2008. 94 (5): p. 700-8.
21. Mattes, R.D., Hunger and thirst: issues in measurement and prediction of eating and
drinking. Physiol Behav, 2010. 100 (1): p. 22-32.
22. Arai, S.R., et al., Quench the thirst: lessons from clinical thirst trials. Biol Res Nurs, 2014.
16 (4): p. 456-66.
23. Almiron-Roig, E., S.Y. Flores, and A. Drewnowski, No difference in satiety or in
subse-quent energy intakes between a beverage and a solid food. Physiol Behav, 2004. 82 (4):
p. 671-7.
24. Tsuchiya, A., et al., Higher satiety ratings following yogurt consumption relative to fruit
drink or dairy fruit drink. J Am Diet Assoc, 2006. 106 (4): p. 550-7.
25. Smeets, P.A., et al., Consumption of caloric and non-caloric versions of a soft drink
dif-ferentially affects brain activation during tasting. Neuroimage, 2011. 54 (2): p. 1367-74. 26. Almiron-Roig, E. and A. Drewnowski, Hunger, thirst, and energy intakes following
con-sumption of caloric beverages. Physiol Behav, 2003. 79 (4-5): p. 767-73.
27. DellaValle, D.M., L.S. Roe, and B.J. Rolls, Does the consumption of caloric and
28. Monsivais, P., M.M. Perrigue, and A. Drewnowski, Sugars and satiety: does the type of
sweetener make a difference? Am J Clin Nutr, 2007. 86 (1): p. 116-23.
29. Shirreffs, S.M., et al., The effects of fluid restriction on hydration status and subjective
feelings in man. Br J Nutr, 2004. 91 (6): p. 951-8.
30. Johnson, A.K. and R.L. Thunhorst, Sensory mechanisms in the behavioral control of
body fluid balance: thirst and salt appetite. Prog Psychobiol Physiol Psychol, 1995. 16: p. 145-76.
31. McKiernan, F., et al., Thirst-drinking, hunger-eating; tight coupling? J Am Diet Assoc, 2009. 109 (3): p. 486-90.
32. McCauley, L.R., et al., Factors influencing fluid intake behavior among kidney stone
formers. J Urol, 2012. 187 (4): p. 1282-6.
33. Szlyk, P.C., et al., Effects of water temperature and flavoring on voluntary dehydration in
men. Physiol Behav, 1989. 45 (3): p. 639-47.
34. Clydesdale, F.M., R. Gover, and C. Fugardi, The effect of color on thirst quenching,
sweetness, acceptability and flavor intensity in fruit punch flavored beverages. Journal
of Food Quality, 1992. 15 (1): p. 19-38.
35. King, N.A., et al., Effects of sweetness and energy in drinks on food intake following
exercise. Physiol Behav, 1999. 66 (2): p. 375-9.
36. Brunstrom, J.M. and A.W. Macrae, Effects of temperature and volume on measures of
mouth dryness, thirst and stomach fullness in males and females. Appetite, 1997. 29 (1):
p. 31-42.
37. Rolls, B.J., et al., Effects of temperature and mode of presentation of juice on hunger,
thirst and food intake in humans. Appetite, 1990. 15 (3): p. 199-208.
38. Labbe, D., et al., Sensory determinants of refreshing. Food Quality and Preference, 2009. 20: p. 100-109.
39. McEwan, J. and J. Colwill, The sensory assessment of the thirst-quenching
characteristics of drinks. Food Qual Pref 1996. 7 (2): p. 101-11.
40. Guinard, J.X., et al., Determinants of the thirst-quenching character of beer. Appetite, 1998. 31 (1): p. 101-15.
41. Passe, D.H., M. Horn, and R. Murray, The effects of beverage carbonation on sensory
responses and voluntary fluid intake following exercise. Int J Sport Nutr, 1997. 7 (4):
p. 286-97.
42. Moorhead, S.A., et al., The level of carbonation of a sugar-sweetened beverage preload
affects satiety and short-term energy and food intakes. Br J Nutr, 2008. 99 (6):
3.2
Effects of Energetic and
Non-energetic Sweetened Beverages
Ingestion on Thirst Sensation
Submitted for publication Abstract
Sugary and sweet beverages are assumed to be less effective in satisfaction of thirst than water, but a direct link between sugar and thirst has never been described. In this study, we compared the effects of water (W), regular (PS) and diet (PDS) pineapple soda intake on thirst, mouth dry-ness, hunger and water ingestion at subsequent meal as well as their impact on hydration status, glycaemia and blood osmolality. In a crossover design, twenty-four participants (13 male), aged 19-28 years consumed in three consecutive weeks a standardized breakfast followed by a 500ml preload of water, regular or diet pineapple soda. They rated thirst, desire to drink, mouth dryness, nausea, hunger and desire to eat at baseline and at 30-min intervals until a standardized lunch with ad libitum water intake being served 2h30 after preload. Hydration status, glycaemia and plasma osmolality were evaluated at baseline and before lunch. Until the end of the day, partic-ipants recorded all food and fluid intake. Thirst sensation does not differ between beverages along the trial but PS preload revealed a tendency to higher water ingestion at lunch face to W (P=0.087). No differences on hydration status and plasma osmolality were observed between beverages but PS led to a more accentuated glycaemia decrease compared to the other preloads (P=0.004). Energy, sugars, fluid and caloric beverages intake throughout day showed no differ-ences between beverages. These results reveal an absence of a link between the ingestion of sugary and sweet beverages and thirst sensation.
Keywords: sugar, osmolality, water, sweetener, soft-drinks
pedrocarvalho a, mónicasousa b,renatabarros a, pedromoreira a, c, d, patríciapadrão a, d, vitorhugoteixeira a, c
a – faculdadedeciênciasdanutriçãoealimentação, universidadedoporto, portugal b – centrodeinvestigação, formação, inovaçãoeintervençãoemdesporto,
faculdadededesporto, universidadedoporto, portugal c – centrodeinvestigaçãoematividadefísica, saúdeelazer, faculdadededesporto, universidadedoporto, portugal d – institutodesaúdepública, universidadedoporto, portugal
Introduction
The positive relationship between sugary beverages and thirst is classic. The biological explana-tion for this common sense belief include the elevaexplana-tion of blood glucose levels and subsequent rise in blood osmolality, which would be responsible for trigger the thirst sensation. Due to the efficiency of water excretion, there are less consequences to humans of drinking in excess – ex-cept in extreme cases - than eating in excess [1]. Furthermore, thirst sensations are relatively
stable over the day, with 75% of total fluid intake occurring peri-prandially revealing a more con-sistent pattern than the episodic fluctuations generally observed for hunger [2]. This condition
has been contributing for the scarce investigation about the impact of nutritional composition of beverages on thirst so far. Moreover, it is more difficult to record changes in thirst sensation than in hunger feeling, which can also contribute to this gap in thirst research. The few studies [3-8]
that analyzed the impact of different sugary beverages on thirst sensation were inconclusive and do not allow to draw any association between the amount - or even the presence - of sugar in a beverage, and an impact on thirst. Also, the effect of beverage sweetness has never been isolated from the effect of sugar on thirst. In fact, all these studies adopted a classical ingestive model (i.e., preload) to evaluate the impact of different beverages (water, milk, yogurt, cola, orange juice, etc.) on satiety and subsequent energy intake, and thirst sensations were only measured as a sec-ondary outcome. Furthermore, no biochemical parameters such as glycaemia, blood osmolality or plasmatic sodium were measured, being the impact on thirst sensation extrapolated only by individuals’ subjective ratings.
So, with our study we aimed to determine the impact of sweetened beverages intake on thirst sensation, on physiological parameters involved in their regulation, and also distinguish the ef-fects of sugar than that of artificial sweeteners in this regard.
Material and methods
Participants
Thirty participants were recruited at University of Porto through e-mail advertisings. During the study, 6 dropouts occurred so the final sample included 24 subjects (13 male). The eligibility criteria included: age between 18-35 years; body mass index (BMI) between 18.5 – 25 kg/m2;
non-smokers; non-athletes; weight stable on the previous 6 months; not dieting to gain or lose weight; not using any kind of medication (except oral contraceptives in women) and not being pregnant and nursing. To minimize variability, each participant was asked to be fast since 22h00 of the pre-vious day and to abstain from alcohol, caffeine and strenuous physical activity on the day of the trial and the day before. To ensure euhydration status and avoid mouth dryness, subjects were
instructed to drink 500 ml of water the evening before the trial and 500 ml water on the morning of the trial immediately after wake up [9]. Participants who met these requirements and
accept-ed to participate in this study were informaccept-ed verbally and in writing regarding the experimental procedures before giving their written informed consent. Participants received a financial com-pensation upon submission of meal and transportation expenses resulting from travel to our lab.
Study design
The trials followed a single blind, randomized cross-over mode with treatment order in coun-terbalanced design. Each participant came for three sessions, separated by a week, and lasting from 08h00 to 14h00. On all testing occasions was offered to each participant a standardized breakfast followed by a preload stimuli 1h30 after. A standardized lunch was served 2h30 after preload. The time interval set between preload and lunch was longer than the previous studies in this area [3, 5, 8].
Preload stimuli
The 3 beverages studied were Water (W), Pineapple Soda (PS) and Pineapple Diet Soda (PDS). Energy, nutritional and chemical composition of the beverages are presented in Table 1. Bever-ages were presented chilled (8 – 10º C), but without ice, in 500 ml portions in opaque plastic containers. Participants were asked to consume the entire amount within 15 min. The sodas were previously decarbonized by the manufacturer to avoid any kind of interference of beverage car-bonation [6, 10]. All beverages were analyzed previously in laboratory in order to obtain their pH,
osmolality and sodium characteristics.
Preload Energy Carbohydrates Sugars Protein Fat Energy Density pH Osmolality Sodium kcal g g g g kcal/g mOsm/Kg mg Watera 0 0 0 0 0 0 5.8 3 2.05 Pineapple Sodab 220 55 55 0 0 0.44 3.5 409 13.5 Pineapple Diet SodaC 22 5.5 5.5 0 0 0.044 3.8 81 19.5 a Fastio ™, Portugal
b Sumol Ananás™, Portugal c Sumol Zero Ananás™, Portugal
Motivational Ratings
Participants rated their thirst, mouth dryness, desire to drink, hunger, nausea and desire to eat using a nine point Likert scale. The unipolar adjective scales were anchored at each end with la-bels 1 = not at all and 9 = extremely. Participants also rated their liking for the beverage in a nine point hedonic preference scale, where 1 = dislike extremely and 9 = like extremely. All scales were marked on paper.
Meals Provided
Breakfast was served at 9h30 and consisted in 5 cookies and 200 ml of orange juice. Participants had to consume the entire breakfast within 15 min. A lunch meal prepared without added salt was served at 13h00 and consisted in, approximately, 180 g of vegetable soup, 200 g of boiled rice, 150 g of grilled pork chop and 100 g of apple. Participants were allowed to drink ad libitum the water provided and the amount was measured afterwards. Identical meals were provided on each occasion and their energy and nutrient composition are represented in Table 2. Information was obtained from the label or from software Food Processor SQL Edition, version 10.0 (ESHA Research Inc., Salem, OR, USA).
Food Portion Energy Carbohydrates Sugar Protein Fat Energy Density g kcal g g g g kcal/g BREAKFAST Cookiesa 25 107 19.8 6 1.75 2.25 4.28 Orange Juicea 200ml 88 21 21 1.2 0 0.44 Total 195 40.8 27 2.95 2.25 0.87 LUNCH Vegetable Soup 180 39.6 8.7 2.9 1.4 0.54 0.22 White Rice 200 260 57.2 1 4.8 0.42 1.3 Pork Chop 150 266.4 0 0 31.9 14.5 1.78 Apple 100 47.8 12.7 9.6 0.24 0.16 0.48 Total 613.8 78.6 13.5 38.3 15.6 0.97 a Makro™, Portugal
Procedures
Participants arrived at the laboratory at 8h00 to assess height (stadiometer SECA 220) and weight, total body water (TBW), intracellular water (ICW) and extracellular water (ECW) with a Segmental Multi Frequency Body Composition Monitor (TANITA MC 180 MA®). Then, a blood sample (8 ml) was collected from the antecubital vein by a trained phlebologist for analysis of blood glucose (ABX Pentra 400; ABX Diagnostics, Montpellier, France) and osmolality (Löser Micro-Osmometer Type 15; Löser Messtechnik, Germany). During the session participants were allowed to read, listen to music with earphones, or use their portable computers with the excep-tion of internet access to minimize visual cues (e.g., unwanted publicity for beverages or visiting Web sites showing pictures of food and drinks), which may have had effect on thirst. Breakfast was served at 9h30 on every occasion, the preload beverage was offered exactly 60 minutes after breakfast (10h30) and lunch was provided at 13h00. Motivational ratings were firstly obtained at the end of blood sampling (baseline or time 0) and every 30 minutes thereafter until lunch time (times 1 through 7). Before lunch, another blood sampling was collected and TBW, ICW and ECW were evaluated once again. Immediately after lunch (time 8), participants completed the last set of ratings and a food record was given to record all food and fluid intake from that moment until 00h00 of that day. Energy and nutritional intake were estimated by Food Processor SQL Edition, version 10.0 (ESHA Research Inc., Salem, OR, USA) added with nutritional information of Portu-guese recipes and the following parameters were extracted: Energy, sugars, caloric beverages intake and total fluid intake
The procedures were approved by Ethics Committee of the Universidade do Porto (Nº30/ CEUP/2011), and were registered in ClinicalTrials.gov with (NCT ID: NCT01502722).
Data Analysis
All statistical analyses were conducted using IBM Statistical Package for Social Sciences (SPSS) 20.0 for Windows. Normality was determined by the Kolmogorov-Smirnov test (normal if P > 0.05). When the assumption of normality was violated, it was assured that variables skewness was < 3 and kurtosis < 10 [11]. Sphericity was determined by Mauchly’s test (sphericity assumed when P >
0.05). When the assumption of sphericity was violated, univariate tests of within-subjects effects were subject to Greenhouse Geisser correction (when epsilon < 0.75) and to Huynh-Feldt cor-rection (when epsilon > 0.75). General linear models (GLM) with repeated measures were used to analyze motivational ratings with beverage and time postingestion (times 3-7) as within-subjects factors and sex as the between-subjects factor. Analyses of glycaemia, plasma osmolality, extra-cellular, intracellular and total body water used a GLM with repeated measures with beverage and time as within-subjects factors and sex as between-subjects factor. When a main effect of time was observed in these variables, a t-student test was performed to find differences between mo-ments for each beverage condition. Analyses of water intake at lunch and energy and nutritional intake after lunch used a GLM with repeated measures with beverage as within-subjects factors and sex as between-subjects factor. Bonferroni-adjusted pairwise comparisons were made when differences in GLM’s were found. Only when there was a gender interaction, data were analyzed
separately for each group. Data was expressed as mean ± standard deviation. The level of signif-icance was set at P < .05.
Results
The mean age (± SD) of participants was 21.1 ± 1.75 years for men, 22.1 ± 2.79 years for women, and 21.5 ± 2.33 years for the whole group. Mean body mass index (BMI; in kg/m2) was 21.8 ± 1.77
for men, 20.3 ± 1.55 for women, and 21.1 ± 1.75 for the whole group.
Motivational Ratings
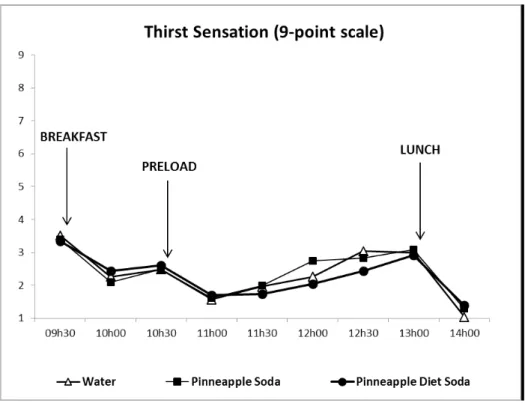
Thirst sensation ratings (Fig. 1) suffered a rough decrease after the preload consumption (P<0.001). They gradually increased until lunch time, but it was not observed a main effect of beverage [F (2, 42) = 0.54; P=0.59]. Only a main effect of time was detected [F (1.4, 28.4) = 12.6; P<0.01] and no beverage*sex [F (2, 42) = 2.13; P=0.13], or beverage*time interaction [F (8, 168) = 1.5; P=0.16] were observed.
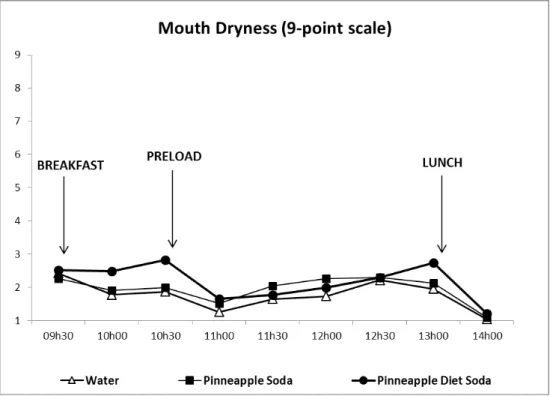
In mouth dryness ratings (Fig.2) no differences in beverage type were observed [F (2, 42) = 0.59; P=0.56]. Only a main effect of time was detected [F (2.3, 49.1) = 6.32; P=0.002] and no sex [F (2, 42) = 0.55; P=0.58], or beverage*time interaction [F (4.3, 89.2) = 1.2; P=0.32] were observed.
Figure 2. Temporal profile of mouth dryness by beverage
For desire to drink ratings (Fig.3), only a main effect of time was observed [F (1.8, 39.3) = 14.7; P<0.001]. There was no effect of beverage [F (1.7, 36.5) = 1.22; P=0.3], and no beverage*sex [F (1.7, 36.5) = 2.28; P=0.13] or beverage*time interaction [F (4.3, 94.8) = 1.5; P=0.27] were noticed.
Figure 3. Temporal profile of desire to drink by beverage
Hunger ratings (Fig.4), showed a significant effect of beverage [F (1.6, 35.2) = 83.2; P<0.001], with the pairwise comparisons revealing higher hunger scores with Water than with the other two beverages (P<0.001). There was also a significant effect of time [F (2.2, 47.2) = 35.5; P<0.001], and an interaction beverage*time [F (8, 176) = 8.35; P<0.001], revealing that hunger scores increased more in W condition than in PS and PDS. No influence of sex was observed [F (1.6, 35.2) = 0.87; P=0.41].
Desire to eat ratings corroborate the trend of hunger ratings, although the beverage influence did not reach statistical significance [F (2, 44) = 2.87; P = 0.07]. Similar to other ratings, it was regis-tered a significant effect of time [F (2.7, 58.5) = 74.0; P<0.001], and no interaction of beverage*sex [F (2, 44) = 0.74; P=0.482] or beverage*time [F (7.4, 162.6) = 1.55; P=0.15].
Ratings of nausea were not affected by time or beverage, and no sex interaction was observed (data not shown).
Figure 4. Temporal profile of hunger by beverage
Hydration Status and Biochemical Parameters
Table 3 show, for each preload condition, the TBW, ICW and ECW at the beginning of the trial and at the pre-lunch evaluation. No sex interaction was observed for any of these parameters. Similar-ly, there was not observed a significant effect of beverage in TBW: [F (2, 44) = 0.77; P=0.47], ICW: [F (1.2, 26.1) = 0.33; P=0.61] and ECW: [F (2, 44) = 0.40; P=0.67]. Only a main effect of time was observed in the rise of TBW values [F (1, 22) = 22.9; P<0.001] indicating that all three beverages had an equal capacity to increase total body water values during the trial, as revealed by T-test (W, P<0.001; PS, P=0.005; PDS, P=0.009).
Preload Condition Total Body Water (Kg) Extracellular Body Water (Kg) Intracellular Body Water (Kg)
Initial Final Initial Final Initial Final Water 37.3 ± 7.38 37.7 ± 7.61* 15.0 ± 2.67 15.1 ± 2.74 22.3 ± 4.72 22.6 ± 4.89
Pineapple Soda 37.4 ± 7.21 37.7 ± 7.37* 15.1 ± 2.64 15.1 ± 2.68 22.3 ± 4.59 22.6 ± 4.77
Pineapple Diet
Soda 37.3 ± 7.03 37.5 ± 7.22* 15.0 ± 2.60 15.1 ± 2.63 22.2 ± 4.45 22.5 ± 4.61 Table 3. Hydration Status values for each preload condition.
Table 4 expressed the glycaemia and plasma osmolality at the beginning of the trial and at the pre-lunch evaluation. There was a clear decrease in osmolality values over time [F (1, 22) = 25.7; P<0.001], with T-test revealing differences between this two moments for all beverages (W, P=0.001; PS, P=0.002; PDS, P=0.039). No difference between beverages was noticed [F (2, 44) = 0.19; P=0.83] nor interaction between beverage*time [F (2, 44) = 0.79; P=0.46] or beverage*sex [F (2, 44) = 1.13; P=0.33]. Thus, despite the different osmolality values between beverages, in this trial, their impact on plasma osmolality was similar.
Regarding glycaemia, it was observed a significant effect of time on its decrease [F (1, 22) = 18.1; P<0.001]. A significant interaction beverage*time [F (2, 44) = 6.28; P=0.004] was found, indicating that in PS condition, the decrease in glycaemia was more pronounced than in the other two bev-erages as we can see by “P” values of T-Test: (W, P=0.03; PS, P<0.001; PDS, P=0.03).
Preload Condition Osmolality (mOsm/Kg) Glycaemia (mg/dl)
Initial Final* Initial Final+
Water 313 ± 14.3 299 ± 8.86 86.0 ± 6.98 82.5 ± 6.58
Pineapple Soda 311 ± 10.8 303 ± 8.25 87.5 ± 9.08 77.3 ± 9.79
Pineapple Diet Soda 310 ± 13.9 301 ± 16.1 85.6 ± 6.90 82.8 ± 7.82
Table 4. Glycaemia and plasma osmolality values for each preload condition. * - P < 0.001 vs. Initial Osmolality
+ - P < 0.001 vs. Initial Glycaemia
Beverage Acceptability and Water Intake
Table 5 shows hedonic ratings of the three beverages with a main effect of beverage type [F (1.34, 29.4) = 52.2; P<0.001]. Bonferroni comparisons showed a difference between water and the other beverages (P<0.001).
Preload Beverage Acceptability Water Ingestion
(1-9) mL
Water 4.4 ± 1.7*,+ 192 ± 122
Pineapple Soda 7.0 ± 1.1 256 ± 173 Pineapple Diet Soda 6.8 ± 1.1 225 ± 133
Table 5. Beverage Acceptability and Water ingestion at Lunch * - P<0.001 vs. PS
+ - P<0.001 vs. PDS
Regarding the amount of ad libitum water intake at lunch for each preload condition, there was a main effect of beverage type [F (2, 44) = 3.62; P=0.04], although the pairwise comparison re-vealed a non-significant difference between W and PS (P=0.087). Even so, a tendency to a higher ingestion of water at lunch was observed in PS condition face to W condition.
Energy, sugar, caloric beverages and total fluid intake throughout the day
Table 6 shows the energy, sugar, caloric beverages and total fluid intake after lunch and until the end of the day. The three beverages led to similar energy intake [F (2, 44) = 0.45; P=0.64]. Regarding sugar intake, the higher values seen after the ingestion of sugary preload does not have statistical significance [F (2, 44) = 1.57; P=0.22]. The caloric beverages intake revealed a significant beverage*sex interaction [F (2, 44) = 3.39; P=0.043]. Analyzing the data separately by sex, a main-effect of beverage was observed in men [F (2, 24) = 3.42; P=0.049], but pairwise comparisons failed to detect a difference between PS and W (P=0.305) and PS and PDS (P=0.111). The volume of all fluids ingested was also higher in PS condition, although no main effect of bev-erage was observed [F (1.76, 38.6) = 1.52; P=0.232].
Preload Energy Sugar Caloric Beverages Total Fluid
kcal g ml ml
Water 1377 ± 528 64.1 ± 36.5 296 ± 253 585 ± 515 Pineapple Soda 1488 ± 607 81.9 ± 54.2 426 ± 391 692 ± 467 Pineapple Diet Soda 1385 ± 611 66.4 ± 34.8 293 ± 218 495 ± 368 Table 6. Energy, Sugar, Caloric Beverages and Total Fluid Intake after ingestion of the preloads
Discussion
The main findings of this study were: 1) All beverages had a similar effect on thirst sensation, hydration status and plasma osmolality values; 2) Sweetened preloads led to lower hunger scores than water; 3) Pineapple soda promoted a more accentuate decrease in glycaemia values. A ten-dency to higher water ingestion in subsequent meal and higher energy, sugar and caloric bev-erages intake throughout day was also observed with sugary preload compared with water and diet soda.
The few studies that investigated the relationship between thirst and caloric beverages intake revealed a large inconsistency. Almiron-Roig et al [3] did not find differences in thirst sensation
in the 2 hours following the intake of a chilled 590ml preload of either orange juice, low-fat milk (1%), regular cola or sparkling water. However, when data was analyzed separately for gender, water and orange juice satisfied thirst better than did the cola beverage among women, with the juice having less sugar (55g vs. 76.6g) than cola. Even so, water and 1% milk, the two beverages with less sugar (0g and 29.1g respectively) did not led to lower thirst ratings than the other two. A contradictory finding was described by Della Valle et al [4], with thirst ratings being lower after
the consumption of 360g of chilled diet cola (40g sugar) than after the consumption of the same amount of orange juice (38g sugar) or 1% milk (18g sugar). Nevertheless, in this study the bever-ages were consumed with an ad libitum lunch, so it is very difficult to interpret the isolated effect
of beverage on thirst with this kind of protocol. Another study from Tsuchiya et al [8], described
lower ratings of thirst with 400ml fruit drink (50g sugar) and dairy fruit drink (46.5g sugar) than the less sugary 378g liquid and semi-solid yogurts (both with 32.1g sugar). In study of Monsivais
et al [5], no differences in thirst ratings were observed between 495ml of 1% milk (27.2g sugar),
475ml of diet cola (0g sugar) and 3 sugar sweetened colas with different formulations: 525ml sucrose cola (54.7g sugar), 475ml high-fructose corn syrup with 42% fructose (57.3g sugar) and 525ml high-fructose corn syrup with 55% fructose (57.7g sugar). Only one study [7] reported a
less effective capacity of sugary lemonade (20g sugar) to satisfy thirst compared to water and aspartame sweetened lemonade (0g sugar), when these beverages were ingested with a meal and in a small portion (≈ 237 ml). However, these differences were less pronounced when the beverag-es were consumed as preloads and with a larger preload volume (≈ 473 ml), which corrbeverag-esponded to a greater amount of sugar (40g). Thus, with this lack of coherence between all these trials, we can conclude that a direct link between the amount of sugar in a beverage and a positive impact in thirst sensation cannot be established.
It should be mentioned that the main aim of all these cited studies was to investigate the role of sugars and caloric beverages in satiety and subsequent energy intakes, so, their design was not specifically appropriate to analyze the impact of these beverages and their sugar content in thirst sensation. For instance, the amount of fluid ingested (an indirect method to evaluate thirst sen-sation) in the subsequent meal was recorded but the amount of food available was indiscriminate which is a strong constraint to a correct interpretation of the results.
Thus, with a research protocol designed specifically to evaluate thirst sensation and fluid intake, our results are according with the literature that reveal a lack of effect of sugar content of a bev-erage and thirst. There is a variety of physiological stimuli for thirst sensation, such as variations on plasma osmolality, blood volume, blood pressure and hormonal release (e.g. angiotensin, ADH)
[12], but no physiological link between sugar and thirst was described in healthy subjects. The
assumption of the theory that the ingestion of sugary beverages results in an increased sensation of thirst due to their hyper osmolality relative to blood is somehow an academic hypothesis. In our study, although osmolality of PS (409 mOsm/kg) was higher than initial plasma osmolality (311 mOsm/ kg), it led to a decrease in these values in the final evaluation (303 mOsm/kg). Besides that, no differences in plasma osmolality and thirst sensation ratings were noticed between PS and other two hypo-osmolar beverages. Plasma osmolality is also very sensitive to changes in sodium concentration, the main cation in extracellular fluids [13]. PS had a much lower sodium
concentration (1.18mEq/l) than normal blood sodium levels (135-145 mEq/l), which can explain, at least in part, the lack of effect of this beverage on thirst even though it is hyperosmolar compared to blood. It must be also recognized that even with the absence of effect on thirst sensation, PS revealed a tendency to higher ad libitum water ingestion in subsequent meal compared to wa-ter preload (P=0.09) and promoted a more accentuated decrease in glycaemia. Excessive thirst is one of the classical symptoms of untreated/uncontrolled diabetic patients since the extreme values of blood sugar induce a state of hyperosmolality. Thus, in people with diabetes or other disease that cause an impairment in sugar metabolism, the intake of sugary beverages could (beyond other disadvantages) increase thirst as a reflex of augmented osmolality. However, in
healthy subjects, in response to a high sugar load, more insulin is produced in order to reestablish glycaemia values into their physiological narrow. Since we observed a greater decrease in glycae-mia with the sugary preload, this fact can be explained by a higher insulin response. This could also provide an explanation for the lack of effect that this hyperosmolar beverage had on thirst and plasma osmolality, since glucose contributes to plasma osmolality and this higher decrease in blood sugar levels could balance a hypothetical short-term increase in osmolality in reaction to sucrose-sweetened soda.
There are some other causes that can provide an additional explanation of these results such as the non-physiological stimulus that encompass the ingestion of beverages. Their physical and chemical characteristics may explain the observed lack of effect of sugar and beverage’s sweet-ness in thirst sensation. At this level, beverage temperature has a role in thirst suppression, with cold beverages being more effective [14-16], perhaps due to a greater increase in saliva
pro-duction with consequent decrease in mouth dryness [17] and for their higher reward effect and
relief for thirst [18]. As in other studies, beverages in our trials were served at a low temperature
(8 – 10ºC), that reflects the usual way of consumption of soft drinks. Beverage carbonation has also been described as a sensory thirst-quenching property in beverages [19]. However, a study [6] that measured directly the impact of beverage carbonation on thirst did not confirm this
as-sumption. Nevertheless, the beverages in our study were decarbonized to withdraw this effect, and also because there are non-carbonated soft drinks available. Regarding acidity, if sweetness is perceived as low thirst-quenching property, acidity has an inverse role being one of the most thirst-quenching properties described [20] mostly due to their direct relationship with saliva
pro-duction [21]. In our study the two sodas had a lower pH than water (W: pH = 5.8; PS: pH = 3.5; PDS:
pH = 3.8) which could be another reason for the lack of effect of beverage sweetness and sugar content on thirst. Since the discover of osmoreceptors and the role of hypothalamus paraventric-ular and supraoptic nuclei on thirst with the release of vasopressin in blood stream, some authors consider that this “dry mouth theory” is somehow outdated [22, 23]. However, these
osmore-ceptors detect variations in plasma osmolality [24, 25] and regarding this parameter there were
no differences between the three beverages studied. Therefore, the peripheral stimuli to thirst, namely beverage properties and environmental factors, such as social expectancy or expected sensory stimulation [1], cannot be discarded in this analysis.
Although the effect of beverages on thirst related variables was the main objective of our study, other interesting results were also observed. An increase in hunger ratings was observed with W preload compared to PS and PDS. Additionally, a higher energy, sugar and caloric beverages intake throughout day was seen after PS preload but without statistical significance. The majority of the studies with similar design did not observed differences in hunger between caloric bev-erages [3-5], but higher hunger scores after water intake compared to other caloric beverages
has already been described [3]. This lack of differences between sugary and artificial sweetened
preloads on hunger ratings does not corroborate their reported effects on satiety. On one hand, sucralose has already demonstrated to be one of the artificial sweeteners more able to induce cholecystokinin (CCK) and glucagon-like peptide-1 (GLP-1) secretion in cell lines [26]. On the
of satiety hormones like insulin, GIP and GLP-1, face to sugar is well described [27, 28].
Further-more, when we analyzed the nutritional intake throughout the day, we could observe that when participants drank a sugary morning preload, they tended to eat more calories, sugars and drink more caloric beverages, with a total absence of energy compensation.
Some limitations have to be pointed in this study. The ingestion of 500ml of water on the eve-ning before and on the moreve-ning of the trial, used to ensure a euhydration status could be seen as excessive and potentially attenuate differences in thirst. However, even with this procedure, we could notice that baseline plasma osmolality values were still increased (310 - 313 mOsm/Kg) compared to their physiological range (280 – 300 mOsm/Kg). So, it is unlikely that this recom-mendation may have affected our results. Similarly, a 500 ml preload may not be a physiological load and could have masked some differences in thirst sensation. Nevertheless, similar or even higher preload volumes were used in other studies [3-5, 29]. Moreover, the fluid portions were
not adjusted to the same amount of water, with sugar replacing 5.5 g of water in PDS and 55g in PS; however this issue always occurs when beverages are consumed in a standardized portion. Additionally, the BIA method is not considered the gold standard to assess intracellular and ex-tracellular water, nevertheless, the variation in hydration status was not the main aim of the study.
Conclusions
In summary, water, sugar and artificial sweetened beverages matched on volume did not differ in their effects on thirst, desire to drink, mouth dryness and osmolality values. Our data provide no support for the hypothesis that sugary or sweet beverages increase thirst sensation due to the increasing of blood osmolality values. However, there was a tendency to a decreased glycaemia and an increased water intake at the subsequent meal when the sugary sweetened soda was the preload beverage.
Acknowledgments
We thank to all participants of the study and to the Portuguese Institute of Hydration and Health for the financial support.


![Table 5 shows hedonic ratings of the three beverages with a main effect of beverage type [F (1.34, 29.4) = 52.2; P<0.001]](https://thumb-eu.123doks.com/thumbv2/123dok_br/15912041.1092794/48.892.151.639.809.931/table-shows-hedonic-ratings-beverages-main-effect-beverage.webp)


