• Nenhum resultado encontrado

Insurance Fraud Detection - Using Complex Networks to Detect Suspicious Entity Relationships

N/A
N/A
Protected

Academic year: 2021

Share "Insurance Fraud Detection - Using Complex Networks to Detect Suspicious Entity Relationships"

Copied!
153
0
0

Texto

(1)

Licenciatura em Ciências da Engenharia Electrotécnica e de Computadores

Insurance Fraud Detection - Using Complex

Networks to Detect Suspicious Entity

Relationships

Dissertação para obtenção do Grau de Mestre em

Engenharia Eletrotécnica e de Computadores

Orientador:

João Paulo Branquinho Pimentão, Professor Auxiliar,

Universidade Nova de Lisboa

Co-orientador:

Pedro Alexandre da Costa Sousa, Professor Auxiliar,

Universidade Nova de Lisboa

Júri

Presidente:

Rodolfo Alexandre Duarte Oliveira, Professor Auxiliar, FCT - UNL

Arguente:

João Almeida das Rosas, Professor Auxiliar, FCT - UNL

(2)
(3)

Suspicious Entity

Relationships

Copyright © João Marques Paredes Mouco, Faculty of Sciences and Technology,

NOVA University Lisbon.

The Faculty of Sciences and Technology and the NOVA University Lisbon have

the right, perpetual and without geographical boundaries, to file and publish this

dissertation through printed copies reproduced on paper or on digital form, or

by any other means known or that may be invented, and to disseminate through

scientific repositories and admit its copying and distribution for non-commercial,

educational or research purposes, as long as credit is given to the author and

editor.

Este documento foi gerado utilizando o processador (pdf)L

A

TEX, com base no template “novathesis” [1] desenvolvido no Dep. Informática da FCT-NOVA [2].

[1] https://github.com/joaomlourenco/novathesis

[2] http://www.di.fct.unl.pt

(4)
(5)
(6)
(7)

I would like to start by thanking my two advisors on this journey, Professor João

Paulo Pimentão and Professor Pedro Sousa. It was thanks to them that I found my

passion for data science and everything I know today is because of them. I would

also like to thank them for providing me the facilities of Holos for me to work on.

It was a great work environment full of great people. On this note, I would also

like to thank Professor Sérgio Onofre for always being in a good mood and for

reminding me that my Mackintosh is not good at least 27 times a day, and also

João Lisboa, for being one of the most knowledgeable people I ever met. With

him in the room, no day was ever a sad day.

I want to thank my parents and grandparents for all the support they could

ever give me. They supported me every step of my journey since coming to the

university, I could not be here without them. I truly believe I lived up to their

expectations and I hope they have pride in me. Thank you so much. I would

also like to thank my godmother for opening up her home to me in these past six

years and putting up with me. I hope I was a good "son" to you. Thank you for

everything.

I want to thank all my friend, the ones that came with the university but also

the ones that I left back home in Santarém. I want like to give my special thanks

to Diogo, Pedro, Francisco, Nelson and Zuka for letting me "leech" information

from them (I wont go in detail here), to Jardas and Filipa for those all-nighters

we pulled of during the writing of our dissertations, to Gaita and Kiko for being

with me from day one in this journey, and to Kobaim and Patchon for not letting

me forget where I come from and being there for me when I needed the most. I

would like to give my special thanks to Arsénio for being with my in this journey

across the vast world of data science. Really really thank you.

Finally, I would like to thank Joana, my girlfriend. Without her I would not

the person I am today. She made me grow in every sense of the word. Thank you

for you unconditional support, courage and love. You were there for me in the

most difficult times and for that, I truly thank you from the bottom of my heart.

(8)
(9)

to lose sight of the shore"

Christopher Columbus

(10)
(11)

The insurance industry is undoubtedly one of the main drivers of today’s

economy and certainly will be so for the foreseeable future. This is derived from

a basic need every person has, and that is to have financial and personal safety.

Despite all this, some entities try to induce fraud on their policies or to

cir-cumvent some legal mechanics, to gain unlawful benefits and advantages. This

being said, insurance fraud constitutes a grave downside to insurance companies

as it directly translates to a loss of economical assets as well as the opportunity to

establish a precursor to further exploitation of the system in place.

In this context, this dissertation proposes a framework to help detect the most

common types of insurance fraud and scam. Most of the times, insurance scams

are usually detected after they took place, this means the companies are already

at a loss when they detect it. This framework, which is based upon complex

net-works for relationship visualization, takes into consideration the relationships

already in place between the different entities of the insurance hub-world,

ad-vises the responsible entities for fraud prosecution on suspicious relationships.

This way, frauds and scams can be detected early on, thus minimizing the losses

associated.

This dissertation is being supported by at Holos, S.A using the online

insur-ance management tool, also known as RIFT. This tool gathers data from actual

insurance companies, giving the study a higher degree of veracity and

applicabil-ity in the real world.

Keywords:

Insurance fraud, Machine learning, Knowledge discovery, Complex

networks

(12)
(13)

A indústria dos seguros é, sem dúvida, uma das principais impulsionadoras da

economia atual e certamente o será para um futuro próximo. Isto é derivado de

uma necessidade básica que todas as pessoas têm, e isso é ter segurança financeira.

As apólices de seguro são uma das ferramentas mais importantes para o controlo

de danos que uma pessoa ou entidade pode ter em sua posse.

Apesar de tudo isto, algumas entidades tentam induzir fraudes nas suas

apó-lices, para obter benefícios e vantagens não contempladas pela lei. Dito isto, a

fraude em seguros constitui uma grave desvantagem para as companhias de

se-guro, uma vez que se traduz diretamente numa grande perda de ativos

econó-micos, bem como a oportunidade de estabelecer um precursor para uma maior

exploração do sistema.

Neste contexto, esta dissertação propõe uma estrutura para ajudar a detetar

os tipos mais comuns de fraude. Na maioria dos casos, fraudes de seguros são

detetadas depois de ocorrerem, o que significa que as empresas já estão em perda

quando detetam a fraude. Esta estrutura, que é baseada em redes complexas para

visualização de relações, toma em consideração as relações já existentes entre as

diferentes entidades do mundo dos seguros e aconselha as entidades responsáveis

pela regularização e auditoria em seguros, sobre relações suspeitas entre

entida-des. Desta forma, as fraudes podem ser detetadas precocemente, minimizando as

perdas associadas.

Esta dissertação está a ser realizada em cooperação com Holos, S.A usando a

sua ferramenta de gestão de seguros on-line, também conhecida como RIFT. Esta

ferramenta regista dados pertencentes a seguradoras, conferindo ao estudo maior

grau de veracidade e aplicabilidade no mundo real.

(14)
(15)

List of Figures

xix

List of Tables

xxiii

Listings

xxv

Acronyms

xxvii

1 Introduction

1

1.1 Context and Motivation . . . .

1

1.2 The Problem . . . .

3

1.3 Proposed Solution . . . .

4

1.4 Contributions . . . .

4

1.5 Outline of the Document . . . .

5

2 State of the Art

7

2.1 Conventional methodologies for fraud detection . . . .

7

2.1.1 Prevention and detection - Insurance Company level . . . .

8

2.1.2 Anti-fraud alliances . . . .

10

2.2 Machine Learning Methods . . . .

11

2.2.1 Data Preparation

. . . .

11

2.2.1.1

Extract, Transform and Load . . . .

11

2.2.2 Data Mining Methodologies . . . .

14

2.2.2.1

Cross Industry Standard Process for Data Mining .

14

2.2.2.2

Sample, Explore, Modify, Model and Assess . . . .

17

2.2.2.3

Knowledge Discovery in Databases . . . .

18

2.2.2.4

Overview on CRISP-DM, SEMMA and KDD . . . .

20

2.2.3 Machine Learning Algorithms . . . .

20

2.2.3.1

Clustering . . . .

20

2.2.3.2

Artificial Neural Networks . . . .

22

(16)

2.2.4 Overview on Machine Learning Algorithms . . . .

27

3 Complex Networks

31

3.1 Complex Systems . . . .

32

3.2 Network Theory . . . .

36

3.3 Graph Theory . . . .

38

3.3.1 Types of Graphs . . . .

39

3.4 Network Scale Measures . . . .

40

3.5 Structural vs. Functional Networks . . . .

41

3.6 Network Metrics . . . .

42

4 Data Engineering

45

4.1 Data Source . . . .

45

4.2 Desired Structure . . . .

46

4.3 Used Frameworks . . . .

47

4.3.1 Python . . . .

47

4.3.2 SQLDeveloper . . . .

50

4.3.3 Pentaho Data Integration . . . .

51

4.3.3.1

Transformation - Edges File . . . .

54

4.3.3.2

Transformation - Nodes File . . . .

55

4.3.3.3

Wrapping Up with Jobs . . . .

56

4.3.4 Comparison between Frameworks . . . .

56

4.3.4.1

Complexity Comparison . . . .

57

4.4 Data File Structure and Analysis . . . .

58

4.4.1 File Dissection -

Edges.csv

. . . .

59

4.4.2

File Dissection -

Nodes.csv . . . .

59

5 Complex Network Framework and Result Analysis

61

5.1 Frameworks . . . .

61

5.1.1

Networkx . . . .

62

5.1.2

Gephi . . . .

64

5.1.3

Cytoscape . . . .

66

5.1.4

Overview on the Frameworks Used . . . .

68

5.2 Results and Discussion . . . .

69

5.2.1 First Stratification (Node Degree = 1) . . . .

70

5.2.2 Second Stratification (Node Degree = 2) . . . .

71

5.2.3 Third Stratification (Node Degree = 3) . . . .

73

5.2.4 Fourth Stratification (Node Degree = 4) . . . .

74

(17)

5.2.6 Sixth Stratification (Node Degree = 6) . . . .

79

5.2.7 Seventh Stratification (Node Degree = [7;8]) . . . .

80

5.2.8 Eighth Stratification (Node Degree = [9;10]) . . . .

82

5.2.9 Final Stratification (Node Degree > 10) . . . .

83

5.2.9.1

High Risk of Fraudulent Practices . . . .

86

5.3 Final Thoughts on the Insurance Network Analysis . . . .

90

6 Conclusions and Future Work

93

6.1 Conclusions

. . . .

93

6.2 Future Work . . . .

98

Bibliography

101

I

Structural Analysis of Data Input Sources

109

I.1

CSV File Structure . . . 109

I.2

Relational Database . . . 110

II Python Code for ETL Purposes

115

III Pentaho Data Integration Transformation and Job Files

117

(18)
(19)

2.1 Survey performed upon Australian organizations identifying basic

fraud control and prevention techniques by

PricewaterhouseCoopers

Economic Crime Survey 2007 [12]

. . . .

8

2.2 Descriptive figure depicting the ETL process from left to right. DWH

stands for a data storage solution which is not relevant to be addressed. 13

2.3 Descriptive image depicting the ELT process from left to right. . . . .

14

2.4 The CRISP-DM reference model. . . .

15

2.5 The Sample, Explore, Modify, Model and Assess (SEMMA) reference

model. . . .

17

2.6 Descriptive image depicting the Knowledge Discovery in Databases

(KDD) process. . . .

19

2.7 Architectural design of an artificial neuron. . . .

23

2.8 Schematic representation of the back-propagation algorithm. . . .

24

2.9 Representation of a binary decision tree. . . .

26

3.1 Image representing the Königsberg 7 bridge’s problem. The objective

is to design a route which passes through all seven bridges (green

colored) once and only once. . . .

37

3.2 Examples of three types of different graphs . . . 39

4.1 Examples of simple Dataframes (left) and Series (right) . . . .

48

4.3 Visual depiction, using Venn Diagrams, of the different kinds of join

operations. From left to right; Inner Join 4.2a, Left Join 4.2b, Right

Join 4.2c and Full Outer Join 4.2d . . . .

49

4.4 Simple transformation environment possessing an input (Table file)

and an output (XML file) . . . .

52

4.5 Simple job environment possessing a create file operation followed by

a transformation. This transformation is then checked for the validity

of its output file. . . .

53

(20)

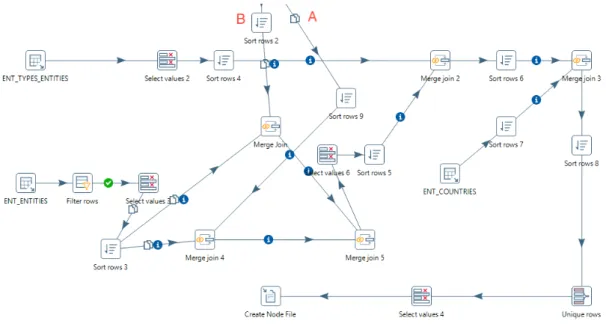
4.6 Pentaho Data Integration (PDI) schematic depicting the final

transfor-mation used for Extract, Transform and Load (ETL) purposes. It can

be viewed further in-depth at III.1 . . . .

54

4.7 Transformation schematic that originates the

Edges.csv file. . . .

55

4.8 Transformation schematic that originates the

Nodes.csv file. . . .

56

5.1 Karate’s club network showing all the connections between elements

from the club. . . .

62

5.2 Gephi’s interface window showing the graph regarding the insurance

network. . . .

64

5.3 Force Atlas algorithm applied to the Quaker Network data. . . .

65

5.4 Properties menu for the edges of the network. . . .

66

5.5 Web interface exported from Cytoscape. . . .

68

5.6 From left to right, a case where every relationship is deemed normal,

two abnormal connections and a strange relationship . . . .

71

5.7 Relationship between entities showing signs of polygamy. . . .

72

5.8 Three companies relating to the same employee as contact entity. . . .

73

5.9 From left to right, three companies which have the same entity labeled

as

Individual as contact entity, one company with three individuals as

contact entities . . . .

74

5.10 On the left figure, a case where the nodes present a layout which is to

be expect whilst on the right, the layout has an abnormal structure. .

75

5.11 Relationships depicting a deviant layout behavior. . . .

76

5.12 Depiction of abnormal relationships between a company and its

em-ployees. . . .

76

5.13 Depiction of two similar connections between the same entities . . . .

78

5.14 Unusual ownership ring between six different companies . . . 78

5.15 Unusual cluster formed from interpersonal relationships

. . . .

79

5.16 Ring of entities connected by marital relationships . . . .

81

5.17 Seven companies which have the same contact entity as an insurance

company’s employee

. . . .

81

5.18 Three

Individual entities that have marriage relationships between them 82

5.19 One main entity with many connections of parental and marital types

83

5.20 Entity labeled as

Other which only appears once in the entire network

84

5.21 Strange cluster layout where an entity has three parenthood

relation-ships

. . . .

85

(21)

5.23 First example of a cluster having high probability for fraudulent

prac-tices . . . .

87

5.24 Second example of a cluster having high probability for fraudulent

practices . . . .

88

5.25 Third example of a cluster having high probability for fraudulent

prac-tices . . . .

89

5.26 The network is composed of 100 nodes, single links are added with

hopping probability p=0.1 [73] . . . .

90

5.27 Bar plot representing the evolution of the number of edges and nodes

according to the stratification . . . .

91

6.1 Descriptive image depicting the KDD process. . . .

93

6.2 Flowchart depicting the practical approach of this dissertation . . . .

97

I.1

Depiction of an example of a csv file when read with a common text

editor. In this case, instead of commas, semicolons are used, which are

also a valid example of a csv accepted delimiter. . . 110

I.2

Model representation of a one-to-one relationship. . . 112

I.3

Model representation of a one-to-many (or many-to-one) relationship. 112

I.4

Model representation of a many-to-many relationship. . . 113

III.1 PDI schematic depicting the final transformation used for ETL

pur-poses. . . 118

III.2 PDI schematic depicting the final job used for ETL purposes. . . 119

IV.1 Overview of the final insurance network produced using Cytoscape . 122

IV.2 Depiction of the stratification based on the node degree (Degree = 1) . 123

IV.3 Depiction of the stratification based on the node degree (Degree = 2) . 123

IV.4 Depiction of the stratification based on the node degree (Degree = 3) . 123

IV.5 Depiction of the stratification based on the node degree (Degree = 4) . 124

IV.6 Depiction of the stratification based on the node degree (Degree = 5) . 124

IV.7 Depiction of the stratification based on the node degree (Degree = 6) . 124

IV.8 Depiction of the stratification based on the node degree (Degree = [7, 8]) 124

IV.9 Depiction of the stratification based on the node degree (Degree =

[9, 10]) . . . 124

IV.10Depiction of the stratification based on the node degree (Degree > 10) 125

(22)
(23)

2.1 Summary of the features between KDD, SEMMA and Cross Industry

Standard Process for Data Mining (CRISP-DM) . . . .

20

2.2 Comparison between the characteristics of machine learning methods.

Key:

s

= good;

u

= fair;

t

= poor. . . .

28

3.1 Examples of the relationship between different systems and their

cor-responding emergences . . . .

33

3.2 Different types of scales regarding the study of complex networks [52] 41

3.3 Some of the most relevant metrics regarding complex networks [52]. .

43

4.1 Description of the Insurance_claims.csv file used as a stress test to

Python’s capability to deal with large datasets . . . .

57

4.2 Description of the Insurance_claims.csv file used as a stress test to

Python’s capability to deal with large datasets post transformation . .

57

5.1 Results from the application of the metrics described to the Zachary’s

Karate Club Network . . . .

63

5.2 Color coding of the relationships present in the network. Note that the

color schema may differ from the one used in the software as the color

spaces of Red, Green and Blue (RGB) codes may also differ. . . 67

5.3 Color coding of the nodes present in the network. Note that the color

schema may differ from the one used in the software as the color spaces

of RGB codes may also differ. . . 67

5.4 Comparison between the different frameworks for complex network

creation. Key:

s

= good;

u

= fair;

t

= poor. . . .

69

5.5 The number of entities and connections present in the first stratification. 70

5.6 The number of entities and connections present in the second

stratifi-cation. . . .

72

5.7 The number of entities and connections present in the third

(24)

5.8 The number of entities and connections present in the fourth

stratifi-cation . . . .

74

5.9 The number of entities and connections present in the fifth stratification 77

5.10 The number of entities and connections present in the sixth

stratifica-tion . . . .

79

5.11 The number of entities and connections present in the seventh

strati-fication . . . .

80

5.12 The number of entities and connections present in the eighth

stratifi-cation . . . .

82

5.13 The number of entities and connections present in the final stratification 83

III.1 Table depicting all the possible relationships (and inversely the inverse

(25)

2.1 K-Means Clustering Algorithm in pseudo-code [1] . . . .

22

2.2 Back-propagation Algorithm in pseudo-code [2] . . . .

25

2.3 Random Forest Algorithm in pseudo-code [3] . . . .

27

4.1 Coding example of the creation of a Series in Python . . . .

48

4.2 Coding example of the creation of a Dataframe in Python . . . . .

48

4.3 Coding example for creating a view answering the problem above

51

5.1 Coding example of the creation of Zachary’s Karate Club network

using Networkx . . . .

62

II.1 Python code used for ETL purposes. This was achieved using

(26)
(27)

ANN

Artificial Neural Networks.

API

Application Programming Interface.

APS

Associação Portuguesa de Seguradores.

CRISP-DM

Cross Industry Standard Process for Data Mining.

CSV

Comma Separated Values.

DMS

Distributed Manufacturing System.

EDA

Exploratory Data Analysis.

ELT

Extract, Load and Transform.

ETL

Extract, Transform and Load.

KDD

Knowledge Discovery in Databases.

OECD

Organization For Economic Co-Operation And Development.

OS

Operating System.

PDI

Pentaho Data Integration.

RGB

Red, Green and Blue.

SAS

Statistical Analysis System.

SEMMA

Sample, Explore, Modify, Model and Assess.

SQL

Structured Query Language.

(28)
(29)

C

h

a

p

t

1

I n t r o d u c t i o n

This is the introductory chapter of this dissertation. The reader

will be exposed to the context of this work, as well as the motivation

behind it’s research and development in Section 1.1. On Section 1.2

an elaborated explanation will, once more, expose the reader to the

details of the problem spotlighted, and highlight which are the main

benefits achieved by solving and answering it’s intrinsic questions.

Furthermore, Section 1.3, will give a generic answer to the problem

stated in the previous section. On Section 1.4 the contributions or key

takeaways to the industry will be discussed. Lastly, Section 1.5, will

present the base outline of the remaining chapters of this document.

1.1

Context and Motivation

The insurance industry is undoubtedly one of the main drivers of today’s economy

and certainly will be so for the foreseen future. This is derived from a basic

need every person has, and that is to have safety, or at the very best, to feel

safe. Insurance Policies are one of the most important tools for damage control a

person, or entity, can have in their possession. They are the result of a previous

agreement between two consenting parties, one being the insured and the other

being the insurance company. In their essence, insurance policies are the contract

themselves, in which the risks the insured is covered from and how much the

person or entity will pay for those services, also known as premium is specified.

Depending on what’s being insured the premium can be higher or lower.

(30)

There are two main areas that stem from the school of thought regarding

insurance. The first one is life related polices, and the second one is regarding all

the other types of insurance, also known as non-life policies [4]. Life insurance

policies, as the name implies, cover the policyholder from life threatening events,

being the most common one death. Non-life policies, regard all the other kinds

of insurance policies that don’t fall under the category mentioned before. These

possess a wide range, being the automobile, housing and health types the most

common (these types of policies are usually mandatory by law, depending on

the country) [5]. Life Insurance, according to the Organization For Economic

Co-Operation And Development (OECD), represent roughly 59.6% of all insurance

policies performed in Portugal regarding the period of 2016. The remainder,

obviously relates to the non-life insurance policy types [6].

Technological innovation has always been at the core for social, economical

and personal evolution. In the beginning, for mankind, technology was

com-prised of small yet big discoveries and inventions that made society what it is

today. Nowadays, technological breakthroughs don’t have the same impact as

they had in the beginning. They serve as drivers for the enhancement of systems

already implemented and running. With this though in mind, the evolution of

data mining techniques serves as the catalyst for new ways to see the world. These

new approaches enable the discovery of overlooked knowledge, most of the times

already present on the data possessed by the companies.

With this in mind, and seeing that we live in an era of data abundance and an

ever-growing data integration in every industry, there is a pressing demand for

methods that can analyze and extract knowledge from all this data. With

infras-tructures like so, it is possible to use data prediction and knowledge discovery

techniques not only to detect anomalies, but also to maximize several

parame-ters and features deemed of importance by the companies. Such sensibility to

these opportunities will undoubtedly lead to a better understanding of how the

data can help to predict uncommon events such as insurance frauds and scams,

leading to a better exploitation of the company’s tangible (infrastructures, people,

economical resources) and intangible assets (reputation, experience, intellectual

property) [7].

In this context, Holos, S.A. has an ongoing product which, in its essence,

is an insurance management solution denominated RIFT Insurance Tool. The

main objective of RIFT is to allow customers, people or companies, to manage (in

every sense of the word) their insurance policies. Albeit private, a non-disclosure

agreement was performed in order to extract customer information and data from

the databases which support this online tool, in order to manipulate and perform

(31)

knowledge discovery techniques upon them. These procedures will be further

explored in the following chapters of this dissertation. With this partnership, it

was possible to use real life user databases, and to test upon them the models

described on 1.3, enabling then the opportunity to assess how these models work

on live data, giving a more solid foundation to the concluded hypothesis.

1.2

The Problem

One of the major issues that plagues the insurance industry is fraud. Insurance

fraud can take many forms, ranging from external to internal, soft and/or hard,

underwriting or claim. Internal fraud is committed by the insurance company

or entity itself, while the external fraud is employed by the policyholders. One

type of the internal variant is the embezzlement of funds, while, on what regards

external fraud, there is the submission of fraudulent claims. Soft fraud refers to

the kind of fraud originated in opportunistic behavior of normally honest people,

whilst hard fraud falls in the category of a premeditated action[8]. Lastly frauds

can be committed both at underwriting or claim phase. Underwriting refers to

the omission of information to obtain dishonest advantages. Claim refers to the

deliberately create false or fictitious claims about the events that triggered the

insurance.

According to W. Steve Albrecht, one of the authors of Fraud Examination

[9], it is even easier to commit fraud with the help of technology as it ever was:

"With the advent of computers, the Internet, and complex accounting systems,

employees now need only to make a telephone call, misdirect purchase invoices,

bribe a supplier, manipulate a computer program, or simply push a key on the

keyboard to misplace company assets".

The way toward identifying and forestalling insurance fraud can be

exception-ally challenging because of the qualities and nature of fraud. Figuring the genuine

expenses of the premise for organizations and enterprises is an impressive

assign-ment on account of the stealthy idea of fraud [10]. The recognized fraud cases

speak to just a "hint of a greater challenge" of the considerable number of

un-lawful practices that go unnoticed [9]. What’s more, fraud can be exceptionally

mind-boggling and has some temporal characteristics and patterns that need to

be discussed [11].

Hereupon, this dissertation addresses possible solutions to the problem

men-tioned above and practical, cost effective and most of all precise, ways to

imple-ment the solutions imple-mentioned on 1.3.

(32)

1.3

Proposed Solution

To solve the problem of insurance policy fraud and profit deficit, the proposed

so-lution is comprised of a set of knowledge discovery techniques based on complex

networks for pattern and outlier analysis. These types of networks will allow the

users to visualize relationships between different entities and provide insights on

fraudulent behaviors. To accomplish the correct employment of these

methodolo-gies, the data underwent a process of data engineering following strict guidelines

that rule over data mining problems.

The final framework will enable the user to fetch, directly from a relational

database, data and pipeline it to a software that will build the complex network.

After this is done, the user has the freedom to explore the network using a web

app interface, giving then the opportunity for a system agnostic solution.

1.4

Contributions

The main contribution of this dissertation is clearly the methodology from which

Pentaho and Cytoscape emerged as the better tools to streamline the whole data

mining process when studying the possibility of fraudulent entities and

relation-ships in the dataset. There was an extensive trial and error process behind the

choosing of these tools, as it came to light that, when dealing with large

quan-tities of data, hardware and therefore software plays a big role on the overall

performance and reproducibility of the overall process.

With the study of complex networks, another contribution for this

disserta-tion is the applicadisserta-tion of a "still not that big of a player" methodology on the data

mining playing field. Complex networks have been used for biology and

chem-istry investigative problems for so long, but only now are they reaching the data

mining world. They provide a great tool for data visualization and manipulation

without having a learning curve as steep as other methods already in place.

The last, but not least, main contribution to this dissertation was the

opportu-nity to work with real data. This data came from real insurance companies and

directly translating to real people (all the data extracted went through a process

of anonymization to protect the identity of customers). This added a degree of

reality when dealing with the problem of insurance fraud, making the finally

so-lution also more applicable when addressing the implementation on the industry

versus a purely academic data generated approach.

(33)

1.5

Outline of the Document

The remainder of the document is presented as follows:

• Chapter 2 - State of the Art - Not only presents the methods used by

compa-nies, nowadays, in insurance fraud detection, but also the machine learning

techniques employed in those methods. Lastly, the theoretical foundations

to the proposed solution are presented.

• Chapter 3 - Complex Networks - In this chapter, the fundamental theory

behind complex networks and what envelops them will be presented.

• Chapter 4 - Data Engineering - The development of the model used for

pipelining and performing data manipulation operations will be explored

alongside other tools that boosted the model’s understanding and

forthcom-ing.

• Chapter 5 - Complex Network Framework and Result Analysis - A

com-parison between frameworks for developing complex networks will be

pre-sented. After that, the results that stemmed from the chosen framework

will also be presented and discussed.

• Chapter 6 - Conclusions and Future Work - Presents the conclusions of

the work developed in this dissertation and where it stands regarding the

foreseen future.

(34)
(35)

C

h

a

p

t

2

S ta t e o f t h e A rt

The most common methods used for insurance fraud and scam

de-tection diverge into two different ideologies: the first one being an

ap-proach based on the insurance company’s previous experience dealing

with situations possessing similar characteristics; the second

method-ology is based upon machine learning techniques, also known as

artifi-cial intelligence methods. Both have their advantages and downsides,

which will be further deepened in the following sections. The

conven-tional methods will be presented on Section 2.1 as well as it’s

subsec-tions. The same happens for the machine learning methodologies, on

Section

2.2

2.1

Conventional methodologies for fraud detection

Detecting and preventing insurance fraud has always been done, it’s nothing

innovative. The techniques used to avoid fraud take upon many mantles, but the

core idea is to stop fraud (or preferably try to to prevent it) at it’s early stages

of conception. The two following subsections shine light upon two of the major

activities that try just that - to prevent fraud, as it was said, early on. Subsection

2.1.1 presents what insurance companies can do to prevent losses, and Subsection

2.1.2 presents the idea that alliances between companies can provide a better

support to a fraud detection network.

(36)

2.1.1

Prevention and detection - Insurance Company level

What can an insurance company do to protect itself from fraudulent claims at an

enterprise level? The answer is not as simple as one should expect. Insurance

companies perform tangible investments on their greatest assets, and those are

the people who work there. The foremost defense is the person who is redacting

the insurance policy. It’s natural to extrapolate that, this being the person (or

people) responsible for the primary contact with the costumer, they should be

able to detect, from experience and training, certain red flags triggered by the

costumer.

Figure 2.1: Survey performed upon Australian organizations identifying basic

fraud control and prevention techniques by

PricewaterhouseCoopers Economic

Crime Survey 2007 [12]

As illustrated in Figure 2.1, it is possible to infer that, according to the survey,

there are four main key elements companies deem of importance to implement

as measures for fraud prevention at a front-end level. Those are:

1. Internal controls;

2. External and internal audits;

3. Ethical guidelines/Code of conduct;

4. Compliance program/management.

(37)

As one can imagine, internal controls refer to the measures the company takes

into account. These controls are usually issued by the board of directors and range

from financial reports to management policies. This line of thought stems from

the fact that, usually, employees feel safer, in the sense of not needing to worry

about repercussions and thus, leading to a boost in performance, performing

their job, if employers establish a relationship of trust and and friendship with

them. Getting to know a company’s workforce is the leading way, according to

the study mentioned on Figure 2.1, to avoid certain situations which may increase

the chances for mistakes to be made.

External and internal audits

serve their purpose as methods for performance

and result assessment. Despite both having the same goal, external differ from

internal in the sense that a less biased approach is taken when performing the

audit. Despite their forthcoming differences, they both assess several predefined

parameters defined by the audit firms (in case the audit is external). These

evalu--ate the financial reports the companies present at the end of the fiscal year. They

look for misstatements or blatantly indices of fraud. Audits perform a crucial role

as they can detect situations that can go unnoticed in the day-to-day life cycle of

the company.

Ethical guidelines/Code of conduct

refers to the established rules for

con-duct and ethical execution of tasks. Many times, unspoken and taken for granted,

these guidelines strive to achieve a good performance in what regards the job

implementation. Regarding insurance companies, these social and ethical

guide-lines, are once more, a way of minimizing the risk of falling into the fraud pitfall.

Some of these approach topics like receiving gifts from customers, conflicts of

interest and breaching of company’s policies guidelines [12].

Compliance program/management

are a way that companies have, to instill

certain methodologies to their employees. Once more, according to the study,

the companies interviewed deemed of relevance this mean of getting through to

people. This is also one of the best ways to keep up with the current legislation

and needs of the insurance industry. Lastly, keeping up with the times, once

more, is an effective way of combating insurance fraud and scam. The more

informed people are, the better and more appropriately they deal with unexpected

situations.

Having said all this, to reiterate, keeping the people who deal directly with

the costumers well informed on what is acceptable and what is not, greatly

di-minishes the probability of anything happening at the moment of the creation

of the insurance policy. Experience also plays a big role in fraud detection and

prevention as the trends for scam schemes don’t diverge much from what they

(38)

used to be in the past. For example, the norm for automobile insurance fraud

is to have staged accidents and then ask the insurance company to pay for the

damages (activate the policy to receive the premium) [13]. After the contract is

made, the likelihood the fraud is detected greatly decreases and so, Subsection

2.1.2 explains the main way companies found to try and decrease this trend.

2.1.2

Anti-fraud alliances

As a targeted response to the growing evidence backing up the seriousness of the

insurance fraud problem, more and more companies are adhering to a strategy

of establishing specialized task forces, to tackle the problem at a country-wide

level. Mostly comprised of assets belonging to the insurance companies, they

are also constituted by people responsible for sanctioning the fraud perpetrators.

These task force’s primary objective is to investigate suspicious insurance policy

cases and help insurance companies deal with them accordingly [13]. Other

important features of these alliances, or bureaux, is that they serve as a means

to disseminate information about the offenders, they function as an

awareness-raising and standardization tool for the industry norms. This way, the industry

and the stakeholders have the right tools not only to protect themselves but also

to change their attitude towards insurance fraud [13].

Therefore, what do, insurance companies, have to benefit from joining forces

against fraud? Short answer, everything. By pooling resources, companies gain

the ability to gather all the disperse and under-utilized information scattered

along the system. It was well know, for the automobile insurance industry, that

fraudsters gained the upper hand by exploiting this particular weakness. They

would go from town to town and create policies with different alias, thus seeming

that the policyholder was someone different every time [14]. Nowadays, that’s

much harder, for example, in Portugal, there is a system in place called

Associação

Portuguesa de Seguradores (APS) on which, insurance companies share information

about the policyholders, thus leading to the creation of an ecosystem on which it

is more difficult to exploit the gaps. This way, automobile insurance scammers

are more easily detected and notified of their actions. The name of the tool used

for this purpose is SEGURNET.

The APS is a clear example of a centralized intelligence gathering system, one

which enables the linking and sharing of legal information (with some

limita-tions) like policies, applicants, policyholders, claimants, risks, losses, doctors,

repair shops, lawyers, and so on (depending on the type of industry approached).

Despite this being the case, this doesn’t mean the companies have access to all the

(39)

information about one another, that would compromise honest competition [13].

2.2

Machine Learning Methods

As one can imagine, given that today, we live in an era driven by buzzwords such

as Big Data, Machine Learning, Data Integration and so on, the likelihood of

analyzing and extracting knowledge has become increasingly more tiresome and

complex. To get around this fact, the industries, and in particular the insurance

industry, have devised ways to process all this information and be able to extract

something of value from it. These approaches are denominated Machine Learning

and Data Mining methods and are at the core of the newfound techniques for

extracting knowledge from data.

But, before anything can be extracted from raw data, it must first be

trans-formed and standardized as, once more, working with raw data can be

counterpro-ductive in the sense that the difficulty of the extraction of features and knowledge

increases exponentially. Thus, on 2.2.1, ways for performing transformations and

standardization will be presented.

After those transformations are made and methodologies taken into account,

the possibility to perform data mining methods is enabled. Those, which are

currently employed in the insurance industry, are explained in sections 2.2.3.1,

2.2.3.2 and 2.2.3.3.

2.2.1

Data Preparation

2.2.1.1

Extract, Transform and Load

ETL is the process of integrating data from multiple, typically disparate, sources

and bringing them together into one central location. It is one of the main

com-ponents for businesses to successfully and efficiently make use of the data stored

in a data warehouse [15]. For most businesses, the potential for usefully using

the data to its fullest is locked behind insurmountable quantities of raw data; one

study revealed that nearly two-thirds of companies do not benefit enough, or at

all, from the data in their possession [16] [17]. Given the definition of ETL, it

is now of importance to approach the meaning of each step to the end goal. As

implied in its name, ETL is comprised of three distinct steps, each one of equal

importance on the chain of events.

The first link in the chain, called Extraction, aims to extract data from the

source systems to be passed along, with the intent of being processed. This step

(40)

also tries to obtain the data as efficiently and with as little impact to the source

system as possible. In the current days, businesses, collect and store data from

an assortment of different sources, each with their own methodologies and

tech-niques to format that data [15], and sometimes this fact can lead to the first step

of the process to become the most time-consuming.

The following action of this process, Transformation, takes into account the

data extracted in the previous step. This data goes through a process of

trans-formation ( one of the possible transtrans-formations is the conversion of the acquired

data) in order to meet the requirements of the target system. This step can also

involve the following transformations:

• Purging and approving data to guarantee just quality data is relocated to

the new framework

• Sorting the information into segments to enhance convenience and

accessi-bility

• Combining or blending information from various source frameworks and

de-copying that information

• Applying business standards to information

• Creating rules for information approval that can be mechanized to check

information for quality and precision

This process entails the previous transformations in order to ensure the quality

and integrity of data. Without this step, businesses cannot be confident in the

data being migrated or integrated into the target system, which can lead to an

undefined amount of time and assets wasted.

The last, but not least, element on the ETL process chain, is the Load phase.

This step ensures that the extracted and transformed data is loaded correctly into

the end system. The successful completion of this step is directly connected to

the volume of data, the structure of that data, and frequency at which it will be

loaded at. Depending on the complexity of this step, two typical ways that data

can be loaded into a data warehouse, are presented: full load or incremental load.

This ensures that the systems ruling the process are not overwhelmed by the sheer

amount of data in the process.

Figure 2.2 depicts the entirety of the ETL process from left to right. There is

also the part corresponding to the business analytics depicted on the far right of

the figure, on which the machine learning methods will be applied.

(41)

Figure 2.2: Descriptive figure depicting the ETL process from left to right. DWH

stands for a data storage solution which is not relevant to be addressed.

Source: https://panoply.io/data-warehouse-guide/3-ways-to-build-an-etl-process

Despite being a very good and comprehensive tool, the ETL process it is not

without its flaws and, therefore, some practices can be put into place to help,

en-hance and expedite the flow. During the ETL process, data is pulled from multiple

sources, and, some of those, may be historic or legacy data and therefore may not

be optimized for business and analytic practices. Through ETL, it very well may

be moved to a focal information distribution center (data warehouse) in an

in-stitutionalized organization, which is considerably more reasonable for business

insight. With the emphasis put on having the capacity to settle on

information-driven choices, it is essential to take proactive stratagems to guarantee

infor-mation quality. Purging, approving, de-copying, and profiling inforinfor-mation are

central accepted procedures that not just give quicker time-to-esteem to ETL and

other information combination and relocation forms, yet engage associations in

improving how they use the information in their possession [15].

ETL, once more, is a great tool to deal with the problems of today’s paradigm,

but as one walks through an even more data-rich environment, this

methodol-ogy begins to fall behind another well known one, and that is Extract, Load and

Transform (ELT). As it is illustrated in Figure 2.3, the main difference is where

the transformation process occurs. Another important feature worth

mention-ing is the fact that, in the figure, the cloud symbol is present. This serves the

purpose of identifying that the ELT process is well designed to be implemented

on cloud architectures. With modern, cloud-based infrastructure technologies,

frameworks can now bolster their support to extensive data storage and scalable

compute power at diminished costs. In this manner, it becomes advantageous to

keep data in a vast and regularly growing data pool, unending quick handling

(42)

capacity to keep up with the extracted raw data [17].

Figure 2.3: Descriptive image depicting the ELT process from left to right.

Source: https://www.talend.com/resources/elt-vs-etl/

With this in mind, if the industry, the tool is going to be implemented on,

allows it, ETL should be employed. If what it is required is a scalable tool, with

the future of data technologies in mind, ELT should be implemented instead. This

is due to the fact that all the raw data can be stored until it is ready to be used,

therefore becoming easier to divert all the resources to the extraction and loading.

As with any tool, knowing when to use it is at least as important as knowing how

to use it.

2.2.2

Data Mining Methodologies

2.2.2.1

Cross Industry Standard Process for Data Mining

CRISP-DM is a methodology described through a hierarchical process model,

consisting of six different phases, each one having a direct impact on the next,

in order for data mining experts to build analytics models. The flow of the life

cycle of this methodology can also be described by how each step of the process

is running and then assess how it will influence the next step as can be seen in

Figure 2.4.

It is also possible to observe in Figure 2.4 how the flow is directed, and which of

the steps are involved. One of the characteristics of this particular methodology

is the ability of the inter-phase processes not being strict but rather dynamic,

meaning it depends on the output of the previous phase. On a grander scale,

this means that his methodology is not linear, allowing for more freedom when

executing the tasks. As an outcome of this fact, the arrows in the figure only

depict the most important and frequent dependencies between phases [18].

(43)

Figure 2.4: The CRISP-DM reference model.

Source: https://tinyurl.com/yb2polyd

This being said, the six phases, and what purpose they serve [19], are the

following:

• Business Understanding - This crucial stage revolves around

understand-ing the future undertakunderstand-ing objectives and necessities from a business

per-spective, and afterwards changing over this information into a data mining

issue definition, and a primer arrangement planned to achieve the

objec-tives.

• Data Understanding - The data understanding stage starts with an

under-lying information assembling phase and proceeds with activities to get to

know the data, to perceive data quality issues, to discover first bits of

knowl-edge about the data or to recognize interesting subsets to shape theories for

shrouded information.

• Data Preparation - The data preparation stage covers all exercises to build

the last dataset (information that will be fed into the modeling tool(s)) from

the underlying raw data. Information readiness errands are going to be

played out numerous times and in no specific order. Assignments

incorpo-rate table, record, and characteristic determination just as transformation

and cleaning of information for modeling devices.

(44)

• Modeling - In this stage, different modeling methods are chosen and

con-nected, and their parameters are adjusted to typical values. Typically, there

are a few systems for similar data mining problem type. A few techniques

have explicit necessities on the kind of information. In this way, venturing

back to the data preparation stage is regularly required.

• Evaluation - At this stage in the endeavor, a model (or models) that appears

to have high gauge has been built, from a data analysis perspective.

Preced-ing the last arrangement of the model, it is essential to, even more through

and through, evaluate the model and overview the means executed to build

up the model, to make sure it suitably achieves the business objectives. A

key objective is to choose whether there is some fundamental business issue

that has not been adequately considered. After this stage, a decision on the

use of the data mining results ought to be come to.

• Deployment - Despite whether the explanation behind the model is to build

the knowledge of the information, the data got ought to be dealt with and

showed to such an extent that the customer can use it. Dependent upon the

prerequisites, the deployment stage can be as fundamental as delivering a

report or as flighty as executing a repeatable data mining process. When

in doubt, it will be the customer, not the data analyst, who will perform

the deployment steps. In any case, paying little mind to whether the expert

will not make the deployment effort, it is fundamental for the customer to

understand ahead of time what exercises ought to be finished to make use

of the models assembled.

Despite this phases being more or less standardized across the industry,

play-ers tend to adapt this approach to their specific needs. This being said, the core

values of the methodology remain intact, only differing on the phase order taken,

and how they implement the steps needed for the project completion. One other

thing worth mentioning, is the fact that this methodology was created on 1999

[20], thus a previous revision on what has changed since then is good practice.

For example, since today the data volume paradigm has changed dramatically, a

more careful approach to the data blending from diverse sources is needed,

qual-ity control has to take a tightened approach and additional steps for optimization

may be needed [21].

(45)

2.2.2.2

Sample, Explore, Modify, Model and Assess

The SEMMA method is another way to express the methodologies for building

analytical models. This method was developed by the SAS Institute in order

to materialize the company’s ideologies regarding the data mining applications

developed in-house.

Despite being dubbed as a method, the Statistical Analysis System (SAS)

In-stitute claims it is more like a logical organization of the functional tool set of

their data mining tool, the SAS Enterprise Miner, for carrying the core tasks of

data mining [22]. Despite this, and for the sake of simplicity and coherence, this

logical line of thought will be dubbed as a methodology.

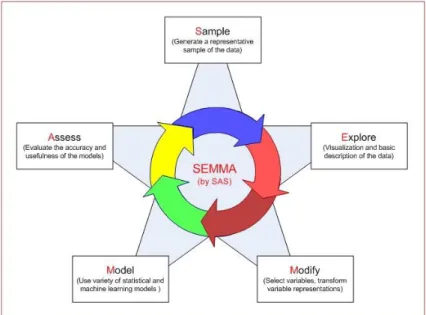
As can be observed in Figure 2.5, and as the name implies, the SEMMA flow

is comprised of five different phases, which have the following purposes:

Figure 2.5: The SEMMA reference model.

Source: https://tinyurl.com/y8h78qm9

• Sample - This stage comprises inspecting the information by separating a

part of a broad dataset sizable enough to contain a representative portion of

the data, yet small enough to be manipulated rapidly. This stage is brought

up as being discretionary.

• Explore - This stage comprises the investigation of the data via hunting

down unforeseen patterns and peculiarities so as to increase comprehension

and gain ideas. Sometimes, this phase is not feasible through visualization

only. To counter that, statistical methods may be used to aid in cluster or

pattern recognition.

(46)

• Modify - This stage comprises the adjustment of the data by making,

choos-ing, and changing the factors to center the model selection process. Taking

into account the findings from the previous phase, this step may already be

pointed in the direction to the results the business wants. The modification

can also occur due to the fact that the data, when it was mined, was in a

dynamic stance.

• Model - This stage comprises modeling the information by enabling the

software tools to scan naturally for a mix of data that dependably predicts

an ideal result. The models used fit the category of statistical knowledge

like the ones described on 2.2.3.2 and 2.2.3.3.

• Assess - This stage comprises surveying the data by assessing the value and

unwavering quality of the discoveries from the data mining process and

gauge how well it performs. In this phase, once more, it is possible to use

statistical methods for assessing how good was the knowledge extracted

from the data.

With this method in place, the possibility to determine how relevant the

find-ings were for the business arises. This enables the assessment of the tool

de-veloped by SAS Institute (SAS Enterprise Miner) and how it fares for the client,

giving a structured approach to the data mining problem [23].

2.2.2.3

Knowledge Discovery in Databases

The final methodology to be referenced is the KDD. This differs from regular

Knowledge Discovery in the sense that, KDD is directly applied to databases (as

the name implies) giving it a higher degree of abstraction. This is due to the fact

that, if the data is present on a database, it has likely been subjected to some

degree of ETL techniques to some extent [23]. Nonetheless, and as it is possible

to observe in Figure 2.6, this method is comprised of five distinct phases, those of

which have the objective to extract certain desirable features and patterns known

as knowledge. The following is a brief explanation of what is the goal of each

phase:

• Selection - This step consists on selecting all the data that fits the

descrip-tion of what is wanted or needed for the project (target data), with the

ob-jective of performing the data mining process.

(47)

• Preprocess - On this step, the selected data goes through a process of

clean-ing and standardization in order to obtain an even more relevant subset of

data for the client to work upon.

• Transformation - Here is where the data transformation techniques are

applied. Data dimensionality reduction and transformation methods are

employed.

• Data Mining - One of the most important steps for the KDD method. In this

phase, data is searched for patterns of interest depending on the objective.

• Evaluation - After the entirety of the process is concluded, the end result

(knowledge) is evaluated and interpreted.

Figure 2.6: Descriptive image depicting the KDD process.

Despite the usefulness of this method, previous knowledge of the application

domain is required in order to perform clear and profitable decisions for the

end-user. After the knowledge is extracted at the end of this process, it can also be

incorporated ( and it should) into the system. Another thing worth mentioning is

that there can exist loops between any two steps of this chain [24].

(48)

2.2.2.4

Overview on CRISP-DM, SEMMA and KDD

After going through the three main methodology models for a data mining

pro-cess, it is now possible to compare each other for their strengths and weaknesses.

With respect to the current examination, it is conceivable to presume that

SEMMA and CRISP-DM can be viewed as an execution of the KDD procedure.

At first sight, it is possible to conclude that CRISP-DM is more complete than

SEMMA. In any case, investigating it more top to bottom, it is possible to

incorpo-rate the improvement of comprehension of the application space, the significant

prior knowledge and the objectives of the client, on the Sample phase of SEMMA,

in light of the fact that the data cannot be examined except if there exists a

gen-uine comprehension of all the exhibited viewpoints, allowing solidification by

consolidating this knowledge into the framework. This prompts the way that

standards have been accomplished, concerning the general procedure: SEMMA

and CRISP-DM do manage to achieve their goals and implement frameworks

businesses can work upon.

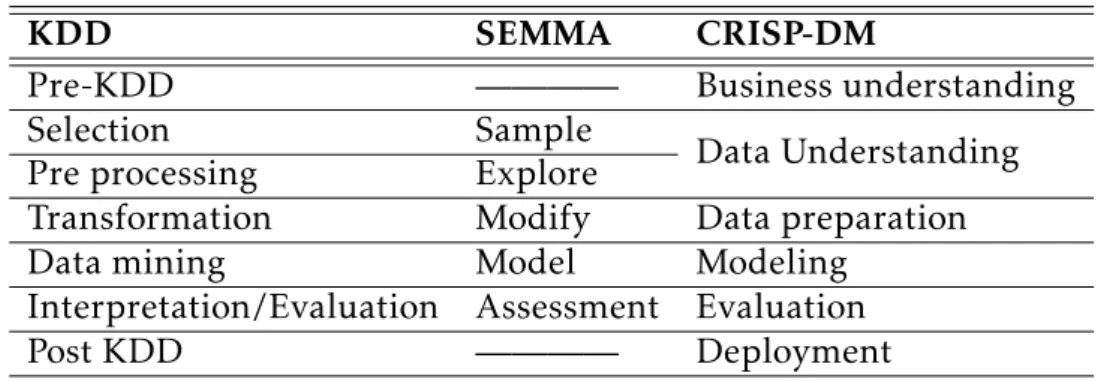
In table 2.1, a brief summary of the main phases of each method is presented

as a way of understanding the correspondences between each model.

Table 2.1: Summary of the features between KDD, SEMMA and CRISP-DM

Adapted from [23]

KDD

SEMMA

CRISP-DM

Pre-KDD

————

Business understanding

Selection

Sample

Data Understanding

Pre processing

Explore

Transformation

Modify

Data preparation

Data mining

Model

Modeling

Interpretation/Evaluation

Assessment

Evaluation

Post KDD

————

Deployment

2.2.3

Machine Learning Algorithms

2.2.3.1

Clustering

Clustering, or data segmentation, is the process of assigning groups to a set of

objects so that they fall into classes of similar properties. The primary property

of the cluster is that the objects inside the same cluster must be similar to each

other while being dissimilar to objects of other clusters [25]. The great benefit

from grouping up objects is that they can be treated as one, since they are in the

(49)

same cluster, thus enabling the possibility of identifying distribution patterns

and correlations between attributes.

There are two main objective ways to employ the cluster method. These

struc-tural procedures take the form of data matrices (2.1) or dissimilarities matrices

(2.2). Data matrices usually contain the raw data before it is processed, whereas

the dissimilarities matrices contain the data after an algorithm runs through the

raw data. This being said, the dissimilarities matrices contain the data of most

importance for the intended objective.

Data matrix

(or object-by-variable structure): This represents n objects with

p variables (also called measurements or attributes). The structure is in the form

of a relational table, or n-by-p matrix (n objects × p variables) [25] as seen in 2.1:

A =

x

11

... x

1f

... x

1p

...

...

...

...

...

x

i1

... x

if

... x

ip

...

...

...

...

...

x

n1

... x

nf

... x

np

(2.1)

Dissimilarity matrix

(or object-by-object structure): This stores a collection

of proximities that are available for all pairs of n objects. It is often represented

by an n-by-n table:

B =

0

d(2, 1)

0

d(3, 1) d(3, 2) 0

..

.

..

.

..

.

. ..

d(n, 1) d(n, 2) ...

...

0

(2.2)

where d(i, j) is the measured difference or dissimilarity between objects i and

j. In general, d(i, j) is a non negative number that is close to 0 when objects i and

j are highly similar or “near” each other, and becomes larger the more they di

ffer

[25]. Since d(i, j) = d(j, i), and d(i, i) = 0, the matrix as the one in 2.2 is created

which contains all the relevant values.

Despite there being many types of features, for the sake of simplicity and

getting the point through, only quantitative types will be considered as for all

the other types the methods employed would be significantly different. This

being said, one of the most used algorithms for data segmentation is the K-means

Clustering, which measures the dissimilarity using the formula of the Euclidean

distance as follows:

Imagem

Figure 2.1: Survey performed upon Australian organizations identifying basic fraud control and prevention techniques by PricewaterhouseCoopers Economic Crime Survey 2007 [12]
Figure 2.3: Descriptive image depicting the ELT process from left to right.
Figure 2.5: The SEMMA reference model.
Figure 2.6: Descriptive image depicting the KDD process.
+7

Referências

Documentos relacionados

Eles podem não escrever ali o que é, mas ouvir alguém falar, o pai falou isso, a mãe falou aquilo, daí você também não pode dizer a mãe não sabe, o pai não sabe, você já

A regulação do crescimento é complexa e multifatorial, sendo os fatores genéticos fundamentais para determinação do potencial do crescimento, porém com uma interface múltipla

Disse que não conversa muito com o pai, só com a mãe Perguntei o motivo de ele conversar pouco com o pai, ele disse: “meu pai é muito sério, quase não fica em casa

F ullerman está à espera… «Não só foste eleito para o conselho escolar, como também alcançaste a MAIOR PONTUAÇÃO DE SEMPRE no teste da semana passada.. Agora, o Marcus

O Partido Republicano Riograndense (PRR) esteve no poder do Estado do Rio Grande do Sul por quase 40 anos, tendo como principais líderes Júlio Prates de Castilhos e

A mãe devemos eterna alegria e gratidão Não importa seu sexo, se é “pai-mãe”.. Sentimentos de ser mãe, não importa em

・ Lar de pai ou mãe solteiro(a) ou mora no lar pessoa com deficiência(a própria criança, pai, mãe, irmãos), lar que se enquadra para pagar imposto municipal (pai e mãe

FAMÍLIA SECRETA DE ORAÇÃO 2 | A relação com o cardápio do almoço para o encerramento da Família Secreta de Oração já está com Anne (Cerimonial da SAF). Todas