Cadernos de Saúde Vol. 2 N.º 1 – pp. 41-50
Resumo
Certos déficits na percepção visual do movimento podem ser detectados através das tradicionais tarefas de detecção de coerência do movimento. Neste tipo de tarefas é necessário detectar uma percentagem de movimento coerente embutido num fundo constituído por pontos luminosos com movimento aleatório. Esta técnica permitiu inferir um déficit na detecção visual do movimento coerente em pessoas com Perturbações do Espectro do Autismo (PEA) e com Síndrome de Williams (SW). Este déficit foi sugerido como estando na base de uma perturbação na função do sistema dorsal nestes dois grupos clínicos. É possível que outros déficits na percepção visual do movimento coexistam com o déficit na detecção da coerência do movimento. Além disto, cada uma destas perturbações do desenvolvimento poderá apresentar um padrão específico de déficits na detecção visual do movimento. Nós investigámos seis aspectos diferentes da sensibilidade ao movimento na PEA e na SW com o objectivo de verificar se um conjunto particular de déficits poderia ser generalizado a cada grupo clínico. Participaram neste estudo: nove crianças com PEA, 10 crianças com SW e 96 crianças com desenvolvimento Típico. Foram usados seis cinematogramas de pontos aleatórios. Aqui mostramos que os padrões de déficits são muito heterogéneos dentro de cada grupo clínico. No entanto, os participantes com PEA mostraram déficits consistentes numa tarefa de ‘Movimento Singular’ e os participantes com SW mostraram déficits consistentes numa tarefa de ‘Coerência do Movimento’. Os resultados são discutidos em termos das dissociações encontradas nos padrões de déficits na detecção do movimento, possivelmente relacionadas com déficits complexos associados de atenção visual.
Palavras Chave: Sensibilidade visual ao movimento;
Per-turbações do Espectro Autista; Síndrome de Williams.
Abstract
Certain deficits in visual motion sensitivity can be assessed via traditional motion coherence tasks where the subject is prompted to detect a percentage of coherent motion embedded in a background of random moving dots. This technique has enabled researchers to infer a deficit in visual motion coherence detection in people with Autism Spectrum Disorder (ASD) and Williams Syndrome (WS) which has been suggested to account for a deficit in function of the dorsal stream in these two groups. It is possible, that not only motion coherence, but several different visual motion deficits coexist. Moreover, a different pattern of low level motion detection deficits might underlie each of these developmental disorders. Here we investigate six different aspects of motion detection sensitivity in ASD and WS with the aim to verify if different deficit patterns might be generalized to each clinical group. Nine children with ASD, 10 children with WS and 96 Typically Developing (TD) children participated in this study. Six Random Dot Kinematogram tasks were used. Within-group score patterns were very heterogeneous across tasks for both clinical groups. However, participants with ASD showed consistent deficits in a ‘Single Mobile’ task and participants with WS showed consistent deficits in a ‘Motion Coherence’ task. The data are discussed in terms of the dissociations found in the motion detection deficit patterns, possibly related with complex co-morbid visual-attention disorders.
Keywords: Sensitivity to visual motion; Autism Spectrum
Disorders; Williams Syndrome.
Heterogeneidade nos Deficits de Percepção do
Movimento em Perturbações do Desenvolvimento:
O Caso do Autismo e da Síndrome de Williams*
Heterogeneity in Motion Perception Deficits in
Developmental Disorders:
Evidence from Autism and Williams Syndrome
Ana Maria Abreu1,2 * and Scania de Schonen3
1 Developmental Neurocognition Group, LPP, René Descartes University -CNRS, Paris, and Dpt. of Pediatric Neurology, Robert Debré Hospital, Paris, France; 2 Currently at: Instituto de Ciências da Saúde da Universidade Católica Portuguesa, Lisbon, Portugal.
3 Developmental Neurocognition Group, LPP, René Descartes University - CNRS, Paris, and Dpt. of Pediatric Neurology, Robert Debré Hospital, Paris, France.
* This paper summarizes part of the research completed by the first author, in order to obtain her PhD degree. ** [email protected]
Moore (2006) highlights the central contribution of the attentional system as a modulator of gazing. Furthermore, Milne and colleagues (2002) find high motion coherence thresholds in children with ASD but argue that global processing is modulated by attention. Brown et al. (2003) report a poor sustained attention deficit in Down Syndrome and consider possible implications of attention disengagement disorders in visual spatial representation problems in WS. This lead us to six different tasks where not only the motion conditions varied, but also the attentional demands, in accordance with speed or size of displacement.
Biological motion (e.g. Blake et al., 2003), optic flow (e.g. Gepner & Mestre, 2002), second order (texture defined) motion (Bertone et al., 2003), and motion coherence detection (e.g. Braddick, 2000) tasks have been used to assess deficits in VM detection in these clinical groups. Here we use two sets of tasks tapping different types of motion sensitivity: single target motion as well as motion coherence.
Among the visual perception deficits coexisting with high-level traits (e.g. Castelli et al., 2002; Palomares et al., 2003), deficits in sensitivity to VM (e.g. Atkinson et al., 1997; Gepner et al., 1995) were found to be persistent in ASD (e.g. Milne et al., 2002) and in WS (e.g. Atkinson, 2006). Identifying these low-level deficits might provide crucial cues for understanding the neural developmental abnormalities underlying mental dysfunction. A deficit in the magnocellular dorsal pathway (implicated in motion processing) indicates a deficit in neurons endowed with specific characteristics that enable them to perform and generate signal processing faster than parvocellular pathways.
Spencer et al. (2000) suggested a possible abnormal development, in children with ASD, of the visual pathways involving magnocellular cells. However, a deficit in VM sensitivity was found to be absent in high functioning children and adolescents with autism (Mottron et al., 1999) and in 3 children with Asperger syndrome (Gepner & Mestre, 2002). Pellicano and Gibson (2008) recently suggested that different disorders (ASD and dyslexia) can be dissociated according to the origin of the impairment along the dorsal stream pathway. Taking into consideration the evidence stated above, it seems that deficits in VM processing not only vary cross-syndrome, but they might not distribute equally across the entire group of people presenting the same clinical phenotype (for reviews concerning ASD see Milne et al., 2005; Abreu & Happé, 2005).
Introduction
Low-level perceptual deficits, in particular Visual Motion (VM) coherence deficits, have been proposed to co-exist with high-level behavioral deficits in developmental disorders. These studies have been paramount to the understanding of abnormal brain development. The motivation for the present research stems from the frequent referral to low-level visual deficits in descriptions of Autism Spectrum Disorders (ASD) and Williams Syndrome (WS). Motion detection deficits have been proposed to constitute a biological marker for at least a subgroup of people with ASD (Gepner, 2002) and WS (Atkinson et al., 2006). Our aim is to identify specific VM detection deficits for these two developmental disorders. Finding specific patterns of low level VM deficits might allow for early diagnosis of ASD and tailoring of specific behavioral therapies, that take particular visual motion deficits into consideration.
The interest in low level visual motion processing deficits stems from the fact that these are a source of information concerning the pre-natal phases of brain development and a possible factor that contributes to the development of visual-social disorders. Bassili (1978) presents early results on the influence of facial motion in emotion expression detection in typically developing (TD) adults. The author suggests that movement of the face surface provides sufficient information for the detection of a number of emotions. What consequences then, to visual-social processing, if motion processing is altered or deviant as frequently described in developmental disorders? In their computational model, Triesch and colleagues (2006) contend that a basic set of structures and mechanisms (e.g. structured environment featuring (eye gaze directed) reward driven learning) is sufficient for gaze following to emerge. Importantly, the authors tested their model against specific aspects of ASD and WS. They concluded that disinterest in faces, aversion to direct gaze and deficits in shifting attention might act as mechanisms altering the strength of reward in ASD. Moreover, they proposed that higher preference for faces, altered or delayed emergence of face processing skills and less accuracy in determining the direction of gaze might act as mechanisms altering the strength of reward in WS. The authors thus showed that reduced reward was found to be sufficient to explain delays or complete failure in the emergence of gaze following. Importantly, on his comment to Triesch et al.’s (2006) computational model,
three countries where the children were examined. All included subjects had corrected to normal or normal vision and understood the examples and task related instructions.
Autism group. Nine children with ASD (2 ♀ and 7 ♂ aged 50-81 months; Mean age = 64.33 months,
SD = 10.54) were recruited from a Pediatric Hospital in France. All the children had previously been diagnosed with autism according to DSM-IV criteria. They had no known focal brain anomaly (MRI scan) nor clinical or electric epileptic signs. Two additional children with ASD (from an initial pool of 11 children) were excluded from the sample given they did not maintain visual attention to the screen.
Williams Syndrome group. Ten children with WS
(2 ♀ and 8 ♂ aged 61-192 months; Mean age = 114.8
months, SD = 45.36) were recruited from a University Pediatric Hospital in Paris and in Leuwen, from the French Society of Williams Parents, and from the Portuguese Association of Trisomy 21 in Lisbon. Clinical diagnosis for inclusion was obtained via a positive genetic test (FISH). None of the recruited subjects were excluded from the sample.
Control group. A total of 96 TD children (aged: 48 to 186.96 months) were recruited from a Pediatric Hospital Day Care Department and from a Nursery School in Paris, and from a Primary School in Lisbon. Stimuli
Five computer-generated tasks and one paper task were created. The computer generated stimuli were presented on a Toshiba Satellite A30-254 computer on a 15’’ TFT screen (1024 × 768 pixels). All 6 tasks assessed either sensitivity to Single Target motion or sensitivity to Motion Coherence. Four tasks were Random Dot Kinematograms (RDK) composed of 180/200 point lights (Æ = .278 cm) on a 22.27 by 16.7cm frame. In the ‘Collision’ task there were only two animated targets. All point lights had continuous life (no image refreshment) during each 15 second presentation that composed a trial (4 to 8s in the ‘Collision’ task); the contrast between point lights and background was maximum. Each task consisted of 12 to 14 trials that assessed sensitivity to different motion properties. Each trial started only when the child was looking at the screen. Target speeds, design and format of the RDK were similar to those of earlier studies (e.g. Atkinson et al., 1997; Milne et al., 2002; Spencer et al., 2000).
Atkinson et al. (1997) observed an anomaly in VM detection corresponding to a deficit in the dorsal stream in children with WS. Moreover, Atkinson et al. (2006) found that VM deficits persist into adulthood despite considerable variation in the sensitivity threshold across individuals with WS. The authors showed a greater performance deficit for motion coherence than for form coherence in WS. Finally, Mendes et al. (2005) found a deficit in 3D, but not 2D structure from motion whilst presenting a deficit in sensitivity to VM. However, Nakamura et al. (2002) showed preservation of VM detection associated with a configural visuospatial deficit in a child with WS; and Reiss et al. (2005) did not find a deficit in motion sensitivity when measuring performance of people with WS at a speed of 2.51°/s. These findings suggest, that in WS as in ASD, a visual processing deficit cannot be simply generalized to a clinical group as we encounter variation of manifestation of the deficits across individuals belonging to the same clinical group.
In summary, although individuals with WS and ASD exhibit different behavioral phenotypes, including different visual deficits (Baron-Cohen et al., 1985; Ozonoff, et al., 1991; Sullivan & Tager-Flusberg, 1999; Tager-Flusberg & Sullivan, 2000), both groups have been shown to be impaired in sensitivity to VM. Here, we use several novel VM tasks to investigate if VM detection deficits are consistent across each of the clinical groups. We also investigate if a deficit in sensitivity to motion concerns only motion coherence or wider motion phenomena (i.e. single target motion). If VM detection deficits are observed in some but not all children despite the use of different tasks and motion speeds, then these deficits cannot be considered as characteristic low-level features, nor be thought of as one of the developmental sources of higher level abnormalities (such as social signal processing) in ASD and WS. Here, we tackle motion and attention phenomena. Increase in sustained attention might not be associated with increase in task difficulty.
Methods
Participants
Participants were tested at home, at the Hospital (as a part of a standard clinical vision examination) or at school. Written parental consent was obtained in accordance to the Ethical Standards existing in the
Tasks
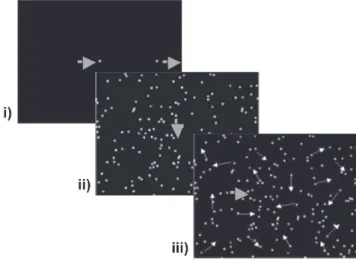
Figure 1 – Single Target tasks: i.) Task 1. ‘Collision’; ii.) Task 2. ‘Single Mobile’; and iii.) Task 3. ‘Single Mobile over Moving Dots’.
Task 1. ‘Collision’
A point light square (4mm2) moved horizontally, from left to right, ‘colliding’ (once per trial) with a stationary square that was set in motion upon collision. The participants were instructed to indicate when the first target hit the second. The targets’ displacement speeds varied across trials: from 1.19°/ sec to 10.76°/sec. The trials were presented in order of increasing speed.
The participants scored in the presence of verbal (vocalization during collision), or ocular responses (pursuit of the first target and brief disorganization of pursuit during collision and departure of the second target).
Task 2. ‘Single Mobile’
A point light was displaced at a constant speed across the screen either horizontally (left to right or vice-versa) or vertically (ascending or descending) over a background of fixed random dots (mild interference). The target’s angular speed decreased across trials (from 47.84°/sec to 0.06°/sec), crossing the screen from 1 to 20 times per trial, depending on the target’s speed within the trial.
The participants scored either when presenting pursuit of the target with the index finger or repe-atedly pointing to a section of the target’s trajectory (this response was considered because young control subjects presented this type of behavior) or ocular-cephalous pursuit of the target.
Task 3. ‘Single Mobile over Moving Dots’
A single target moved with a uniform speed over a background of point light distracters in random Scoring
Sensitivity to motion was assessed by means of pointing and explicit verbal responses (see details in task description below). In the absence of explicit responses, eye and/or eye-head pursuit of a displace-ment (and ocular saccade when a change in motion occurred) were considered by the experimenters. No automatic recording devices were used because the presence of these materials in the room distracted some of the clinical subjects. Two experimenters coded eye/head responses in real time and only answers where accordance between experimenters was obtained were considered. 6% of data points were rejected due to disagreement between expe-rimenters. Eye reaction to motion was very easy to detect and was consistent with pointing and verbal answers in all but the 6% of cases where agreement was not reached. When children were pointing or presenting verbal responses, they also showed eye pursuit movement and saccades corresponding to their correct or incorrect answer. It was thus possible to validate performances by comparing the experimenters’ reports with the pointing and verbal responses of 35 control children. Cases where only eye-head reaction was present were thus included, but only when clear tracking responses were given. The trials were ranked by the control participants’ frequency of correct responses. Given that there were 8 different trials in each task (the other 4-6 trials were repetitions), a score of 1 was assigned to the trial which was correctly responded to by the greatest number of control participants (‘easiest trial’); and a score of 8 was attributed to the trial failed by the greatest number of control participants (‘difficult trial’). The highest score obtainable was ‘36’, except for the ‘Form from Motion’ task that comprised 4 equally difficult trials, each scored with ‘1’. This scoring system was used because a threshold (for speed or dot percentage) could not be identified in the clinical groups.
another transparency covered with black random dots. Displacing the sheet containing the doted contours rendered the shape visible. The speed of the displacement (to and fro) was controlled by the experimenter. The participants scored either when naming the object or when choosing the correct object out of four possible, from a set of 8 previously identified pictures.
Procedure
The participants were tested either at home, at school, or at the hospital, in a room with the fewest distracters possible. They were seated on a chair or on their parent’s lap, facing the computer screen at a distance of ~50 cm. The computer was placed in a poorly lit area of the room.
Participants completed practice trials before each task (the number of practice trials varied depen-ding on the child’s performance). Instructions about looking, pointing and verbalizing were given along with the practice trials and again during the task when necessary. A general familiarization session was also completed before the data collection.
Results
Group Analysis
Two sub-groups of children taken from the Control Group pool were matched with each clinical group. Two TD control children were chronological age-matched (0/-1 month) with each child with ASD composing a control group of 18 children (ASDgroup: Mean age 64.33 months, ControlASD: Mean age = 63.94 months). Similarly, two control children were chronological age-matched (0/-1 month) with each WS child composing a control group of 20 children (WSgroup: Mean age = 114.8 months, ControlWS: Mean age = 113.65 months). Chronological age was used as matching criterion because our aim was to assess visual development relative to the number of years of visual practice, independently of mental age.
Scores were significantly higher (Mann-Whitney U test) for the ControlASD group than for the ASD group (Figure 3) in ‘Collision’ (Z = -2.038, p < 0.05) ‘Single Mobile’ (Z = -3.658, p < 0.001) and all Motion
Coherence tasks: ‘Direction Change’ (Z = -2.430, p < 0.05) ‘Dot %’ (Z = -2.983, p < 0.01) and ‘Form
From Motion’ (Z = -3.040, p < 0.01) but not in ‘Single
Mobile over Moving Dots’ (Z = -1.836, p > 0.05). Difference between WS and ControlWS scores were not significant in ‘Single Mobile’ (Z = -0.227, p motion (angular speed of 4.78°/sec). The target’s
angular speed increased across trials (from 9.57°/sec to 95.68°/sec), crossing the screen from 6 to 50 times per trial, depending on the target’s speed within a trial. The participants scored when presenting the same behavior as described in Task 2.
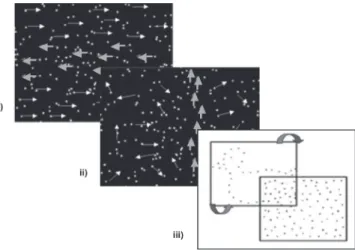
Figure 2 – Motion Coherence tasks: i.) Task 4. ‘Direction Change’; ii.) Task 5. ‘Dot %’; and iii.) Task 6. ‘Form from Motion’.
Task 4. ‘Speed of Coherent Motion Direction Change’ All point light dots moved coherently from left to right. After 2 sec, a horizontal band of point lights changed direction (one direction change per trial). This band (7.42cm high) was centered on the screen and corresponded to 33% of the dot total. The background and band’s displacement speed was identical and increased across trials (from 0.06°/ sec to 47.84°/sec). The participants scored when presenting either index pointing, verbal response or ocular saccades in the correct direction, during the band direction change.
Task 5. ‘Percentage of Motion Coherence’
A percentage of point light dots was vertically and coherently displaced at a constant speed (4.78°/sec) over a background of random moving dots. The coherent point lights composed a column extending from the bottom to the top of the screen. The percentage of point lights (from 1% to 15% of the point light total), the column width and eccentricity, varied from trial to trial. The participants scored either when pursuing the target with their index finger or presenting ocular-cephalous pursuit of the target column.
Task 6. ‘Form from Motion’
Black doted contours of a duck, house, fish, and face, drawn on a transparency were overlapped with
> 0.05) nor in ‘Single Mobile over Moving Dots’ (Z = -1.193, p > 0.05). WS scores were significantly lower than ControlWS group scores in the, ‘Collision’ Task, (Z = -2.035, p < 0.05) and the 3 Motion Coherence tasks (‘Direction Change’, Z = -3.669, p < 0.001; ‘Dot
%’, Z = -4.468, p < 0.001; ‘Form From Motion’, Z = -3.392, p < 0.001).
Kendall τ between age and score showed no significant correlation in the ASD group. Correlation between age and score in the WS group was sig-nificant only in task 2 (Kendall τ = .88, p < 0.05). Individual Analysis
To investigate inter-task and inter-individual per-formance variability across each clinical group, we standardized scores. Each child with ASD or WS was matched with a control group composed of 10 slightly younger TD children (see Tables I and II). For each child with ASD or WS a calibrated score was computed Calibrated Score = xScore – Matched Control Mean Score
Matched Control SD , where
SD = 0, it was replaced by SD = 1). Each child’s (ASD or WS) calibrated score at each task was thus situated either within a normal range (Calscore > -1), within a mild deficit area (-2 > Calscore ³ -1), or within an abnormal area (Calscore ≤ - 2).
Figure 3 – Mean scores for Single Target tasks and Motion Coherence tasks for both clinical groups (ASD and WS) and chronological age-matched control groups. ‘Form from Motion’ task scores were converted to fit the same scale. Standard error bars are included. Significant differences are indicated by * for (p < .05) and ** (p < .01) using the Mann-Whitney U test.
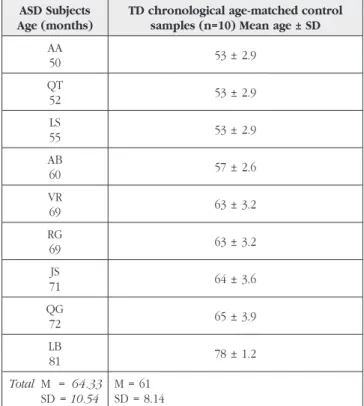
Table I – Characteristics of the ASD sample and comparison groups used for computing the calibrated scores (see text) for individual analysis.
ASD Subjects Age (months)
TD chronological age-matched control samples (n=10) Mean age ± SD
AA 50 53 ± 2.9 QT 52 53 ± 2.9 LS 55 53 ± 2.9 AB 60 57 ± 2.6 VR 69 63 ± 3.2 RG 69 63 ± 3.2 JS 71 64 ± 3.6 QG 72 65 ± 3.9 LB 81 78 ± 1.2 Total M = 64.33 SD = 10.54 M = 61 SD = 8.14
can be detected. Not all children with ASD show a deficit in motion coherence tasks. Two children perform within the normal range in all three Motion
Coherence tasks. Children with ASD performance was consistently deficient at the ‘Single mobile’ (task 2). Two way dissociations between performance at
Single Target Tasks and Motion Coherence tasks are observed. One such dissociation involves preser-vation of ‘Form from motion’ in tandem with mild or severe deficient sensitivity to motion coherence. The inverse pattern is also observed.
WS individual analysis
WS children do not all exhibit the same pattern of weaknesses (Table IV). Two children perform normally or with mild deficit in all tasks. Single target tasks might be easier for these children than the motion coherence tasks: 6 children perform normally or with a mild deficit in the three single targets whilst failing all or some of the Motion Coherence tasks. Preserved performance in Single Target tasks (Tasks 1 to 3) can be associated with a deficit in
Motion Coherence.
Contrary to children with ASD, a majority of children with WS are able to detect a single mobile correctly when static noise is added (Task 2). Like in the ASD group, children with WS are capable of pursuing a target and detecting collision when a single target is displaced at a relatively slow speed (Task1).
ASD individual analysis
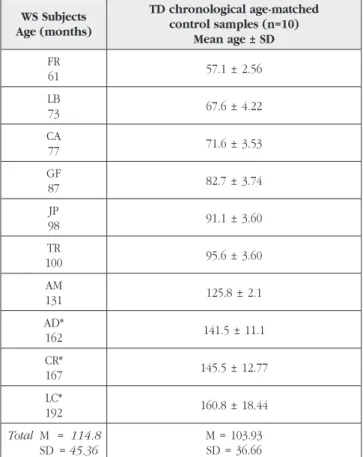
Table III shows that no hierarchical organization of the response patterns according to age or task Table II – Characteristics of the WS sample and comparison
groups used for computing the calibrated scores (see text) for individual analysis.
WS Subjects Age (months) TD chronological age-matched control samples (n=10) Mean age ± SD FR 61 57.1 ± 2.56 LB 73 67.6 ± 4.22 CA 77 71.6 ± 3.53 GF 87 82.7 ± 3.74 JP 98 91.1 ± 3.60 TR 100 95.6 ± 3.60 AM 131 125.8 ± 2.1 AD* 162 141.5 ± 11.1 CR* 167 145.5 ± 12.77 LC* 192 160.8 ± 18.44 Total M = 114.8 SD = 45.36 M = 103.93 SD = 36.66
* Younger children were chosen because all TD children had achieved ceiling performance by 12 years of age.
Table IV – Individual performance data at all motion tasks for WS group. Calibrated scores are divided into 3 categories : √ = normal performance (Calscore > -1SD); - = mildly deficient performance (-2SD < Calscore < -1SD), -- = deficient performance (Calscore < -2SD).
WS Subjects CA (months) Task 1 Collision Task 2 SM Task 3 SM over MD Task 4 MC DC Task 5 MC Dot % Task 6 FFM FR 61 -- √ - -- - -LB 73 √ √ √ - - --CA 77 √ -- -- -- -- --GF 87 √ √ √ √ - √ JP 98 √ -- √ √ -- √ TR 100 √ √ √ - -- √ AM 131 √ √ √ √ - √ AD 162 √ √ - -- -- --CR 167 -- √ -- -- -- √ LC 192 √ - √ -- -- √
Table III – Individual performance data at all motion tasks for ASD Group. Calibrated scores are divided into 3 categories: √ = normal performance (Calscore > -1SD), - = mildly deficient performance (-2SD < Calscore < -1SD), -- = deficient performance (Calscore < -2SD).
ASD Subjects CA (months) Task 1 Collision Task 2 SM Task 3 SM over MD Task 4 MC DC Task 5 MC Dot % Task 6 FFM AA 50 √ -- - -- - --QT 52 -- -- - √ - --LS 55 √ -- √ √ - √ AB 60 √ - - √ √ √ RG 69 -- - √ -- - √ VR 69 √ -- - - - --JS 71 √ - √ √ √ √ QG 72 √ - -- - -- --LB 81 √ -- √ - --
-deficit in motion detection, even when considering a wider range of responses.
VM detection studies traditionally use Motion
Coherence, Direction Change and Biological Motion tasks (Braddick et al., 2000; Welchman & Harris, 2000; Zanker & Braddick, 1999) to assess VM deficits. These studies produced findings that systematically suggested that ASD and WS groups present motion detection deficits (Atkinson et al., 1997; Jordan et al., 2002; Milne et al., 2002; Spencer et al., 2000). Albeit an important instance of VM detection, Motion
Coherence thresholds do not entail all of motion detection components, but those that mainly require preattentive processes (pop-out phenomena). Besi-des these traditional tasks, we used tasks to assess singleton detection in simple to complex situations requiring the ability to direct visual attention. Task 2 required serial search, involving the magnocellular pathway (Cheng et al., 2004), given the target’s slow speed did not trigger a pop-out effect. It is proba-ble that vision processes might require interaction between preattentive and attentive mechanisms (Baloch & Grossberg, 1997). Taking these principles into consideration, the six tasks used here, required different attentional resources in accordance with target speed and background noise. Most children with WS were able to detect the moving target in Task 2 showing that their deficit in Motion Coherence tasks does not result from a deficit in engaging attention or in serial search. It is possible that the contrast between children with WS and ASD in Task 2 be due to the younger age of children with ASD. Nevertheless, the youngest children with WS did not all show a deficit in task 2.
The wide variability in performance observed across the VM tasks suggests that poor performance in VM tasks arises from attention deficits together with a poor sensitivity to VM. This suggestion would hold more for children with ASD than for children with WS.
Conclusion
We investigated deficit patterns in VM detection in children with ASD and WS and whether the deficits in sensitivity to motion could be generalized to each clinical group (i.e. belonging to a clinical group would suffice to present a certain pattern of performance in VM detection tasks).
We confirm that children with ASD and WS present deficits in VM sensitivity. These motion deficits are not all-encompassing. We showed that deficits in In agreement with Atkinson et al.’s (1997) findings,
all children with WS show a severe or mild deficit in Task 5. However, in Task 4 and Task 6, half of the children show normal or mildly abnormal per-formances. In the ‘Form from Motion’ task, children from 4 to 7 years of age have mixed performances in the ASD group, whereas all three children with WS up to 7 years of age present severe or mild deficits. Dissociation between performances in ‘Form
from motion’ and the two other Motion Coherence tasks is observed here as it was with ASD children.
Discussion
The group analysis showed that performance at all, except two tasks, is significantly better for chronological age-matched controls than for the clinical groups. The exceptions are Task 2 and 3 for children with WS, and task 3 for children with ASD. As a group, WS do not seem to present difficulties in single dot detection when in presence of either mild (Task2) or strong interference (Task 3). The ASD group perform like TD children in single dot detection in presence of strong interference (Task 3) but not in presence of mild interference (Task 2). The enormous inter-individual variability within each clinical group was investigated using calibrated scores. Only in two tasks, did we observe a stronger cohesion in deficient scoring across each group: in single dot pursuit in presence of mild interference (Task 2) for children with ASD, and in detection of coherent dot clusters in presence of noise (Task 5) for children with WS. These differences might reflect a different basis for the deficits that characterize these two phenotypes. This is consistent with the differences between perceptual deficits described in these two clinical groups (e.g. Brock et al., 2002; Brosnan et al., 2004; Deruelle et al., 1999; Frith & Happé, 1994).
Our results replicate previous findings showing preservation of ‘Form from motion’ in children with WS (and one child with ASD), associated with a deficit in the remaining Motion Coherence tasks (Atkinson et al., 1997; Mendes et al., 2005; Reiss et al., 2005). Neither preservation nor deficit in ‘Form from motion’ detection can be considered as a systematic feature of ASD or WS perception competences.
In previous studies, dorsal stream function deficits in both ASD and WS have been associated to deficits in motion detection (Atkinson et al., 1997; Spencer et al., 2000). Our results confirm the existence of a
her invaluable remarks on the earlier drafts of this paper.
References
1. Abreu, A.M., & Happé, F. (2005). Perceiving ASD through the motions.
Current Psychology of Cognition, 23(1-2), 35-43.
2. Abreu, A.M., de Schonen, S., & Happé, F. (in preparationa). Motion perception and social cognition in Autism: Speed selective impairments in socio-conceptual processing?
3. Abreu, A.M., de Schonen, S., & Happé, F. (in preparationb). Low-level perception and social cognition in Autism: Are perceptual and socio-conceptual processes related?
4. Atkinson, J., Braddick, O., Rose, F. E., Searcy, Y. M., Wattam-Bell, J., & Bellugi, U. (2006). Dorsal-stream motion processing deficits persist into adulthood in Williams syndrome. Neuropsychologia, 44(5), 828-833. 5. Atkinson, J., King, J., Braddick, O., Nokes, L., Anker, S., & Braddick, F.
(1997). A specific deficit of dorsal stream function in Williams’ syndrome.
Neuroreport, 8(8), 1919-1922.
6. Baloch, A.A., & Grossberg, S. (1997). A neural model of high-level motion processing: Line motion and formotion dynamics. Vision
Research, 37(21), 3037-3059.
7. Baron-Cohen, S., Leslie, A.M., & Frith, U. (1985). Does the autistic child have a “theory of mind”?. Cognition, 21(1), 37-46.
8. Bassili, J.N. (1978). Facial motion in the perception of faces and of emotion expression. Journal of Experimental Psychology, 4(3), 373-379. 9. Bertone, A., Mottron, L., Jelenic, P., & Faubert, J. (2003). Motion per-ception in autism: A “complex” issue. Journal of Cognitive Neuroscience,
15(2), 218-225.
10. Blake, R., Turner, L.M., Smoski, M.J., Pozdol, L.S., & Stone, W. (2003). Visual recognition of biological motion is impaired in children with autism. Psychological Science, 14(2), 151-157.
11. Braddick, O.J., O’Brien, J. M., Wattam-Bell, J., Atkinson, J., & Turner, R. (2000). Form and motion coherence activate independent, but not dorsal/ventral segregated, networks in the human brain. Current
Biology, 10(12), 731-734.
12. Brock, J., Brown, C.C., Boucher, J., & Rippon, G. (2002). The temporal binding deficit hypothesis of autism. Development and Psychopathology, 14(2), 209-224.
13. Brosnan, M.J., Scott, F.J., Fox, S., & Pye, J. (2004). Gestalt processing in autism: Failure to process perceptual relationships and the implications for contextual understanding. Journal of Child Psychology Psychiatry,
45(3), 459-469.
14. Brown, J.H., Johnson, M.H., Paterson, S.J., Gilmore, R., Longhi, E., & Karmiloff-Smith , A. (2003). Spatial attention in toddlers with Williams syndrome and Down syndrome. Neuropsychologia, 41, 1037-1046. 15. Castelli, F., Frith, C., Happé, F., & Frith, U. (2002). Autism, Asperger
syndrome and brain mechanisms for the attribution of mental states to animated shapes. Brain, 125(8), 1839-1849.
16. Cheng, A., Eysel, U.T., & Vidyasagar T.R. (2004). The role of the magno-cellular pathway in serial deployment of visual attention. European
Journal of Neuroscience, 20: 2188-2192.
17. Deruelle, C., Mancini, J., Livet, M. O., Casse-Perrot, C., & de Schonen, S. (1999). Configural and local processing of faces in children with Williams syndrome. Brain and Cognition, 41(3), 276-298.
18. Frith, U., & Happé, F. (1994). Autism: Beyond “theory of mind”. Cognition,
50(1-3), 115-132.
19. Gepner, B. (2002). Rapid visual-motion integration deficit in autism.
Trends in Cognitive Sciences, 6(11), 455.
single mobile tracking might coexist with good performance at more complex motion coherence tasks and vice versa. In the future, the use of motion coherence tasks to infer on general performance in motion sensitivity should be addressed with caution.
We did not find a low-level deficit pattern common to each clinical group. We did find a general lower performance in Task 2 for children with ASD and in Task 5 for children with WS. It would be interesting to investigate these tendencies further, for they might constitute foundation for the different visual deficits in ASD and WS described in the literature.
Children belonging to the same clinical group did not all present the same deficits (and, if at one task, at all the others). This suggests that deficits in motion detection might not result from a simple abnormal development of the VM sensitivity pathways but from the abnormal development of their connections with the attentional networks. Top-down and bottom up neurobiological cascades could give rise to low level disorders that, in turn, influence social cognitive development. It is possible that a genetic basis (extension of the deletion) in WS might account for the variability found. The variability found in ASD might be correlated with the placement on the social spectrum (Abreu et al., in preparationa; Abreu et al., in preparationb).
Both groups of children present several dis-sociations. In the future, inter-task variability should be looked into to investigate these differences and dissociations further. Two kinds of studies might help to clarify the situation: Longitudinal studies would help to understand the lack of developmental trends observed in our study; and motion detection tasks coupled with ERP recordings might help to define the levels of integration where the cortical abnormality might be situated.
Acknowledgements
This work was supported by a grant from the
Fundação para a Ciência e Tecnologia, SFRH/ BD/6020/2001 to the first author, and by CNRS funding to the last author. We would like to ack-nowledge the participants, parents and Institutions that collaborated with us. We would also like to thank: Sylvain Mottet for his critical technical help in building the stimuli; Alain Verloes and Nathalie Blanc for their help in contacting the children and Agathe Laurent for her vital participation in the field work. We are also grateful to Francesca Happé for
20. Gepner, B., & Mestre, D. R. (2002). Brief report: Postural reactivity to fast visual motion differentiates autistic from children with asperger syndrome. Journal of Autism Developmental Disorders, 32(3), 231-238. 21. Gepner, B., Mestre, D., Masson, G., & de Schonen, S. (1995). Postural effects of motion vision in young autistic children. Neuroreport, 6(8), 1211-1214.
22. Jordan, H., Reiss, J.E., Hoffman, J.E., & Landau, B. (2002). Intact perception of biological motion in the face of profound spatial deficits: Williams syndrome. Psychological Science, 13(2), 162-167.
23. Mendes, M., Silva, F., Simões, L., Jorge, M., Saraiva, J., & Castelo-Branco, M. (2005). Visual magnocellular and structure from motion perceptual deficits in a neurodevelopmental model of dorsal stream function.
Cognitive Brain Research, 25(3), 788-798.
24. Milne, E., Swettenham, J., & Campbell, R. (2005). Motion perception and autistic spectrum disorder: A review. Current Psychology of Cognition,
23(1-2), 3-33.
25. Milne, E., Swettenham, J., Hansen, P., Campbell, R., Jeffries, H., & Plaisted, K. (2002). High motion coherence thresholds in children with autism.
Journal of Child Psychology and Psychiatry, 43(2), 255-263.
26. Moore, C. (2006). Modeling the development of gaze following needs attention to space. Developmental Science, 9(2), 149-150.
27. Mottron, L., Burack, J. A., Stauder, J. E., & Robaey, P. (1999). Perceptual processing among high-functioning persons with autism. Journal of
Child Psychology and Psychiatry, 40(2), 203-211.
28. Nakamura, M., Kaneoke, Y., Watanabe, K., & Kakigi, R. (2002). Visual information process in williams syndrome: Intact motion detection accompanied by typical visuospatial dysfunctions. European Journal
of Neuroscience, 16(9), 1810-1818.
29. Ozonoff, S., Pennington, B.F., & Rogers, S.J. (1991). Executive function deficits in high-functioning autistic individuals: Relationship to theory of mind. Journal of Child Psychology and Psychiatry, 32(7), 1081-1105. 30. Palomares, M., Landau, B., Egeth, H., & Hoffman, J. (2003). Collinear
inhibition in Williams Syndrome? [Abstract]. Journal of Vision, 3(9), 667a. 31. Pellicano, E., & Gibson, L.Y. (2008). Investigating the functional integrity of the dorsal pathway in autism and dyslexia. Neuropsychologia, 46(10), 2593-2596.
32. Reiss, J.E., Hoffman, J.E., & Landau, B. (2005). Motion processing spe-cialization in williams syndrome. Vision Research, 45(27), 3379-3390. 33. Spencer, J., O’Brien, J., Riggs, K., Braddick, O., Atkinson, J., & Wattam-Bell,
J. (2000). Motion processing in autism: Evidence for a dorsal stream deficiency. Neuroreport, 11(12), 2765-2767.
34. Sullivan, K., & Tager-Flusberg, H. (1999). Second-order belief attribution in williams syndrome: Intact or impaired?. American Journal of Mental
Retardation, 104(6), 523-532.
35. Tager-Flusberg, H., & Sullivan, K. (2000). A componential view of theory of mind: Evidence from williams syndrome. Cognition, 76(1), 59-90. 36. Triesch, J., Teuscher, C., Deák, G.O., & Carlson, E. (2006). Gaze following:
Why (not) learn it? Developmental Science, 9(2), 125-147.
37. Welchman, A.E., & Harris, J.M. (2000). The effects of dot density and motion coherence on perceptual fading of a target in noise. Spatial
Vision, 14(1), 45-58.
38. Zanker, J.M., & Braddick, O.J. (1999). How does noise influence the estimation of speed? Vision Research, 39(14), 2411-2420.