D
systematics and
ecology to advance
the conservation of
freshwater mussels
(Bivalvia: Unionida)
Manuel Peixoto de Magalhães Lopes Lima
Doutoramento em Biodiversidade, Genética e Evolução
Departamento de Biologia 2020
Orientador
Pedro Beja
CIBIO/InBIO, Laboratório Associado, Universidade do Porto
Coorientador
Ana Filipa Filipe
Acknowledgments
This dissertation would not be possible without the help of my family that was supportive in so many ways to my “lunacy” in pursuing such an “extraordinary” research field such as biology and conservation of molluscs. I would like to thank to my supervisors for the help and critical analyses on the development of the thesis and to all of the members of the “Brave Mussel Warriors” team that cooperated and worked with me in so many hours of field and laboratory work, as well as in the writing and elaboration of the manuscripts. Additionally, this work would not be possible without the participation of all the co-authors of the manuscripts.
Abstract
The world is currently experiencing a biodiversity crisis, with many species facing the risk of extinction. This is particularly true for those in freshwater habitats, which are isolated between land and sea, and generally more exposed to human activities. Therefore, many freshwater groups of animals are now threatened with extinction and requiring urgent conservation measures. However, most current conservation efforts remain directed to charismatic terrestrial vertebrates, like mammals and birds. Although invertebrates dominate on Earth both in species richness and biomass, knowledge about these taxa is scarce and many groups need urgent conservation attention. This is the case of freshwater bivalves of the Unionida order, also known as freshwater mussels (FM). These bivalves are strictly freshwater inhabitants and originally dominated many freshwater habitats across the planet. They are important for the aquatic ecosystem functioning, playing key ecological roles and providing important ecosystem services to humans. They are also very interesting from the biological point of view, having a series of interesting traits that allow them to live in running water, like internal fertilization and parental care of their larvae. Especially, they have a unique life cycle in which FM larvae need to attach to a host (generally a fish) until adulthood, for nutrition but mainly for upstream dispersion. Another interesting feature is their rare form of mitochondrial inheritance, also called doubly uniparental inheritance (DUI), where the males inherit mitochondria from both parents. Male M- and female F-type mitochondrial lineages are highly divergent and are remarkable for the study of mtDNA evolution.
The overarching goal of this dissertation is to advance the conservation biology of freshwater mussels by combining research on phylogeny, systematics and ecology, showing how the integration of multiple research fields has practical implications to preserve highly endangered taxa. Specifically, the dissertation aims to: (i) understand the geographical diversity and conservation status patterns of freshwater bivalves, disclosing their main threats, and needs for conservation and research; (ii) highlight and discuss the importance of basic biological studies for the conservation of freshwater mussels; and (iii) accurately define species and integrate evolutionary patterns into conservation planning.
In Chapter 1, I start by introducing the global decline of biodiversity, focusing primarily on freshwater taxa and especially on the target taxonomic group of the dissertation, the freshwater mussels (FM). Then, their high ecological and economic importance are highlighted, as well as their unique biological features. I also discuss the importance of integrating basic research on species biology, taxonomy and phylogenetic patterns for conservation. Finally, the chapter presents the general and specific objectives of the thesis.
In Chapter 2, the geographical diversity patterns of freshwater bivalves were revised and their conservation status, threats, and the main needs for conservation and research are
analysed, the most threatened by far are FMs, which support the main focus of the following chapters. We show that freshwater mussel diversity is geographically heterogeneous with two main hotspots of diversity, the Mississippi basin and associated basins in central North America, and the Indotropical rivers in Southeast Asia. The main global threats are associated with habitat degradation, while the most mentioned research needs globally refer to the need to collect baseline information on distribution, taxonomy, abundance, life-history traits, and threats. In terms of the needed conservation measures, protection and management of freshwater habitats are the most cited
The lack of baseline biological information identified in Chapter 2 is then addressed in
Chapter 3, which provides a baseline study on the Iberian dolphin mussel Unio delphinus. Chapter 3 highlights the importance of basic biological studies for conservation planning and
the potential use of biological traits as environmental indicators. For this, the distribution, growth, host-fish range and reproductive cycle of this species are described and discussed.
Unio delphinus occupies the western Iberian River basins and, contrary to other well-known
European FM species, is found to grow fast and to be short-lived. Their larvae may attach to most co-occurring fish species, but only native species were effective hosts. Based on these results, we reassessed its conservation status and provide recommendations on key conservation measures.
In Chapters 4-8 the phylogenetic relationships among important groups of FMs are estimated and analysed, thereby addressing the need to accurately define conservation and management units, and to include evolutionary patterns in conservation planning. In Chapters
4 and 6, we estimated with a small number of molecular markers, the most comprehensive
phylogenies so far for the most representative families of FMs in the northern hemisphere, the species-rich Unionidae and the threatened Margaritiferidae. The systematics and taxonomy within these families are updated with the help of an exhaustive search for diagnostic and synapomorphic, ecological and morphological characters. The distribution of the main groups inside those families is mapped and their biogeographic patterns discussed.
Chapter 5 focuses on a contentious group of North American species, that were
originally lumped in a single genus, i.e. Quadrula sensu lato. We estimated its phylogeny and used molecular species delineation methods complemented by the assessment of ecological, morphological, and anatomical traits to revise the systematics and taxonomy of these species. Then we provide conservation guidance based on these results.
In Chapters 7 and 8, we updated the phylogenies within the Unionidae, this time with a multi-locus approach using whole mitogenomes. Given that many groups of FMs lack morphological diagnostic characters, it is important to develop new features that help us to characterize the main evolutionary history of FMs. The mitochondrial genome gene
arrangement is generally very conserved across taxa and eventual shifts in this order are rare in many taxa. In chapters 7 and 8 we also explored the use of mitogenome orders to be used as diagnostic of the higher-order taxonomic groups within FMs.
The present dissertation brings important advances in the basic biology, phylogeny, biogeography, and conservation of FMs globally. It presents more clear evolutionary relationships and biogeographical patterns among the main FM groups and highlights the biodiversity hotspots or areas where their levels of extinction risk, and species richness and genetic diversity are higher. Finally, this dissertation identifies the main knowledge gaps and threats for FM species to guide future research and conservation actions.
Keywords
Biogeography, Bivalvia, Conservation, Distribution, Doubly uniparental inheritance,
Freshwater mussels, Growth, Host fish, Macroevolution, Mollusca, Phylogeny, Reproductive cycle, Species delineation, Taxonomic classification, Unio delphinus.
Resumo
A biodiversidade mundial está atualmente em crise, com muitas espécies em risco de extinção. Isto é particularmente verdadeiro para os organismos que habitam ambientes de água-doce, pois encontram-se isolados entre o mar e a terra e geralmente mais expostos às atividades humanas. Devido a esta situação, muitos grupos de animais dulçaquícolas estão agora ameaçados de extinção sendo necessárias medidas urgentes para a sua conservação. No entanto, a maioria dos esforços de conservação são geralmente direcionados para as espécies de vertebrados mais carismáticas, tais como os mamíferos e as aves. Embora na Terra os invertebrados sejam dominantes, tanto em número de espécies quanto em biomassa, o conhecimento sobre estes grupos é escasso e muitos deles precisam de atenção urgente no que respeita à sua conservação. Este é o caso dos bivalves de água-doce da ordem Unionida, também conhecidos como mexilhões de água-doce (MAD). Este grupo de bivalves ocorre apenas em água-doce e devido às suas elevadas abundâncias originais foram durante muito tempo um dos grupos taxonómicos dominantes em habitats de água-doce de todo o planeta. Os MAD são importantes para o funcionamento dos ecossistemas aquáticos pois desempenham papéis ecológicos cruciais e fornecem importantes serviços ecossistémicos aos seres humanos. Os MAD são também muito interessantes sob o ponto de vista biológico. Eles apresentam uma série de características interessantes que lhes permitem viver em água corrente, tais como a fertilização interna e cuidados parentais das suas larvas mas especialmente, um ciclo de vida único no qual as suas larvas precisam de se ligar a um hospedeiro (geralmente um peixe) até à idade adulta, para a sua nutrição, mas principalmente para dispersão a montante. Outra característica interessante dos MAD é que possuem uma forma rara de herança mitocondrial, também chamada herança duplamente uniparental, onde os machos herdam as mitocôndrias de ambos os pais. Essas linhagens mitocondriais herdadas dos pais (tipo M) e das mães (tipo F) são altamente divergentes e são muito interessantes para o estudo da evolução do ADN mitocondrial.
O objetivo principal desta dissertação é aumentar o conhecimento atual para a conservação de mexilhões de água-doce, combinando filogenia, sistemática e ecologia e mostrar como a integração destes vários campos de investigação tem implicações importantes na preservação de organismos em risco de extinção. Especificamente, a presente dissertação visa: (i) representar geograficamente os padrões de diversidade e estatutos de conservação dos bivalves de água-doce, revelando as suas principais ameaças e necessidades de conservação e investigação; (ii) destacar e discutir a importância de estudos biológicos básicos para a conservação de mexilhões de água-doce; e (iii) integrar metodologias de delimitação de espécies e padrões evolutivos na planificação de ações de conservação.
Começo o Capítulo 1, por introduzir o declínio global da biodiversidade, concentrando-me principalconcentrando-mente nos taxa de água-doce e, principalconcentrando-mente, no grupo taxonómico alvo da dissertação, os mexilhões de água-doce (MAD). Destaco a seguir, a sua elevada importância ecológica e económica, bem como as suas características biológicas únicas. Discuto posteriormente a importância para a conservação de integrar estudos básicos sobre a biologia de espécies com a taxonomia e padrões filogenéticos. Finalmente, o capítulo apresenta os objetivos gerais e específicos da tese.
No Capítulo 2, são revistos os padrões de diversidade geográfica dos bivalves de água-doce, os seus estatutos de conservação, bem como analisadas e discutidas as suas principais ameaças e as necessidades mais prementes para a sua conservação e investigação. O Capítulo 2 revela que, dentre os vários grupos de bivalves de água-doce analisados, de longe os mais ameaçados são os MAD, que são o foco principal dos capítulos seguintes. Mostramos que a diversidade de mexilhões de água-doce é geograficamente heterogénea, com dois “hotspots” de diversidade: a bacia do Mississippi e sub-bacias associadas no centro da América do Norte e os rios Indotropicais no sudeste Asiático. As principais ameaças globais aos MAD estão associadas principalmente à degradação do habitat, enquanto os campos de investigação mais mencionados são a necessidade de obter informações básicas sobre a sua distribuição, taxonomia, abundância, e características da história de vida, bem como sobre as suas principais ameaças. Em termos das medidas de conservação necessárias, as mais citadas são a proteção e o a gestão sustentável dos habitats de água-doce que ocupam.
A falta de informação biológica básica identificada no Capítulo 2 é então abordada no
Capítulo 3, através de estudos sobre o MAD ibérico Unio delphinus. O capítulo 3 destaca a
importância de estudos biológicos básicos para a conservação e o uso potencial de algumas características biológicas como indicadores ambientais. Para esse efeito, caracterizamos e analisamos a sua distribuição, crescimento, gama de peixes hospedeiros e ciclo reprodutivo. O Unio delphinus ocupa as bacias ocidentais da Península Ibérica e, ao contrário de outras espécies europeias de MAD mais estudadas, cresce rapidamente e tem vida curta. As suas larvas conseguem afixar-se à maioria das espécies de peixes que ocorrem em simpatria, mas apenas as espécies de peixes nativos se revelaram hospedeiros eficazes. Com base nestes resultados, reavaliamos os seu estatuto de conservação e fornecemos recomendações sobre as principais medidas para a sua conservação.
Nos Capítulos 4-8 foram estimadas e analisadas as relações filogenéticas entre grupos importantes de MAD, destacando também a necessidade de definir com precisão eventuais unidades de conservação e gestão e de incluir os padrões evolutivos encontrados, na sua conservação. Com um pequeno número de marcadores moleculares estimámos, nos
espécies, e a Margaritiferidae que contem o maior número de espécies ameaçadas. A sistemática e a taxonomia dessas famílias foi também atualizada com a ajuda de uma investigação exaustiva aos seus caracteres diagnósticos e sinapomórficos, ecológicos e morfológicos. A distribuição dos principais grupos dentro dessas famílias foi também mapeada e os seus padrões biogeográficos discutidos.
O Capítulo 5 concentra-se num grupo polémico de espécies norte-americanas, originalmente agrupadas num único género, ou seja, Quadrula sensu lato. Estimamos a sua filogenia e revemos a sistemática e taxonomia dessas espécies usando métodos moleculares de delimitação de espécies, complementados pela avaliação de características ecológicas, morfológicas e anatómicas. Em seguida, fornecemos orientações para a sua conservação com base nesses resultados.
Nos Capítulos 7 e 8, atualizamos as filogenias dentro dos Unionidae, desta vez com uma abordagem com vários loci usando mitogenomas inteiros. Dado que muitos grupos de MAD carecem de caracteres-diagnóstico morfológicos, é importante desenvolver outros caracteres que nos ajudem a descrever a sua história evolutiva. A ordem em que os genes estão dispostos no genoma mitocondrial é geralmente muito conservado entre muitos grupos taxonómicos sendo que eventuais mudanças nessa ordem são geralmente raras. Nos
Capítulos 7 e 8, exploramos então o uso das ordens genéticas dos mitogenomas como
diagnóstico dos principais grupos taxonómicos de MAD.
A presente dissertação providencia importantes avanços para a biologia básica, filogenia, biogeografia e conservação de MAD a nível global. Clarifica as relações evolutivas e os padrões biogeográficos entre os principais grupos de MAD, destacando os seus ‘hotspots’ de diversidade. Por fim, esta dissertação identifica as principais lacunas no conhecimento e as ameaças para as espécies de MAD de forma a orientar ações futuras de investigação e conservação.
Palavras-chave
Biogeografia, Bivalvia, Conservação, Ciclo reprodutivo, Classificação taxonómica, Crescimento, Delimitação de espécies, Distribuição, Filogenia, Herança duplamente uni parental, Macroevolução, Mexilhões de água-doce, Moluscos, Peixe hospedeiro, Unio
Table of Contents
ACKNOWLEDGMENTS I ABSTRACT III KEYWORDS V RESUMO VI PALAVRAS-CHAVE VIII TABLE OF CONTENTS XINDEX OF FIGURES AND TABLES XIII
LIST OF ABBREVIATIONS XXVII
CHAPTER 1. General introduction 1
1.1 The freshwater biodiversity crisis 1 1.2 Freshwater mussel diversity, importance, and conservation 3 1.3 The need for baseline biological research 6 1.4 Defining species boundaries and integrating phylogenetic diversity patterns in
conservation ranking 7
1.5 Objectives 8
1.6 Thesis structure 9
1.7 References 11
CHAPTER 2. Freshwater bivalves’ conservation, diversity, and research 18
Paper 1. Conservation of freshwater bivalves at the global scale: diversity, threats and research needs. Lopes-Lima M, Burlakova LE, Karatayev AY, Mehler K, Seddon M,
Sousa R. Hydrobiologia 810, 1-14 (2018).
DOI: 10.1007/s10750-017-3486-7 19
CHAPTER 3. Basic biological traits of Unio delphinus 41
Paper 2. Setting the stage for new ecological indicator species: a holistic case study on the Iberian dolphin freshwater mussel Unio delphinus Spengler, 1793. Lopes-Lima
M, Hinzmann M, Varandas S, Froufe F, Reis J, Moreira C, Araujo S, Miranda F, Gonçalves DV, Beja P, Sousa R, Teixeira A. Ecological Indicators 111, 105987 (2020).
CHAPTER 4. Phylogeny of the family Unionidae 83
Paper 3. Phylogeny of the most species-rich freshwater bivalve family (Bivalvia: Unionida: Unionidae): Defining modern subfamilies and tribes. Lopes-Lima M, Froufe
E, Do VT, Ghamizi M, Mock KE, Kebapçi Ü, Klishko O, Kovitvadhi S, Kovitvadhi U, Paulo OS, Pfeiffer JM, Raley M, Riccardi N, Şereflişan H, Sousa R, Teixeira A, Varandas S, Wu X, Zanatta DT, Zieritz A, Bogan AE. Molecular Phylogenetics and
Evolution 106, 174-191 (2017).
DOI: 10.1016/j.ympev.2016.08.021 84
CHAPTER 5. Phylogeny, taxonomy and species of the genus Quadrula 148
Paper 4. Revisiting the North American freshwater mussel genus Quadrula sensu lato (Bivalvia Unionidae): Phylogeny, taxonomy and species delineation. Lopes-Lima M,
Burlakova L, Karatayev A, Gomes-Dos-Santos A, Zieritz A, Froufe E, Bogan AE.
Zoologica Scripta 48, 313-336 (2019).
DOI: 10.1111/zsc.12344 149
CHAPTER 6. Phylogeny of the family Margaritiferidae 277
Paper 5. Expansion and systematics redefinition of the most threatened freshwater mussel family, the Margaritiferidae. Lopes-Lima M, Bolotov IN, Tu DV, Aldridge DC,
Fonseca MM, Gan HM, Gofarov MY, Kondakov AV, Prié V, Sousa R, Varandas S, Vikhrev IV, Teixeira A, Wu R-W, Wu X, Zieritz A, Froufe E, Bogan AE. Molecular
Phylogenetics and Evolution 127, 98-118 (2018).
DOI: 10.1016/j.ympev.2018.04.041 278
CHAPTER 7. First male whole mitogenome of a Margaritiferidae species 360
Paper 6. The first Margaritiferidae male (M-type) mitogenome: mitochondrial gene order as a potential character for determining higher-order phylogeny within Unionida (Bivalvia). Lopes-Lima M, Fonseca M, Aldridge Dc, Bogan A, Gan Hm, Ghamizi M,
Sousa R, Teixeira A, Varandas S, Zanatta D, Zieritz A, Froufe E. Journal of Molluscan
Studies 83, 249-252 (2017).
DOI: 10.1093/mollus/eyx009 361
Paper 7. Mesozoic mitogenome rearrangements and freshwater mussel (Bivalvia: Unionoidea) macroevolution. Froufe F, Bolotov I, Aldridge DC, Bogan AE, Breton S,
Gan HM, Kovitvadhi U, Kovitvadhi S, Riccardi N, Secci-Petretto G, Sousa R, Teixeira A, Varandas S, Zanatta D, Zieritz A, Fonseca MM, Lopes-Lima M. Heredity 124, 182-196 (2020).
DOI: 10.1038/s41437-019-0242-y 372
CHAPTER 9. General Discussion 404
9.1 Main claims and highlights of the dissertation 404 9.2 Freshwater mussel hotspots, main threats, and conservation needs 404 9.3 Linking systematics and phylogeny with conservation 406 9.4 Future research perspectives and conservation implications 409
Index of Figures and Tables
CHAPTER 1. General introduction
Figure 1. Size of the world human population over the last 12,000 years. Adapted from
Roser et al (2019). 1
Figure 2. Changes of Gross domestic product (GDP), domestic material consumption, and extraction of living biomass (trillion USD at 2010 value) for groups of countries at distinct development levels. Adapted from IPBES (2019). 2
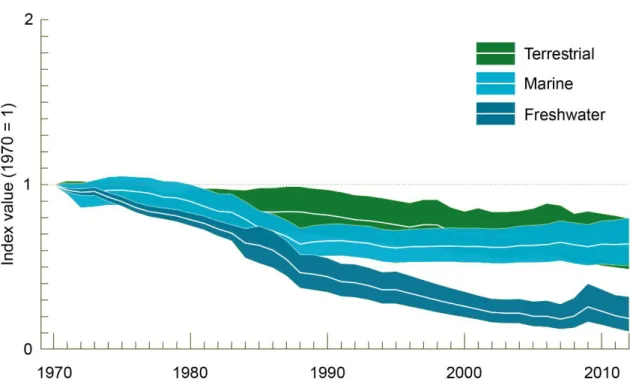
Figure 3. Evolution of the Living Planet Index (LPI) over the last decades. LPI is a measure of the state of the world's biological diversity based on population trends of species from terrestrial, freshwater and marine habitats. Adapted from
WWF (2016). 3
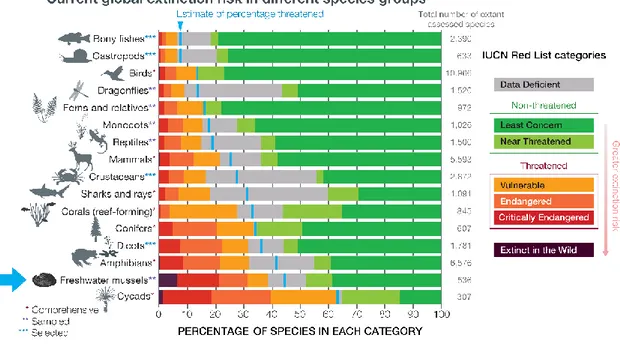
Figure 4. Current extinction risk in different species groups.
Adapted from IPBES (2019). 4
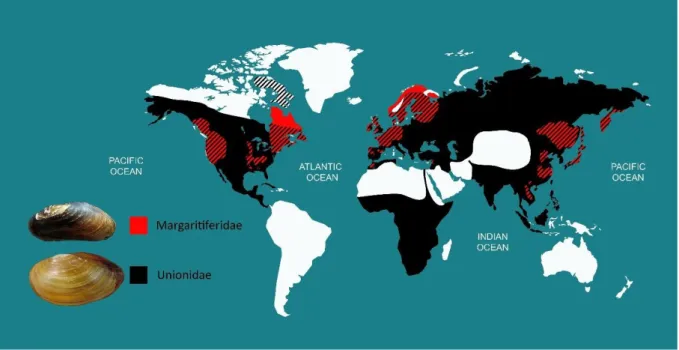
Figure 5. Global distribution map of the freshwater families Unionidae and Margaritiferidae. Adapted from Lopes-Lima et al (2017a, 2018). 5
Figure 6. Global distribution map of the freshwater families Iridinidae and Mulleriidae.
Adapted from Bogan (2008). 5
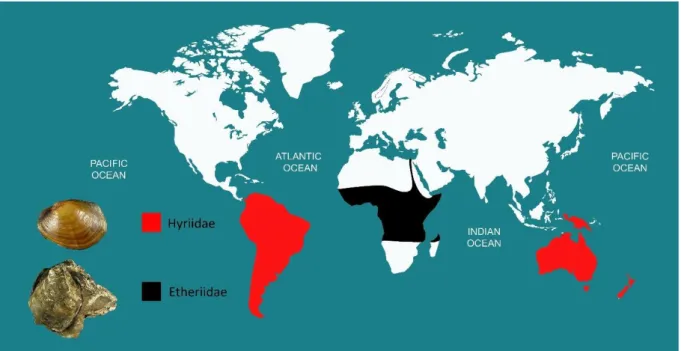
Figure 7. Global distribution map of the freshwater families Hyriidae and Etheriidae.
Adapted from Bogan (2008). 6
CHAPTER 2. Freshwater bivalves’ conservation, diversity, and research
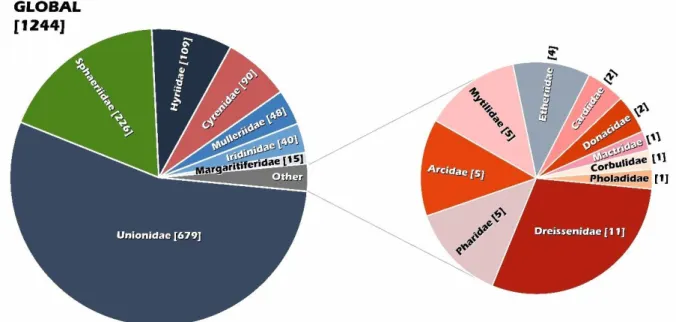
Figure 1. Global diversity of freshwater bivalves divided by families. The total number ofspecies in brackets. 21
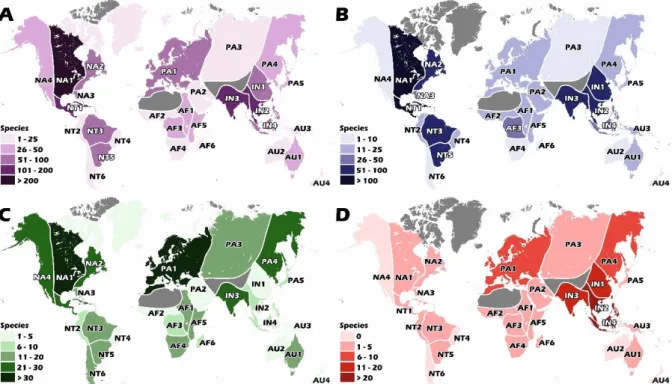
Figure 2. Diversity by ecoregions. A All freshwater bivalves; B Unionida; C Sphaeriidae;
D Cyrenidae + remaining freshwater bivalve groups. Ecoregions adapted from
Graf & Cummings (2007) and Haag (2010): NA Nearctic, NT Neotropical, PA Palaearctic, AF Afrotropical, IN Indotropical, AU Australasian. Glaciated and desert areas void of mussels in grey. 22
Figure 3. Diversity by ecoregions. A All freshwater bivalves; B Unionida; C Sphaeriidae;
D Cyrenidae + remaining freshwater bivalve groups. Ecoregion subdivisions
Glaciated and desert areas lacking FBs are in grey. 23
Figure 4. Taxonomic composition and diversity of freshwater bivalves in each ecoregion. The total number of species in brackets. 24
Figure 5. Map of IUCN Red List conservation status for Unionida freshwater mussels by ecoregions (bottom of the figure) and global conservation status for freshwater bivalves and each major freshwater bivalve group (top of the figure). Ecoregion subdivisions adapted from Graf & Cummings (2007) and Haag (2010): NA Nearctic, NT Neotropical, PA Palaearctic, AF Afrotropical, IN Indotropical, AU Australasian. On the scale bar: NE Not evaluated by the IUCN Red List; and the IUCN Red List categories: DD data deficient, LC least concern, NT near threatened, VU vulnerable, EN endangered, CR critically endangered, CR (PE) critically endangered probably extinct, EX extinct. 25
Figure 6. IUCN Red List criteria used for the assessment of freshwater bivalve species by ecoregions. Ecoregion subdivisions adapted from Graf & Cummings (2007) and Haag (2010): AF Afrotropical, AU Australasian, IN Indotropical, NA Nearctic, NT Neotropical, PA Palaearctic. IUCN Red List criteria: A population size reduction, B geographic range, C small population size and decline, D very
small or restricted populations. 26
Figure 7. Main threats for freshwater bivalves recorded from the IUCN Red List database by ecoregions. Ecoregion subdivisions were adapted from Graf & Cummings (2007) and Haag (2010): NA Nearctic, NT Neotropical, PA Palaearctic, AF Afrotropical, IN Indotropical, AU Australasian. 27
Figure 8. Research needs for freshwater bivalves recorded from the IUCN Red List database by ecoregions. A All assessed species in the IUCN Red List; B data-deficient species in the IUCN Red List. Ecoregion subdivisions adapted from Graf & Cummings (2007) and Haag (2010): NA Nearctic, NT Neotropical, PA Palaearctic, AF Afrotropical, IN Indotropical, AU Australasian. DD data-deficient
species in the IUCN Red List. 28
Figure 9. Conservation needs for freshwater bivalves extracted from the IUCN Red List database by ecoregions. Ecoregion subdivisions adapted from Graf & Cummings (2007) and Haag (2010): NA Nearctic, NT Neotropical, PA Palaearctic, AF Afrotropical, IN Indotropical, AU Australasian. 29
Figure 1. Map showing the known distribution records of Unio delphinus (white circles), sampling sites for growth and sex-ratio (all red markers), and sampling site for the evaluation of reproductive cycle (red square). Both maps are represented using the World Geodetic System 84 (WGS84) projection. 48
Figure 2. A - Size-at-age measurements of shell length; B - size as a function of bivalve
age, modelled by the von Bertalanffy growth function. 52
Figure 3. Histological sections from female gonads of Unio delphinus stained with Hematoxylin and Eosin (H&E). A - General aspect of female gonads (fa) organized in acini, in September the acini showing gonads at all development stages of oogenesis, with several mature oocytes (m) (scale bar 100 μm). B - Female acinus in September with a predominance of earlier stages of oogenesis: oogonia (o), previtellogenic oocytes (pvo), pedunculated oocytes (po), and the germinal epithelium (ge) are visible surrounding the germinative cells (scale bar 50 μm). C - Female acini in May also presented different development oogenesis stages, dominantly the earlier previtellogenic oocytes (pvo) surrounded by the germinative epithelium (scale bar 100 μm). D - Detail of female acinus in September showing pedunculated oocytes (po) with stalk (s) visible and mature oocyte in the lumen (l) (scale bar 50 μm). E - Mature acinus in September, full of mature oocytes (m) in the centre surrounded by earlier stages and germinative cells (scale bar 100 μm). F - Mature female acini with mature oocytes (m) released into the lumen (l), and muscle tissue (ms) (scale bar 100 μm). G - Female acinus in October with only a few mature oocytes (m) already in the lumen (l), one showing two nucleoli (n) in the nuclei, presenting still some early stages of oocytes and with several yellow bodies (yb), indicating early signs of degeneration (scale bar 50 μm). H - Degenerative female acinus (dfa), surrounded by an undifferentiated epithelium, but still presenting some stages of oocyte development (scale bar 100 μm). 53
Figure 4. Histological sections from male gonads of Unio delphinus stained with Hematoxylin and Eosin (H&E). A - General aspect of male gonads (ma) organized in acini in January, with the acini showing gonads at all development stages of spermatogenesis, full with mature spermatozoa (s) in the lumen, with visible muscle tissue (ms) and portions of the ciliated gonoduct (cg) (scale bar 200 μm). B - Partial male acini in January, with male reproductive cells at different spermatogenesis stages and germinative epithelium (ge) visible, in the centre the ciliated gonoduct (cg) is full of mature spermatozoa (s) (scale bar 20 μm). C and D - Details of male acinus in October, where is possible to identify different development spermatogenesis stages, dominantly the earlier
and the last stage spermatozoa (s), not so abundant (scale bar 10 μm). E - Degenerative male acinus (dma) in August, at the beginning of the post-spawning period, lumen with already some free spaces, presenting some yellow bodies (yb) and surrounded by an undifferentiated epithelium, still presenting all stages of spermatozoa development (scale bar 100 μm). F - Mature spermatozoa (s) in March, few sperm morulae (sm) and other development
stages (scale bar 10 μm). 56
Figure 5. Histological sections from marsupial female gills of Unio delphinus, without and with glochidia stained with Hematoxylin and Eosin (H&E) (A and B); stereoscope images from the gills (C and D) and free glochidia (E). A - Histological section from marsupial female gill in April, devoid of offspring (scale bar 500 μm). B - Histological section from marsupial female gills in July, full of mature glochidia (g) (scale bar 500 μm). C - Marsupial gill at stereoscope, in March (scale bar 1 mm). D - Detail of gravid gill and feather-like conglutinate full of eggs (Fs) (scale bar 1 mm). E - Mature glochidia at the microscope, in June
(scale bar 200 μm). 59
Figure 6. A - Mean glochidial infestation (i.e. the number of glochidia per fish and mm of
fish) and B - Effective transformation of glochidia into juveniles (i.e. the number of juveniles produced per fish and mm of fish), in all fish species. 62
Figure 7. Glochidial transformation rate and attachment periods (shown in bars) per fish
host species. 63
Table 1. Growth parameters for Iberian Unio delphinus populations. L∞ is calculated from the Wolford equation, Lmax is the maximum observed length in the field.
The maximum age was estimated from Lmax. 51 Table 2. Monthly values of all identified Gonadal Development Index (GDI) stages in the
male and female gonads, and presence/absence of eggs and larvae (glochidia) in the marsupium of Unio delphinus. See text for details on GDI. 57
Table 3. Sex distribution of selected Iberian populations of Unio delphinus. 60
Table 4. Fish species studied and host compatibility test results, including the number and mean (±SD) length of fish per species, mean initial number of attached glochidia, mean number of viable juveniles produced and transformation rate ‘Transformation rate’ indicates the proportion of Unio delphinus glochidia that successfully developed into juvenile mussels. 61
Figure 1. Phylogenetic tree of the Palaeoheterodonta obtained by Bayesian Inference (BI) and Maximum likelihood (ML) analyses of the first combined (COI + 28S) dataset. Support values above the branches are posterior probabilities (BI4) and bootstrap support (ML4) below. An asterisk (*) indicates nodes with PP95% posterior probability or bootstrap support. Posterior probability (percentage) or bootstrap support with P < 50% were omitted for clarity. All subfamily nodes were collapsed for visual purposes. 97
Figure 2. Phylogenetic tree of the Unionidae obtained by Bayesian Inference (BI) and Maximum Likelihood (ML) analyses of the second combined (COI + 28S) dataset. Support values above the branches are posterior probabilities (BI4/BI2) and bootstrap support (ML4/ML2) below. An asterisk (*) indicates nodes with PP95% posterior probability or bootstrap support. Posterior probability or bootstrap support with P < 50% were omitted for clarity. 98
Figure 3. Distribution map of the subfamily Anodontinae. 104
Figure 4. Distribution map of the subfamily Unioninae. 108
Figure 5. Distribution map of the subfamily Rectidentinae. 109
Figure 6. Distribution map of the subfamily Gonideinae. 112
Figure 7. Distribution map of the subfamilies
Ambleminae + Modellnaiinae + Parreysiinae. 115
Table 1. Historical classification systems of the subfamilies and tribes now included in the Unionidae. (Blue) subfamilies; (red) tribes; (nn) nomen novum; (*) regional
study; (?) rank uncertain. 87
Table 2. Specimens analysed. (U) Unknown country; (*) not generated from a single
individual. Taxonomy follows Table 3. 92
Table 3. Classification of the Unionidae based on the present analyses. (*) Not included
in the present study. 100
Table C1. List of morphological, anatomical and behavioral characters used in traditional phylogenetic and systematic analyses of Unionida. (Gln) Glochidial size index; (Pse) Pseudocardinal teeth; (Lat) Lateral teeth; (L) Left valve; (R) Right valve. (*) Reported as bilaterally asymmetrical, but see discussion in Pfeiffer and Graf (2015) (most likely unhooked as other Pseudodon species). Umbo sculpture classification follows Zieritz et al (2015) 135
in red; only shell materials in white. 151
Figure 2. Bayesian consensus tree inferred from the cytochrome c oxidase subunit I (COI) gene fragment. The values above and below the nodes indicate Bayesian posterior probability (bpp) percentage and maximum likelihood bootstrap values (bs), respectively. Values over 95% are represented by an asterisk, and those <50% are not shown for clarity. 159
Figure 3. Bayesian consensus tree inferred from the NADH dehydrogenase subunit 1 (ND1) gene fragment. The values above and below the nodes indicate Bayesian posterior probability (bpp) percentage and maximum likelihood bootstrap values (bs), respectively. Values over 95% are represented by an asterisk, values below 50% are not shown for clarity. 160
Figure 4. Bayesian consensus tree inferred from the NADH dehydrogenase subunit 1 (ND1) and cytochrome c oxidase I (COI) gene fragments concatenated dataset. The values above and below the nodes indicate Bayesian posterior probability (bpp) percentage and maximum likelihood bootstrap values (bs), respectively. Values over 95% are represented by an asterisk, values below 50% are not
shown for clarity. 161
Figure 5. Haplotype (TCS) networks and uncollapsed Quadrula clade from Figures 2 and 3, showing the relationships of nominal species within the Quadrula quadrula group for (a) cytochrome c oxidase I (COI) and (b) NADH dehydrogenase
subunit 1 (ND1). 163
Figure 6. Shell outline principal component scores for the first two PC axes obtained from 18 Fourier coefficients of (a) all true species (recognized by molecular species delineation methods; see results) of Cyclonaias, including a maximum of 50 specimens per species; (b) all nominal species of Cyclonaias pustulosa; (c) only
Cyclonaias kieneriana and Cyclonaias asperata; (d) all nominal species of Quadrula; (e) all true species (recognized by molecular species delineation
methods; see results) of Theliderma; and (f) only Theliderma metanevra and
Theliderma johnsoni n. sp. Synthetic shell outlines of “extreme” morphotypes
are displayed with the anterior margin facing to the left and the dorsal margin to
the top of the page. 170
Figure 7. Distribution maps of (a) nominal species Cyclonaias asperata and Cyclonaias
kieneriana before the present study and (b) of Cyclonaias kieneriana as
Figure 8. Distribution maps of (a) Cyclonaias petrina before Burlakova et al (2018) and (b) of C. petrina and Cyclonaias necki after Burlakova et al (2018) and Johnson et al (2018) findings also supported by the present study. 178
Figure 9. Distribution maps of (a) nominal species within the Cyclonaias pustulosa group and (b) of C. pustulosa and Cyclonaias succissa as confirmed by Johnson et al
(2018) and the present study. 179
Figure 10. Distribution maps of (a) nominal species within the Quadrula quadrula group and (b) of Quadrula quadrula as proposed in the present study. 181
Figure 11. Distribution maps of (a) Theliderma metanevra before the present study and (b) after the present study divided in T. metanevra and
Theliderma johnsoni n. sp 182
Table 1. List of newly sequenced specimens for Cytochrome c oxidase subunit I (COI) and NADH dehydrogenase subunit 1 (ND1) datasets; nominal taxa, new identification, site, main basin, and COI and ND1 Haplotype number and
Genbank references. 152
Table 2. List of morphological, anatomical and behavioural characters of Cyclonaias,
Quadrula, Theliderma, and Tritogonia as recognized in the present study.
157
Table 3. Results of repeatability clade analysis (RCA) of main clades corresponding to
the preferred topology. 158
Table 4. Pairwise genetic distance matrixes of nominal quadruline species of the genera
Cyclonaias, Quadrula, Theliderma, and Tritogonia, using the original nominal
taxa. 164
Table 5. Results of molecular species delineation methods. 166
Table 6. Pairwise genetic distance matrixes of quadruline species of the genera
Cyclonaias, Quadrula, Theliderma, and Tritogonia, as recognized in the present
study. 167
Table 7. Historical classification of species formerly assigned to Quadrula.
* extinct. 175
Supplementary Table 1. List of museum lots analysed for the morphometry: taxon, original identification, new identification, and lot catalogue number. BSGLC (SUNY Buffalo State College Great Lakes Centre); NCSM (North Carolina Museum of
Natural Sciences). 189
Supplementary Table 2. List of specimens included in the Cytochrome c oxidase subunit I (COI) dataset; Haplotypes, GenBank references, original identification, new identification, voucher specimen, and respective study. BSGLC (SUNY Buffalo State College Great Lakes Centre); FLMNH (Florida Museum of Natural
of Alabama); UAUC (University of Alabama Unionid Collection); UAM (Auburn
University Museum). 193
Supplementary Table 3. List of specimens included in the NADH dehydrogenase subunit 1 (ND1) dataset; Haplotypes, GenBank references, original identification, new identification, and voucher/specimen and respective study. BSGLC (SUNY Buffalo State College Great Lakes Centre); NCSM (North Carolina Museum of Natural Sciences); UA (University of Alabama); UAUC (University of Alabama
Unionid Collection). 216
Supplementary Table 4. List of specimens included in the concatenated Cytochrome c oxidase subunit I (COI) + NADH dehydrogenase subunit 1 (ND1) dataset; codes, original identification, new identification,
and Genbank references. 235
Supplementary Table 5. List of morphological, anatomical and behavioural characters analysed on specimens of Quadrula s.l.. GLN - mean glochidial size index. * only observed in laboratory conditions.
Superscripts 1 occasionally, 2 shallow. 251 Supplementary Table 6. Species assigned Quadrula sensu lato according the last
comprehensive checklist of the United States (Williams et al 2017), conservation status by the International Union for Conservation of Nature (IUCN) Red List and by NaturServe, and legal protection status in the United
States of America. 258
CHAPTER 6. Phylogeny of the family Margaritiferidae
Figure 1. Phylogenetic tree of the Palaeoheterodonta obtained by Bayesian Inference (BI) and Maximum likelihood (ML) analyses of the combined (COI [3 codons] + 16S + 18S + 28S + H3 [3 codons]) dataset. Support values above the branches are posterior probabilities and bootstrap support below. Numbers after species names refer to specimen numbers (see Table 3). 299
Figure 2. Hinge plate and umbo cavity of Margaritiferidae. A - Gibbosula crassa (NCSM 102194.2), B - Cumberlandia monodonta (NCSM 55359.18), C - Margaritifera
margaritifera, (NCSM 5771.1) D - Pseudunio auricularius (NCSM 44514.2). t -
pseudocardinal teeth, u - umbo cavity. 306
Figure 3. Fossil-calibrated ultrametric chronogram of the Margaritiferidae calculated under a lognormal relaxed clock model and a Yule process speciation
implemented in BEAST 1.8.4 and obtained for the complete data set of mitochondrial and nuclear sequences (nine partitions: three codons of COI + 16S rRNA + 18S rDNA + 28S rDNA + three codons of H3). Bars indicate 95% confidence intervals of the estimated divergence times between lineages (Ma). Black numbers near nodes are mean ages (Ma). Stratigraphic chart according to the International Commission on Stratigraphy (2015). 308
Figure 4. Simplified scheme of origin and expansion routes inferred across clades of the Margaritiferidae. The black numbers show the mean age of putative expansion events obtained from the multi-locus fossil-calibrated phylogenetic model (see Fig. 3 for details). Circles indicate the putative places of origin of the family and several clades. The map was created using ESRI ArcGIS 10 software (www.esri.com/arcgis); the topographic base of the map was created with ESRI
Data and Maps. 310
Figure 5. Semilogarithmic lineage-through-time (LTT) median plots of chronograms estimated from 108,004 post-burn-in Bayesian trees for the primary Margaritiferidae clades, including Gibbosula, Cumberlandia + Pseudunio,
Margaritifera, and the entire family. The grey filling indicates 95% confidence
intervals. 311
Figure 6. Distribution map of the Margaritiferidae. 315
Table 1. Comparison of Margaritiferidae classifications. Fossil genera excluded. (S) synonym. Superscripts: 1under tribe Heudeanini; 2under subfamily
Pseudodontinae; 3under tribe Margaritiferini; 4under tribe Leguminaiini. 281 Table 2. Characters used to define and diagnose Margaritiferidae. 1 papillae present
only; 2 hinge teeth reduced. 283
Table 3. List of specimens analysed, GenBank references, specimen number, locations, and museum voucher references. *not generated from a single individual. IEBR - Institute of Ecology and Biological Resources, Hanoi, Vietnam; MNCN - Museo Nacional de Ciencias Naturales, Madrid, Spain; NCFM - Nanchang Freshwater Mollusc Collection, Nanchang University, Jiangxi Province, China; IEPN - Russian Museum of Biodiversity Hotspots; MCZ - Museum of Comparative Zoology, Harvard University, USA; UAUC - University of Alabama Unionid Collection, USA; BivAToL - Bivalve Tree of Life Project, USA. 290
Table 4. Biological and ecological characters. (Gln) glochidial size index. Superscripts:
Uunknown; Rrivers; Llakes. 294
Table 5. Results of Repeatability Clade Analysis (RCA) of main clades corresponding to the preferred topology. High support values (BI posterior probability ≥ 95%, and ML bootstrap support ≥ 70%) are highlighted in bold. 300
1W-shaped pustules on umbo and onto disk; 2plications on the posterior slope,
posterior disk; 3plications on the posterior slope, pustules on umbo and disk.
303
Table 7. Anatomical characters. *Not analysed for anatomy. 305
Table 8. The most probable ancestral areas of the primary clades within Margaritiferidae inferred from three different statistical modelling approaches. High support values (probability≥70%) are highlighted in bold. *Mediterranean + Eastern
North America. 309
Table 9. Margaritiferidae systematics and taxonomy. 313
Supplementary Figure 1. Gene map of the F-type mitochondrial genome of Gibbosula
crassa. Genes positioned inside the circle are encoded on the heavy strand,
and genes outside the circle are encoded on the light strand. Colour codes for the: small and large ribosomal RNAs (red), transfer RNAs (purple); F-specific open reading frame (yellow); protein-coding genes (green). 340
Supplementary Figure 2. Historical biogeography of the Margaritiferidae inferred from three different statistical modelling approaches, including (A) the combined results of SDIVA, DEC, and S-DEC; (B) S-DIVA; (C) DEC; and (D) S-DEC, calculated under a lognormal relaxed clock model and a Yule process speciation implemented in BEAST 1.8.4 and obtained for the complete data set of mitochondrial and nuclear sequences (nine partitions: three codons of COI + 16S rRNA + 18S rDNA + 28S rDNA + three codons of H3). Pie chaps near nodes indicate probabilities of certain ancestral areas. Colour circles on the tip nodes indicate the range of each species. Black numbers near nodes are BPP
values inferred from BEAST. 341
Supplementary Table 1. Specimens examined for conchological and anatomical features. ANSP - Academy of Natural Sciences of Drexel University, Philadelphia, PA USA; MNHN - Muséum National d'Histoire Naturelle, Paris, France; NHMUK - Natural History Museum, London, UK; NCFM - Nanchang Freshwater Mollusc Collection, Nanchang University, Nanchang, Jiangxi Province, China; NCSM - North Carolina Museum of Natural Sciences, Raleigh, NC, USA; RMBH - Russian Museum of Biodiversity Hotspots, Federal Centre for Integrated Arctic Research, Russian Academy of Sciences, Arkhangelsk, Russia. 343
Supplementary Table 2. Best-fit models of nucleotide substitution for each partition based on Bayesian Information Criteria (BIC) using JMODELTEST 2.1.10 (Darriba et al 2012) for the Bayesian inference analyses. 344
Supplementary Table 3. List of characteristic examples of fossil records supporting the primary phylogenetic clades of freshwater bivalves identified in the present
study. 345
Supplementary Table 4. List of fossil calibrations that were used in
BEAST analyses. 349
Supplementary Table 5. Diversification rate statistics for the Margaritiferidae and Unionidae clades. Superscripts: *variable diversification rate; **Data from Bolotov et al (2017a); MMekong only. 354 Supplementary Table 6. Margaritiferidae generic names, authorities,
and type species. 355
CHAPTER 7. First male whole mitogenome of a Margaritiferidae species
Figure 1. Diagrams of the five distinct gene orders detected in Unionida. In the female F-type lineage, three gene orders are depicted: Unionidae F-F-type 1 (UF1), Unionidae F-type 2 (UF2) and Margaritiferidae F-type 1 (MF1). In the male M-type lineage, two gene arrangements are shown: Unionidae M-M-type 1 (UM1) and Margaritiferidae M-type 1 (MM1). Continuous lines indicate different locations of genes between mitogenomes. Grey box highlights the gene rearrangement region between UF1 and UF2. Yellow boxes indicate the main differences in gene arrangement between female and male mitogenomes, tRNA (H) location and rearrangement of ATP8-tRNA(D) region. 365
Figure 2. Phylogenetic (BI-NUC) tree of Unionida estimated from 14 concatenated individual mtDNA gene sequences (12 protein-coding and 2 rRNA genes). Values for branch support are represented in the following order: (1) Bayesian posterior probabilities (PP) for BI-NUC tree, (2) Bayesian PP for BI-AA tree, (3) ML bootstrap support (BS) values for ML-NUC and (4) ML BS values for ML-AA tree. Maximum support values (PP = 1, BS = 100) are represented by asterisks. All five distinct detected gene orders are mapped on the phylogeny branches (see Fig. 1 for gene order codes). 366
CHAPTER 8. The evolution of mitogenome rearrangements in freshwater
mussels
Figure 1. Gene maps of the F- and M-type mitochondrial genomes of Chamberlainia
strand, and genes outside the circle are encoded on the light strand. Colour codes: Small and large ribosomal RNAs (red), transfer RNAs (purple), FORF F-specific open reading frame (yellow), MORF M-F-specific open reading frame
(yellow), PCGs genes (green). 382
Figure 2. Diagrams of the four distinct gene orders known in Unionidae to date. In the F-type, three gene orders are depicted: UF1, UF2, and UF3. In the male M-type lineage, the only Unionidae gene arrangement is shown: M-type 1 (UM1). Blue boxes highlight the gene rearrangement region from UF1 to UF2 (Box A) and from UF2 to UF3 (Box B). Small and large ribosomal RNAs and transfer RNAs are depicted by one letter of the amino acid code; Arrow colour codes, follow
Fig. 1. 384
Figure 3. Phylogenetic (BI-NUC) tree of Unionida estimated from 14 concatenated individual mtDNA gene sequences (12 protein-coding and 2 rRNA genes). Values for branch support are represented in the following order: (1) Bayesian posterior probabilities (PP) for BI-NUC tree, (2) Bayesian PP for BI-AA tree, (3) ML bootstrap support (BS) values for ML-NUC and (4) ML BS values for ML-AA tree. Maximum support values (PP = 1, BS = 100) are represented by asterisks. Gonideinae subfamily and tribes are highlighted. For details see text. GenBank
codes in Table 1. 385
Figure 4. Phylogenetic (BI-NUC) tree of Unionida estimated from 28 concatenated individual mtDNA gene sequences (24 protein-coding and 4 rRNA genes) of the first combined Female + Male concatenated data set. Maximum branch support values (BI-NUC/BI-AA PP = 1; ML-NUC/ML-AA BS = 100) are represented by asterisks, while # represents the only non-supported branch by ML-AA tree. Gonideinae subfamily and tribes are highlighted.
GenBank codes in Table 1. 386
Figure 5. Unionidae F-haplotype phylogenetic sub-tree (BI-NUC) used to infer the most parsimonious putative ancestral gene orders and gene rearrangements mapped as MF1, UF1, UF2, and UF3 (see text for details). Margaritiferidae and all subfamily nodes were collapsed for visual purposes. 387
Figure 6. Time-calibrated mitogenomic phylogeny, an example of the three-level classification scheme (subfamilies, tribes, and subtribes) and evolution of the mitochondrial gene order in the Unionoidea. Fossil-calibrated ultrametric chronogram of the Unionoidea calculated under a lognormal relaxed clock model and a Yule process speciation implemented in BEAST and obtained for the complete mitogenome data set. The outgroup sample is not shown. Bars
indicate 95% confidence intervals of the estimated divergence times between lineages (Ma). Black numbers near nodes are mean ages (Ma). Colour labels indicate the mitochondrial gene order (MF1, UF1, UF2, and UF3). Red asterisks indicate fossil calibrations. Stratigraphic chart according to the International Commission on Stratigraphy (2015). 388
Figure 7. Historical biogeography of the Unionidae. This combined scenario has been inferred from three different statistical modelling approaches (S-DIVA, DEC, and S-DEC) based on the time-calibrated mitogenomic phylogeny (Fig. 6). Pie charts near nodes indicate probabilities of certain ancestral areas. Colour circles on the tip nodes indicate the range of each species. Colour labels indicate the mitochondrial gene order (UF1, UF2, and UF3). 389
Table 1. List of specimens analysed (based on Lopes-Lima et al 2017a,b), GenBank
references, and country. 378
Table 2. Main structural features of the female (above) and male (below) transmitted mitochondrial genomes of Gonideinae species. 383
Supplementary Table 1. List of fossil calibrations that were used in
List of Abbreviations
16S 16S ribosomal RNA gene 28S 28S ribosomal RNA gene AF Afrotropical
AU Australasia
BI Bayesian Inference
BIC Bayesian information criterion COI Cytochrome oxidase subunit 1 DNA Deoxyribonucleic acid
DUI Doubly uniparental inheritance FM Freshwater mussel
GIS Geographic Information System H3 Histone H3 gene
IN Indotropical
IUCN International Union for the Conservation of Nature MCMC Markov-Chain Monte Carlo
ML Maximum Likelihood mtDNA mitochondrial DNA NA Nearctic
ND1 NADH dehydrogenase subunit 1 nt nucleotides
NT Neotropical PA Palaearctic
CHAPTER 1
General introduction
1.1 The freshwater biodiversity crisis
Never in the world, so many humans used so many natural resources (Figs. 1 & 2). The exponential human growth over the last 2,000 years is coupled with the increase of consumptive biological resources per capita, resulting in increasing anthropogenic changes to natural environments (Sala et al 2000; IPBES 2019), as the major threat to biodiversity and ecosystem functioning (McKee et al 2003; McShane et al 2011). These impacts have already caused an extensive contraction of genetic, species and ecological diversity, with gene erosion and eradication, species extirpations and extinctions, and loss and irreversible transformation or destruction of many habitats around the globe (Butchart et al 2012; Ceballos et al 2015; Miraldo et al 2016; IPBES 2019). Therefore, we are living under a biodiversity crisis with unprecedented severity, since human life on Earth (Barnosky et al 2011). The extinction rates are far higher than baseline values and closer to those during major extinction events, and we are potentially experiencing the sixth mass extinction event (Barnosky et al 2011; Pievani 2014).
Figure 1. Size of the world human population over the last 12,000 years. Adapted from Roser
Figure 2. Changes of Gross domestic product (GDP), domestic material consumption, and
extraction of living biomass (trillion USD at 2010 value) for groups of countries at distinct development levels. Adapted from IPBES (2019).
Diversity patterns are not homogeneous across the terrestrial, marine and freshwater realms (Dawson 2012). Although freshwater habitats only hold 0.01% of the global water volume and cover around 0.8% of the Earth’s surface, they have a disproportionate species richness when compared with their terrestrial and marine counterparts (Collen et al 2014). For instance, they contain 40% of all fish species and a quarter of the global number of vertebrates (Dudgeon et al 2006). Freshwater habitats are, however, among the most threatened at the global level (Strayer & Dudgeon 2010; Vörösmarty et al 2010), given that they are rare, isolated by land and seawater, and generally located downhill of human settlements and therefore exposed to all kinds of runoff and human wastes (Strayer 2006). Freshwater water bodies have also been intensively modified for human purposes; for example, many rivers have been intubated, channelized and re-directed, and lakes dried or redesigned (Strayer & Dudgeon 2010). Water level, flow, and substrate have been exhaustively impacted by thousands of physical barriers such as dams, weirs, and floodgates, concrete embankments to prevent the overflow, and
extraction of sands, gravels and other inert materials (Strayer 2006; Reid et al 2019).
Therefore, freshwater habitats are suffering much higher biodiversity declines than those on marine or terrestrial realms (Dudgeon et al 2006; Reid et al 2019). This pattern can also be seen using the Living Planet Index developed by the World Wide Fund for Nature (WWF), where the freshwater species index dropped more sharply between 1970 and 2012 than the index for the marine or terrestrial populations (Fig. 3; WWF 2016).
Figure 3. Evolution of the Living Planet Index (LPI) over the last decades. LPI is a measure of
the state of the world's biological diversity based on population trends of species from terrestrial, freshwater and marine habitats. Adapted from WWF (2016).
1.2 Freshwater mussel diversity, importance, and conservation
Freshwater bivalves of the Unionida order, also known as Freshwater Mussels (FMs), freshwater clams or naiads, belong to an old (>200 Mya), big monophyletic group of molluscs that are strictly freshwater inhabitants and, for this reason, have a series of interesting adaptations to allow them to survive under constant flow (Strayer 2008; Haag 2012). Contrary to marine bivalves, FMs exhibit internal fertilization, parental care and, more interestingly, their specialized larvae (glochidia) need to attach to a host (mostly freshwater fish) for dispersion and nutrition until they metamorphose into juveniles and drop into the substrate (Graf & Cummings 2006; Barnhart 2008). Freshwater mussels play key ecological roles (e.g. water filtration, energy, and nutrient cycling, providing bioturbation or sediment mixing), and provide valuable ecosystem services to humans (e.g. increasing water transparency, source of protein, pearls and shell materials) (Howard & Cuffey 2006). This group of mussels has a wide distribution and they often dominate many freshwater habitats regarding both the number of individuals and biomass (Vaughn 2018). Unfortunately, FMs, like many other freshwater taxa, have suffered a massive global defaunation over the last centuries (Dirzo et al 2004; Lopes-Lima et al 2014) and are currently one of the most imperilled groups in the world (Fig. 4; Lydeard et al 2004; Ferreira-Rodriguez et al 2019).
Figure 4. Current extinction risk in different species groups. Adapted from IPBES (2019).
This is further exacerbated by the fact that to complete their life cycle, these mussels are dependent on freshwater fish, which have also shown strong declines globally (Modesto et al 2017). Therefore, decline and extinction estimates of affiliate species such as FMs need to be recalibrated by taking the host species fluctuations and extinctions into account (Koh et al 2004). Based on the current IUCN Red List and if data deficient species are as threatened as non-data deficient species, 43% of all assessed FM species are currently threatened, with 13.2% being Critically Endangered and 6.3% already Extinct (Fig. 4; IUCN 2019). This situation has caused a substantial increase in research and conservation action dedicated to FMs since the emergence of ecological values during the 1970s (Haag 2012; Lopes-Lima et al 2014). These research and conservation efforts have been, however, concentrated in a handful of the more charismatic species (e.g., Margaritifera margaritifera and Unio crassus in Europe, and
Cumberlandia monodonta in North America), and in more economically developed regions
such as North America and Europe (Lopes-Lima et al 2014). Species in other parts of the world are still poorly known and their conservation status poorly evaluated (Lopes-Lima et al 2014; Ferreira-Rodriguez et al 2019).
Six families are currently recognized within Unionida based on morphological characters (Graf & Cummings 2007; Bogan 2008). Two of them are present in the northern hemisphere (Fig. 5): the Unionidae, which is by far the most speciose family of the order, with around 600 species, and the Margaritiferidae, which has a much lower species richness but with most species being at risk of extinction (IUCN 2019).
Figure 5. Global distribution map of the freshwater families Unionidae and Margaritiferidae.
Adapted from Lopes-Lima et al (2017a, 2018).
Two of the families are present mainly in the southern hemisphere not crossing continental boundaries (Fig. 6), i.e. the Mulleriidae occurring in South America, and the Iridinidae in Africa.
Figure 6. Global distribution map of the freshwater families Iridinidae and Mulleriidae. Adapted
from Bogan (2008).
From the remaining two families, the Hyriidae is found in both South America and Australia, while the Etheriidae was originally thought to be composed by less than ten species in South America, Africa, and Asia, but due to recent revaluation is now considered restricted to Africa (Fig. 7; Bogan 2008).
Figure 7. Global distribution map of the freshwater families Hyriidae and Etheriidae. Adapted
from Bogan (2008).
Although several phylogenetic studies have been developed over the last decades (e.g., Bogan & Hoeh 2000; Graf & Cummings 2006, 2007; Whelan et al 2011), the phylogeny within the order is far from stabilized and limited phylogenetic consensus has emerged, especially regarding to the early evolution of the Unionida (Graf 2013). Phylogenetic patterns within the families are also poorly understood due to the lack of sequenced taxa and limited robustness of available phylogenetic analyses (Huff et al 2004; Whelan et al 2011).
1.3 The need for baseline biological research
Accurate conservation status assessment and effective conservation actions require a profound knowledge about their target taxa and/or habitats (Lopes-Lima et al 2017b). However, baseline ecological and physiological data on most FM species is still scarce (Kindsvater et al 2018). Some features are almost unknown across all taxa, such as dispersal rates of larvae (hitchhiking on fish) or adults, and the mean and maximum distances a male can fertilize a female (Strayer et al 2004; Lopes-Lima et al 2017b). Other data are only available for a small number of species or populations and generally on a small-time scale, such as data on the distribution, population size, structure and trends, and demography (e.g. recruitment, mortality, and migration) (Ferreira-Rodriguez et al 2019). Also, life-history traits like lifespan, age at sexual maturity, reproduction stage timing, and fertility are poorly known, and many times wrongly extrapolated from data on better-known species, such as
al 2014). Additionally, more extrinsic factors like the identification and availability of the fish host range, the main habitat requirements, and the sensitivity and responses to environmental stressors like habitat degradation and pollution, are requiring urgent research (Modestro et al 2017; Ferreira Rodriguez et al 2019). This lack of baseline biological data is hindering conservation efforts. For instance, the lack of knowledge on habitat requirements and sensitivity to habitat degradation does not allow us to understand how riverine or lacustrine habitats should be accurately rehabilitated to improve the status of FM populations. Also, the lack of knowledge on traits involved in the reproductive cycle, such as reproduction timing (fertilization, spawning, and larvae discharge), age of maturity, fertility, and host fish usage slows down the implementation of captive propagation programs, necessary for reintroduction and reinforcement of depleted populations (Patterson et al 2018). Species' baseline data are not only important for species-focused conservation and research. Meta-analyses and modelling studies on a wide spatial scale, depend on this type of data for designing bioregions, prioritizing areas for conservation and evaluating threats and other environmental factors affecting taxonomic groups, species assemblages and entire ecosystems (Kindsvater et al 2018).
1.4 Defining species boundaries and integrating phylogenetic diversity
patterns in conservation ranking
Given that resources dedicated to conservation are limited, a careful selection of conservation targets is required (Moilanen & Arponen 2011). Species are globally considered the essential conservation units by policies and conservation status assessments (Fitzpatrick et al 2015). Therefore, it is crucial to thoroughly define species boundaries, which is not always an easy task, especially in FMs (Chong et al 2016; Inoue et al 2018). FMs’ species delineation is many times difficult due to the lack of clear morphological diagnostic characters, high shell plasticity and morphological convergence among related species (Froufe et al 2016). For this reason, molecular analyses have been increasingly used to define species boundaries in these organisms (e.g. Chong et al 2016; Pfeiffer et al 2016; Inoue et al 2018). However, the molecular delimitation of cryptic species is fundamentally questioned by the continuous and dynamic nature of speciation (Chenuil et al 2019). There have been multiple ways and concepts on how to define species (revised in De Queiroz 2007) but, since the last decades of the 20th century,
we have mostly used a reproductive isolation approach or the biological species concept (Mayr 1982), which is not always easy to demonstrate. However, many scientists are now increasingly using the monophyletic isolated lineages approach supported by multiple arguments or the unified species concept (De Queiroz 2005, 2007) which is easier to
approaches on DNA sequences have been developed to identify species and define species boundaries (Luo et al 2018). Many of them relied on a standardized segment of the mitochondrial genome (a region of the cytochrome c oxidase subunit I, COI with around 600 nucleotides) (Hubert & Hanner 2015). The choice of COI over other mitochondrial or nuclear markers as the main molecular tag or barcode for each species, is due to several reasons: it has a high discrimination resolution, is generally easy to amplify even from small amounts or from degraded tissue, and standard protocols are available for amplification in a wide range of taxa (Hebert et al 2003). More recently, methods applied to coalescent trees are being increasingly applied not only to COI or single genes, but to multiple nuclear and mitochondrial markers (Luo et al 2018). The identification of these molecular operational taxonomic units or MOTUs allows scientists to identify and investigate hidden cryptic diversity and for species recognition to advance faster than in classical morphological approaches (Kekkonen & Hebert 2014).
Conservation targets and prioritization should also include the evolutionary history captured by specific sets of species or higher taxa, i.e. their phylogenetic diversity patterns (Winter et al 2013). For example, phylogenetically unique taxa are generally of higher priority for conservation; furthermore, metrics have already been developed to include phylogenetic diversity in species rankings for conservation attention, such as the Evolutionarily Distinct and Globally Endangered (EDGE) program developed by the London Zoological Society (Redding & Mooers 2006; Isaac et al 2007).
1.5 Objectives
The overall goal of this dissertation is to advance the conservation biology of freshwater mussels by combining research on phylogeny, systematics and ecology, showing how the integration of multiple research fields has practical implications to preserve highly endangered taxa. The specific objectives of this thesis are:
1. To highlight the biodiversity hotspots of freshwater bivalves, mapping the global species diversity and conservation status in the main freshwater bivalve ecoregions.
2. To reveal the main gaps of knowledge, conservation and research needs of FMs, using data from the IUCN Red List database.
3. To show the importance of basic biological studies for conservation of freshwater
mussels and environmental monitoring, using a case study on several physiological and
ecological traits of a poorly known Iberian endemic species, i.e. Unio delphinus.
4. To demonstrate the importance of systematics and phylogenetic diversity for the
conservation of freshwater mussels, through a series of phylogenetic studies on several
groups within the Unionida order.
5. To test the use of molecular data to define important freshwater mussel taxa for
conservation, estimating the phylogenetic patterns and potential molecular operational
taxonomic units.
6. To test the use of mitochondrial genome arrangements as a diagnostic for freshwater
mussel groups, sequencing and assembling whole mitogenomes of selected species and
mapping the retrieved gene arrangements in whole genome phylogenies.
7. To use information collected during the dissertation to provide recommendations for
freshwater mussel conservation, at national, European and global scales.
1.6 Thesis structure
The dissertation was organised in nine chapters, which together address the general and specific objectives of the thesis listed in the previous section. The dissertation includes a general Introduction (Chapter 1) and a General Discussion (Chapter 9), together with seven chapters that correspond to seven scientific papers already published in international peer-reviewed journals. Chapter 2 presents a review on the diversity, conservation status and knowledge gaps. Two of these main gaps are the lack of knowledge about basic biological traits and systematics clarification that are then addressed in Chapter 3 and Chapters 4-8, respectively. Below, the main contents of each chapter included in the thesis are summarised.
Chapter 1 is an introduction to the main issues related to the dissertation theme. It
starts by describing the global decline of biodiversity and then focus on the target taxonomic group of the dissertation – the freshwater mussels (FM) –, discussing its ecological and economic importance, but also its threatened status and conservation concern. Subsequently, the importance of basic biological research, taxonomy, and phylogenetic patterns for conservation are highlighted.