Decision Support Methodology for
Local Sustainable Energy Planning
Ana Rita Fragoso Neves
Submitted to the Faculty of Engineering of the University of Porto in partial fulfilment of the requirements for the degree of
Doctor of Philosophy in Sustainable Energy Systems
Supervisor: Vítor Manuel Silva Leal
Professor at the Faculty of Engineering of the University of Porto
Co-Supervisor: João Carlos da Cruz Lourenço
Professor at the Instituto Superior Técnico, Technical University of Lisbon
I would like to express my thanks to both my supervisor Vítor Leal and co-supervisor João Lourenço for all their support and guidance throughout my Ph.D. work and for the extensive reading and comments provided to this thesis. I am also grateful to João Lourenço for his support and involvement in the decision conference held in Barreiro. Special thanks also go to Professor Eduardo de Oliveira Fernandes for his motivational support and insightful lectures on the topic of energy sustainability in cities.
I am deeply indebted to all the people who provided valuable contents for this thesis. These people include all the participants in the testing stage of the proposed set of local energy sustainability indicators: Tiago Gaio (AREANATejo), Francisco Craveiro (AdEPorto) and Jacob Glickle, Jim Hunt and Carl Spector (City of Boston); all the interviewees for the identification of the objectives of local sustainable energy planning: Eduardo de Oliveira Fernandes (AdEPorto), Philippe Bollinger (AMESeixal), Cristina Garret (City of Oeiras), Susana Camacho (S.Energia) and Nuno Banza (City of Barreiro); and all the actors from Barreiro who actively participated in meetings and in the decision conference process: Susana Camacho, João Braga and João Figueiredo (S.Energia) and Andreia Pereira and Cátia Correira (City of Barreiro).
My grateful thanks also go to Professor Judith Layzer for hosting me in her research group during my visit to the Massachusetts Institute of Technology (MIT) in Fall 2009. I also acknowledge Fundação para a Ciência e Tecnologia (FCT) and the MIT-Portugal program that made this visit possible and supported my work through a 4-year scholarship SFRH/ BD/ 35088/ 2007.
I would like also to thank to all my colleagues for the constructive exchange of ideas throughout my Ph.D., for their friendship, moral support and enjoyable moments in Porto and Boston. Special thanks go to Filipa, Pedro, Gustavo, Maria, Marta, Miguel, Manuel, Hrvoje and Joana. I would like to acknowledge as well my colleagues Pirita, Lucie and Monica at Climate Alliance and Covenant of Mayors Office for their understanding and support during the last year of my Ph.D. thesis.
Thanks must also be extended to all the Professors I met to discuss particular points of the Ph.D. work: Ana Camanho, Paulo Pinho, Manuel Matos, Luís Neves, Luís Dias, Carlos Hengeller Antunes, Isabel Ramos, Margarida Queirós and Steve Connors.
incredible support throughout this journey. In addition, these acknowledgments would not be completed without a very special thanks to my parents and grandparents for their constant support.
I express my deepest gratitude to all these people who contributed to a great learning process in my life.
First initiatives of energy and climate action at the local level can be tracked back into the 1990s. Although, only in the last decade integrated local energy planning initiatives have gained greater expression. A number of energy or climate action plans have been materialising on the ground, while the topic has not deserved the corresponding attention on the scientific literature so far. The new energy paradigm calls for a need to focus on the energy services for which energy is actually demanded and to identify the appropriate energy carriers and technologies to satisfy those services. Energy has several implications in sustainable development and thus a holistic perspective to local energy systems is deemed necessary. Hence, this thesis builds on the need to improve local energy planning processes by proposing a decision support methodology for local sustainable energy planning. The focus is on providing an energy services-oriented modelling approach and a solid and comprehensive basis for evaluating alternative energy action plans. Since energy planning is a decision process, it involves choices regarding the future of the community. In order to make well-weighted choices it is important to include the values and preferences of the local actors into the energy planning process.
During this research, several methods from different disciplines were reviewed in order to identify the most suited combination to satisfy the methodology’s requirements. While methods compatible with the thesis’ purpose were identified for problem structuring (cognitive mapping, causal mapping and decision conferencing) and for multi-criteria evaluation (MACBETH), the same did not happen for energy models. It was indeed necessary to build an end-use energy model, in order to accommodate hypothetical future changes at the energy services and technology levels and determine the impact of each alternative scenario on the multiple objectives identified.
The methodology was applied to the practical case of the municipality of Barreiro in order to demonstrate how it can be made operational. With the help of the local energy planning assistant tool developed, a reference scenario for 2020 was modelled, six alternatives were generated and their impacts regarding the attainment of the objectives were quantified. Furthermore, those impacts were transferred as inputs for the multi-criteria evaluation model, which was built by five local actors. Finally, the analysis of the benefits of the alternatives versus their investments allowed exploring the trade-offs that a decision-maker can face when selecting an alternative. The methodology proposed adopts an eclectic and socio-technical approach, intended to support decision in the whole energy planning process - from structuring to the choice of the action plan.
Sumário
As primeiras initiativas na área da energia e clima a nível local remontam aos anos 90. No entanto, apenas na última década as iniciativas de planeamento energético local integrado começaram a ganhar expressão. Vários planos de acção para a energia e clima locais têm vindo a ser elaborados, enquanto o tópico ainda não mereceu a mesma atenção na literatura científica. No contexto de um novo paradigma energético, os serviços energéticos surgem como um ponto central, assim como a identificação dos vectores energéticos e tecnologias apropriadas para satisfazer esses serviços. A energia tem diversas implicações no desenvolvimento sustentável pelo que uma perspectiva holística aos sistemas energéticos locais é fundamental. A presente tese propõe uma metodologia de apoio à decisão para o planeamento energético sustentável a nível local, direccionada para a modelação a nível dos serviços energéticos e para a avaliação de alternativas (i.e. planos de acção). Sendo o planeamento energético um processo de decisão, este requer a realização de escolhas em relação ao futuro da comunidade. De forma a obter escolhas devidamente ponderadas, torna-se importante incluir os valores e as preferências dos actores locais no processo de planeamento energético.
No decorrer desta investigação, métodos de disciplinas diferentes foram analisados de forma a identificar uma combinação apropriada para integrar na metodologia. Tendo sido possível encontrar métodos compatíveis com os requesitos e objectivos da metodologia para as disciplinas de estruturação de problemas (mapas cognitivos, mapas causais e conferências de decisão) bem como para a avaliação multi-critério (MACBETH), o mesmo não aconteceu para a modelação energética. Para esta última, foi necessário desenvolver um modelo de serviços energéticos, de forma a acomodar alterações hipotéticas na procura de serviços energéticos e nas tecnologias utilizadas, assim como para determinar os impactes the cada uma das alternativas nos objectivos múltiplos considerados.
A metodologia foi aplicada ao município do Barreiro com o objectivo de demonstrar a sua operacionalização. Com recurso à ferramenta de planeamento energético local desenvolvida, procedeu-se à modelação de um cenário de referência para 2020, à construção de seis alternativas e à quantificação dos impactes das alternativas que serviram como inputs para o modelo multi-critério. A análise dos benefícios das alternativas em relação ao investimento permitiu ainda explorar os trade-offs que um decisor pode enfrentar aquando da escolha de uma alternativa. A metodologia proposta adopta uma abordagem eclética e socio-técnica, com o intuito de apoiar a decisão ao longo de todo o processo de planeamento energético, isto é, da fase de estruturação até à escolha de um plano de acção.
Table of Contents
1. Introduction ... 19
1.1 The transition to a new energy paradigm ... 19
1.2 The focus on local action ... 20
1.3 What is local sustainable energy planning? ... 22
1.4 Local energy planning practices ... 23
1.5 Research scope and methodology ... 29
1.6 Thesis roadmap ... 30
1.7 Summary... 31
2. In-depth study of local energy sustainability indicators ... 33
2.1 Introduction ... 33
2.2 Methodology ... 34
2.3 Preliminary framework of indicators ... 39
2.4 Field testing of the preliminary framework of indicators ... 40
2.4.1 Calculation of the indicators for the municipality of Porto ... 40
2.4.2 Calculation of the indicators by the participating local authorities ... 42
2.5 Revision of the preliminary framework of indicators ... 45
2.6 Final proposed framework of local energy sustainability indicators ... 46
2.7 Summary... 48
3. Review of methods for supporting the design of the methodology for local sustainable energy planning ... 49
3.1 Introduction ... 49
3.2 Energy models ... 50
3.3 Problem structuring ... 54
3.3.1 What is problem structuring? ... 54
3.3.2 Problem structuring methods ... 55
3.3.3 Value-focused thinking ... 57
3.3.4 Problem structuring and energy planning ... 58
3.4 Multi-Criteria Evaluation ... 59
3.4.1 What is multi-criteria evaluation? ... 59
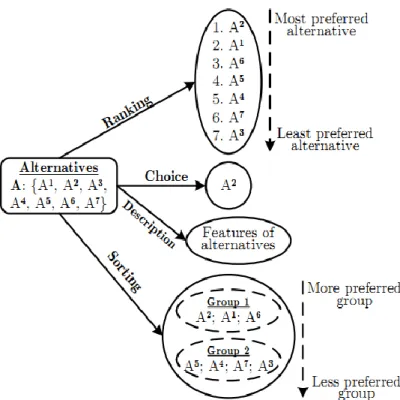
3.4.2 Types of multi-criteria decision aiding problems ... 60
3.4.3 Multi-criteria evaluation methods ... 62
3.4.3.1 Multi-attribute value and utility theories ... 62
3.4.3.2 Multi-objective programming ... 65
3.4.3.3 Outranking ... 66
3.4.4 Portfolio decision analysis ... 68
3.6 Summary ... 74
4. Decision Support Methodology for Local Sustainable Energy Planning ... 75
4.1 Outline of the methodology ... 75
4.2 Step I – Modelling the local energy system ... 78
4.2.1 Structure of energy demand ... 78
4.2.2 Breakdown of energy demand in the base year ... 83
4.2.3 Projection of energy demand – reference scenario ... 84
4.2.4 Quantification of GHG emissions ... 90
4.3 Step II – Identify the local actors ... 93
4.4 Step III – Identify and structure the objectives ... 94
4.4.1 Guidelines on identifying and structuring objectives ... 94
4.4.2 Literature review and involvement of local actors for the identification and structuring of objectives ... 96
4.4.2.1 Literature review ... 96
4.4.2.2 Involvement of local actors ... 99
4.4.3 Proposal of fundamental objectives ... 103
4.5 Step IV – Select the attributes ... 105
4.5.1 Guidelines on choosing attributes ... 105
4.5.2 Literature review on attributes ... 106
4.5.3 Proposal of attributes ... 109
4.6 Step V – Generate alternatives ... 113
4.6.1 Definition of Alternatives ... 113
4.6.2 Proposal of a catalogue of actions ... 113
4.6.3 Guidelines on generating alternatives ... 116
4.6.4 GHG emissions condition ... 119
4.7 Step VI – Assess the impacts of the alternatives on the attributes ... 120
4.8 Step VII – Determine overall benefit value score ... 125
4.8.1 Build a value function for each objective ... 125
4.8.2 Weight the objectives ... 126
4.8.3 Aggregate partial value functions ... 127
4.9 Step VIII – Perform a robustness analysis ... 127
4.10 Step IX – Analyse benefits vs. investment ... 128
4.11 Summary ... 128
5. Application of the methodology to the municipality of Barreiro ... 129
5.1 Introduction ... 129
5.2 Description of Barreiro ... 130
5.3 Modelling Barreiro’s energy system ... 131
5.3.2 GHG emissions reduction target ... 132
5.3.3 Overview of input data ... 133
5.3.4 Households energy demand ... 135
5.3.5 Services energy demand ... 137
5.3.6 Transport energy demand ... 139
5.3.7 Industry energy demand ... 143
5.3.8 Agriculture & Fisheries energy demand ... 145
5.3.9 Street lighting energy demand ... 146
5.3.10 Overall energy demand and greenhouse gases emissions results... 148
5.4 Involving the local actors ... 153
5.5 Identifying the objectives and attributes ... 154
5.6 Generating alternatives ... 155
5.7 Assessing the impacts of the alternatives ... 166
5.8 Building value functions for each objective ... 167
5.9 Weighting the objectives ... 171
5.10 Aggregating partial value functions ... 174
5.11 Performing the robustness analysis ... 176
5.12 Analysing benefit vs. investment ... 177
5.13 Final notes ... 181
5.14 Summary... 184
6. Conclusions ... 185
References... 191
Appendix I: Local Energy Sustainability Assessment – Methodological guide for the application of energy sustainability indicators at the local level ... 213
Appendix II: Causal maps derived from the literature review on objectives ... 269
Appendix III: Cognitive maps on objectives of local sustainable energy planning ... 273
Appendix IV: Literature review of actions ... 281
Appendix V: Input data for energy modelling of Barreiro municipality ... 293
List of Figures
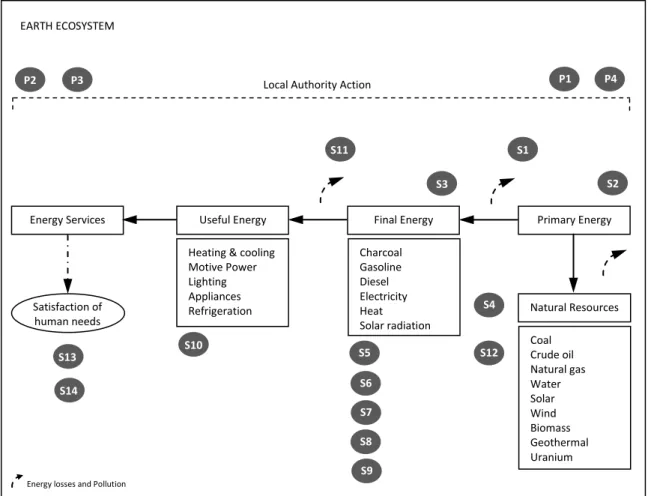
Figure 1 - Waves of industrial innovation. Source: Hargroves & Smith (2005) ... 20 Figure 2 - Methodology adopted for the development of the framework of local energy sustainability indicators. ... 35 Figure 3 – Representativeness of energy-related indicators in each set of indicators. ... 36 Figure 4 – The energy chain within the Earth ecosystem and the related state and policy indicators (presented respectively in Table 12 and Table 13). ... 48 Figure 5 – Overview of value-focused thinking benefits. Source: Keeney (1992). ... 57 Figure 6 – The multi-criteria evaluation process. Source: based on Belton & Stewart (2002). ... 60 Figure 7 – Problematics in multi-criteria decision aiding. Source: Chen (2006). ... 61 Figure 8 – Multi-criteria evaluation methods in energy planning applications. Source: Diakoulaki, Antunes & Martins (2005). ... 69 Figure 9 – Scheme of the methodology illustrating the methodological steps and the patching together of several methods and tools. ... 77 Figure 10 – Structure of the households sector: end-uses, energy carriers and conversion technologies. ... 79 Figure 11 – Structure of the services sector: end-uses, energy carriers and conversion technologies. ... 80 Figure 12 – Structure of the transport sector: end-uses, energy carriers and conversion technologies. ... 81 Figure 13 – Structure of the industry sector: end-uses, energy carriers and conversion technologies. ... 82 Figure 14 – Structure of the agricultures and fisheries sector: end-uses, energy carriers and conversion technologies. ... 83 Figure 15 – Structure of the street lighting sector: end-uses, energy carriers and conversion technologies. ... 83 Figure 16 – Simplified methodological scheme for the estimates of future energy demand in the households sector. ... 86 Figure 17 – Simplified methodological scheme for the estimates of future energy demand in the services sector. ... 86 Figure 18 – Simplified methodological scheme for the estimates of future energy demand in the industry sector. ... 86 Figure 19 – Simplified methodological scheme for the estimates of future energy demand in the agriculture & fisheries sectors. ... 86 Figure 20 – Simplified methodological scheme for the estimates of future energy demand for street lighting. ... 86
the transport sector. ... 88 Figure 22 – Causal map of the objectives stated in Gotland energy plan (Municipality of Gotland, 2006). ... 97 Figure 23 – Aggregated map of the objectives stated in the local energy and climate action plans reviewed. ... 98 Figure 24 – Group causal map resulting from the aggregation of the individual cognitive maps. ... 101 Figure 25 – Means-ends objectives network. ... 102 Figure 26 – Fundamental objectives hierarchy. ... 104 Figure 27 – Reported noise exposure of more than 55 dB Lden in European agglomerations with more than 250 000 inhabitants. Source: NOISE, 2010 fide EEA, 2010. ... 111 Figure 28 – Screenshot of the alternative generation table. ... 118 Figure 29 – The location of the municipality of Barreiro in Portugal and zoom into the Metropolitan Area of Lisbon. Source: Moreira (2007)... 130 Figure 30 – Screenshot of the ‘Start’ sheet of the local energy planning assistant tool. 131 Figure 31 – Projection of the number of occupied dwellings in Barreiro. Sources: INE, 2010a; INE, 2010b. ... 135 Figure 32 – Assumed breakdown of energy carriers by end-use for households in 2008. ... 136 Figure 33 – Estimated breakdown of final energy use by end-use in households for 2008 and 2020 reference scenario. ... 137 Figure 34 – Projection of services’ Gross Value Added in Barreiro. Source: based on DPP (2008) projections. ... 138 Figure 35 – Assumed breakdown of energy carriers by end-use for services in 2008. .. 138 Figure 36 – Estimated breakdown of final energy use by end-use in services for 2008 and 2020 reference scenario. ... 139 Figure 37 – Assumed evolution of passenger-km by mode of transport in Barreiro. ... 140 Figure 38 – Assumed evolution of tonnes-km by mode of transport in Barreiro. ... 141 Figure 39 – Assumed breakdown of energy carriers by mode for transport in 2008. .... 141 Figure 40 – Estimated breakdown of final energy use by end-use in passenger transport for 2008 and 2020 reference scenario. ... 142 Figure 41 – Estimated breakdown of final energy use by end-use in freight transport for 2008 and 2020 reference scenario. ... 142 Figure 42 – Projection of industry’s Gross Value Added in Barreiro. Source: based on DPP (2008) projections. ... 143 Figure 43 – Assumed breakdown of energy carriers by mode for transport in 2008. .... 144 Figure 44 – Estimated breakdown of final energy use by end-use in industry for 2008 and 2020 reference scenario. ... 145
Figure 45 – Assumed breakdown of energy carriers by end-use in agriculture & fisheries
in 2008. ... 146
Figure 46 – Assumed breakdown of energy carriers by end-use in street lighting in 2008. ... 147
Figure 47 – Estimated breakdown of final energy use by end-use in street lighting for 2008 and 2020 reference scenario. ... 148
Figure 48 – Final energy demand by sector in Barreiro in 2008 and in 2020 reference scenario. ... 149
Figure 49 – Final energy demand per capita per sector in Barreiro in 2008 and in 2020 reference scenario. ... 149
Figure 50 – Number of employees in establishments in Barreiro according to sector of economy. Source: INE, 2004; 2005; 2006; 2007; 2008; 2009; 2010d. ... 150
Figure 51 – Energy use in Barreiro in 2008 and in 2020 reference scenario expressed in primary energy, final energy and useful energy. ... 151
Figure 52 – Final energy demand by energy carrier in Barreiro in 2008 and in 2020 reference scenario. ... 151
Figure 53 – Final energy demand by energy carrier in Households, Services, Transport and Street Lighting in Barreiro in 2008 and in 2020 reference scenario. ... 152
Figure 54 – Overall greenhouse gases emissions (Total) and greenhouse gases emissions without Industry and Agriculture sectors (Total H_S_T_ST) in Barreiro in 2008 and in 2020 BAU evolution. ... 153
Figure 55 – Display of the fulfilment of GHG emissions condition to the user in the alternative generation table. ... 158
Figure 56 – Screenshot of the alternative generation table for the alternative A1 – Diversified policies. ... 160
Figure 57 – Screenshot of the alternative generation table for alternative A2 – High diversified policies. ... 161
Figure 58 – Screenshot of the alternative generation table for alternative A3 – Lifestyles changes. ... 162
Figure 59 – Screenshot of the alternative generation table for the alternative A4 – Great Resilience. ... 163
Figure 60 – Screenshot of the alternative generation table for alternative A5 – Business changes. ... 164
Figure 61 – Screenshot of the alternative generation table for the alternative A6- Sustainable Barreiro. ... 165
Figure 62 – References ‘Good’ and ‘Neutral’ for each attribute. ... 168
Figure 63 – M-MACBETH judgements matrix for each objective. ... 169
Figure 64 – Value functions for each objective. ... 170
Figure 67 – Weights of the objectives (in percentages). ... 173
Figure 68 – Benefit value scores of alternatives for each objective. ... 175
Figure 69 – Robustness analysis. ... 177
List of Tables
Table 1 – Action plans reviewed. ... 24
Table 2 – Review of 10 energy and climate action plans (and associated documents). .. 24
Table 3 – Example of indicators included in the reporting of the progress of the energy and climate action plans of Cambridge, Seattle, Stockholm and Barcelona. Sources: City of Cambridge (2004); City of Cambridge (2005); City of Cambridge (2006); City of Seattle (2008a); City of Seattle (2008b); City of Seattle (2009); Hedvik (n.d.); Agència d’Energia de Barcelona (2006); Agència d’Energia de Barcelona (2008). ... 28
Table 4 – Application of selection criteria to the indicators. ... 36
Table 5 - Core set of local energy sustainability indicators resulting from step 6 in Figure 2. ... 39
Table 6 - Complementary set of local energy sustainability indicators resulting from step 6 in Figure 2. ... 39
Table 7 – Difficulties found in local data collection for computing the indicators for the municipality of Porto. ... 40
Table 8 – Characteristics of the participants involved in the testing stage. ... 42
Table 9 – Local energy sustainability indicators calculated by the participants during the testing stage. ... 43
Table 10 – Indicators not considered as very relevant by the participating local authorities. ... 44
Table 11 – Review of the framework of indicators after the testing stage. ... 45
Table 12 – State indicators. ... 47
Table 13 – Policy indicators. ... 47
Table 14 – Overview of existing energy models. Sources: Van Beeck (1999); SEI (2012); Aalborg University (n.d.); IAEA (n.d.); Spitz (2009); IIASA (2006); Loulou, Goldstein & Noble (2004); Graeber & Schlenzig (1998). ... 52
Table 15 – Identification of key socio-economic variables which influence energy demand for each sector. ... 85
Table 16 – Identification of local actors in local sustainable energy planning (based in Lahdelma, Salminem & Hokkanen, 2000; Coelho, Antunes & Martins, 2009; EU, 2010). 94 Table 17 – The local actors interviewed. ... 100
Table 18 – Local sustainable energy planning objectives. ... 104
Table 19 – Items found from the review of energy and climate action plans and guides that can be potentially identified with attributes. ... 107
Table 20 – Analysis of the indicators developed in chapter 2 in relation to the fundamental objectives. ... 108
Table 23 – Employment multipliers for different energy technologies. ... 122 Table 24 – Input data for the base year and identification of potential sources, assumptions or estimates. ... 133 Table 25 – Input data for the time horizon and identification of potential sources and projection method. ... 134 Table 26 – List of participants in the decision conference. ... 154 Table 27 – Objectives and attributes included in the multi-criteria evaluation model developed for Barreiro municipality. ... 154 Table 28 – Analysis of the final energy use of end-uses (in the reference scenario) to be tackled by each of the actions included in the catalogue of technical actions. ... 156 Table 29 – Results for the base year and for the 2020 reference scenario. ... 166 Table 30 – Impact matrix for the six alternatives. ... 166 Table 31 – Impact matrix for the six alternatives with relative values in relation to reference evolution. ... 167 Table 32 – Partial and overall benefit value scores of the alternatives. ... 174 Table 33 – Estimated investment needs for the implementation of the alternatives. .... 178 Table 34 – Incremental benefit and investment analysis of efficient alternatives. ... 180
19
1. Introduction
1.1 The transition to a new energy paradigm
Energy contributes to the satisfaction of human needs and aspirations, the major objective of development. It provides a variety of energy services to which access is fundamental to improve human welfare. Sustainable development has become a goal of our society and it must be the driver of energy planning as energy systems of today are still markedly unsustainable. Current energy systems are largely driven by the combustion of fossil fuels, which causes a number of negative impacts in the environment, in the society and in the economy. Impacts such as the greenhouse gases (GHG) emissions are considered to be the principal cause of climate change (IPCC, 2007); the depletion of natural resources affects the ecosystems and the wellbeing of human population; and, for many countries, the costs and risks on the security of energy supply due to the dependence of imported fossil fuels from other countries affect negatively the economy.
The need to shift to a new energy paradigm first emerged after the oil crisis of the 1970s. The deep concern with the implications of the conventional fossil fuel supply-side paradigm has led several authors to work out a new approach to energy planning. They suggested that the emphasis on energy planning needed to shift from expanding energy supply to improving energy use. Energy is useful as ‘it provides such services as cooking, lighting, heating, refrigeration, mechanical work, and personal and freight transport in ways that improve the quality of life’ (Goldemberg et al., 1987, p. 36). The important thing is to understand how and by whom different forms of energy are used today and how the energy end-use system might evolve in the future. The use of an end-use approach allows at identifying better ways of meeting future energy demand, by focusing on the level of energy services instead of the magnitude of energy consumption. Energy services can be increased not only by increasing the supply, but also by using energy more efficiently (Reddy, 2002).
Goldemberg et al. (1987) has also emphasised that energy is only one global problem, among other such as global economic crisis, poverty, population growth, nuclear risks, environmental degradation and climate change, that must be managed in order to achieve a sustainable world society. However, all these global problems are strongly
20
related to energy use. As so, the solution to the energy problem must contribute to, and be consistent with, the solutions of these other global problems.
The transition to sustainability, and thus to this new energy paradigm, has been referred to as the Sixth Wave of Industrialism (see Figure 1). According to Newman, Beatley & Boyer (2009), the Sixth Wave coincides with the end of cheap oil, which had its peak in the Fourth Wave and was still dominating the Fifth Wave. The cheap oil had consequences in cities such as the domination by automobiles and consequently the sprawling in every direction (automobile city). The Sixth Wave is thus ‘the beginning of an era of resource productivity and investment in new series of sustainability technologies related to renewables and distributed, small-scale water, energy, and waste systems […], all of which are more local and require far less fuel to distribute’ (Newman, Beatley & Boyer, 2005, p. 53). However, ‘it is clear that the changes needed for the resilient city are not just technology substitutions, they are in the business paradigms, the culture of the utilities that will provide the infrastructure, and the organisation that can enable new ways of managing our cities; every householder needs to be part of it’ (Newman, Beatley & Boyer 2005, p. 53).
Figure 1 - Waves of industrial innovation. Source: Hargroves & Smith (2005)
1.2 The focus on local action
The ‘global’ problem of climate change has its roots in the intensive use of energy, which is in turn used ‘locally’ to sustain local activities. Therefore, local authorities have a significant role to play in the new energy paradigm. Local authorities can take action in several of their roles in what regards community-wide energy management (CEMR,
21
Energie-Cités & Climate Alliance 2006): consumer and service provider, as responsible for many public buildings, street lighting and collective transport, using high amounts of energy; planner, developer and regulator, by taking strategic decisions on land use planning such as avoiding urban sprawl and as a regulator by setting energy performance standards; advisor and motivator, as responsible to inform and motivate citizens on how to use energy more sustainably; and as producer and supplier, by promoting the use of renewable energy.
Local authorities are able to visualise the details that are not seen by higher levels of government and are the ‘first responder’ to local issues, since local citizens and businesses turn to local leaders in times of emergency (Lerch, 2007). A decentralised design of policies allows for better fit local circumstances and citizens’ needs. ‘Citizens are also more likely to interact directly with their local government, providing greater opportunities for addressing local social acceptance issues by gaining support for local clean energy programs’ (Busche, 2010, p.4).
Agenda 21, the global action plan for Sustainable Development for the 21st Century highlights the need to ‘think globally, act locally’ (UNSD, 1992). The Aalborg Charter emphasises the capacity of local authorities to solve some of the global environmental problems, as they are close to where environmental problems are perceived and closest to the citizens (Charter of European Cities & Towns Towards Sustainability, 1994).
The European Union (EU) has made the fight against climate change a top priority. The EU Climate Action and Energy Package set a series of targets to be met by 2020 (Commission of the European Communities, 2008). Member States are obliged to curb their GHG emissions by at least 20%. Recognising the importance to act at the local level in the implementation of sustainable energy policies, the European Commission launched the Covenant of Mayors initiative in 2008, as mentioned in the EU Action Plan for Energy Efficiency (Commission of the European Communities, 2006). The initiative consists on the formal commitment of cities which aim to go beyond the objectives of the EU for 2020 in terms of reducing their GHG emissions through the implementation of a Sustainable Energy Action Plan. The initiative stresses the fact that cities must become the leading actors for implementing sustainable energy policies. The European Commission acts as ‘the political endorser and provider of moral, technical and visibility support’ (Torres & Doubrava, 2010, p. 95).
Since the 1990s that acting on energy and climate at the local level has been gaining expression. Several networks of local authorities in which their members commit to implement sustainable energy policies and actions with the aim of reducing GHG
22
emissions have been emerging worldwide. These networks started in Europe in 1990 with Climate Alliance (Climate Alliance, 2012) and Energy Cities (Energy Cities, 2012). At the international level, the International Council for Local Environmental Initiatives (ICLEI) launched the Cities for Climate Protection Campaign (ICLEI, 2008; ICLEI-Europe, 2012) in 1993 and in 2005 the C40 Cities Climate Leadership Group (network of the 40 world’s megacities) was created (C40 Cities, 2011). More recently, the Mexico City Pact (ICLEI, 2010) was launched at the World Mayors Summit on Climate held in 2010. It is expected to build on existing actions, such as the Covenant of Mayors in Europe or the US Conference of Mayors Climate Protection Agreement and the achievements of global advocacy through the Local Government Climate Roadmap.
1.3
What is local sustainable energy planning?
Planning is a decision process which consists on defining objectives and on identifying and choosing strategies to reach those objectives. ‘Planning is an iteractive procedure that needs to be reviewed when new problems arise, values of perceptions change, additional aspects have to be considered, new technologies or strategies become available or the institutional framework changes (Graeber & Schlenzig, 1998, p. 13). Planning is not a prediction of the future but is a technique that allows creating a rational basis for decision-making helping in providing policy recommendations (Graeber & Schlenzig, 1998).
The concept of local sustainable energy planning adopted in this thesis is rooted on the new energy paradigm (see section 1.1.), in which the focus of energy systems planning is on the level of services that energy provides to human beings. As the ultimate goal is sustainable development, economic, environmental and social dimensions must be considered in the energy planning process.
The main goal of local sustainable energy planning is thus to plan how future energy services needs could be satisfied in the presence of multiple sustainability objectives. A future energy system which reduces the side effects on the environment to a level within its assimilative capacity, and which raises opportunities for economic and social development, taking a longer-term perspective, is the basis to achieve greater sustainability.
The so-called reference scenario gives the expected evolution for a certain time horizon of the energy demand, based on current trends and compliance with legal requirements and policies foreseen today. The reference scenario is thus the basis to build and compare possible alternative strategies. The alternatives of action at the local
23
level refer to what energy demand side actions can be implemented and/or small-scale energy supply infrastructure (based on endogenous energy resources) can be deployed during the implementation period of the plan.
Since the planning is community-wide, the actions undertaken will have implications at several levels in the community: economic development, environmental protection and social welfare. The effectiveness of the implementation of actions depends on the receptivity by citizens and business, namely in changing their behaviours. Therefore, it is necessary to involve the local actors and consider their points of view in the energy planning, to ensure transparency and legitimacy of the process. The process shall result in the choice of an alternative based on the local actors’ values and preferences.
Local sustainable energy planning endeavours to assess and weight the impact of alternatives under well-defined and agreed environmental, economic and social objectives.
1.4
Local energy planning practices
First initiatives of energy and climate action at the local level can be tracked back into the 1990s. Although, it has been during the last decade that pioneer cities started to prepare their local energy and climate action plans in response to acting on climate change and other local motivations in an integrated manner. Particularly at EU level, the Covenant of Mayors initiative was a tipping point in the development of those action plans. By December 2012 more than 2,000 Sustainable Energy Action Plans have been prepared by local authorities and the number is expected to continuously rise (Covenant of Mayors Office, 2012).
Although a number of local energy and climate action plans can be identified, the topic is seldom documented in the scientific literature. As so, it becomes necessary to delve into local energy planning practices taking place on the ground. For this, it was decided to investigate a sample of local energy and climate action plans. An energy planning process typically results in the elaboration of an action plan which specifies the actions to be adopted in order to achieve the objectives.
The sample of action plans was identified in 2008 through a web search using the Google search engine and websites operated by local authorities known from previous research work (Neves, 2007). The selection of 10 municipalities with an energy or climate action plan was performed by ensuring representation of different geographic
24
contexts and municipality sizes. The sample comprises five United States (US) municipalities and five EU municipalities with published plans between 2002 and 2010 (Table 1). Some of the initial plans were updated since the start of this research, and those updates were included in the review as well. Two reasons were found that justify the update of the plans by the local authorities: the time horizon of the planning period was reached or was about to be reached, in the case of US municipalities and Barcelona (ES); EU municipalities engaged in the Covenant of Mayors, and have decided to update their action plan in line with the European Commission’s guidelines (EU, 2010). All information collected is based on information publicly available at the local authorities’ websites, namely the action plans and associated documents such as monitoring reports.
Table 1 – Action plans reviewed.
Municipality Country Title of action plan Plan year plan year Update Population
Cambridge
(Ca) US City of Cambridge climate protection plan. Local actions to reduce greenhouse gas emissions 2002 - 105,162
Chicago (Ch) US Chicago climate action plan. Our City. Our Future. 2008 - 2,695,598
Los Angeles
(LA) US GREEN LA. An action plan to lead the nation in fighting global warming. 2007 - 3,792,621 San Francisco
(SF) US Climate Action Plan for San Francisco. Local Actions to Reduce Greenhouse Gas Emissions. 2004 2009 805,235 Seattle (Se) US Seattle, a Climate Change: Meeting the Kyoto Challenge. Climate Action Plan. 2006 - 608,660
Almada (Al) PT Estratégia Local para as Alterações Climáticas 2007 2010 174,030
Stockholm
(St) SE Stockholm’s Action Programme against Greenhouse Gas Emissions. 2002 2010 837,031 Barcelona
(Bcn) ES Plan for Energy Improvement in Barcelona 2002 2010 1,624,537
Dublin (Du) IE Action Plan on Energy for Dublin 2008 2010 505,739
London (Lo) UK Action today to Protect Tomorrow. The Mayor’s Climate Change Action Plan. 2007 2010 7,825,200
The review of action plans aimed at investigating the steps undertaken and the issues considered by local authorities when drawing up their action plans. Table 2 summarises the main characteristics of interest to this thesis of the 10 action plans selected.
Table 2 – Review of 10 energy and climate action plans (and associated documents).
Items Ca Ch LA SF Se Al St Bcn Du Lo Total Diagnosis of current situation By sector and energy carrier 10 By end-use and energy carrier * 1 Definition of objectives Environmental 7 Economic 7 Social 6
Target setting GHG reduction 10
Other 1 Projections on energy demand or Reference/ business-as-usual scenario 7
25 Items Ca Ch LA SF Se Al St Bcn Du Lo Total GHG emissions 1-2 alternative scenarios 7 3 or more alternative scenarios 0 Basis for selecting the actions Definition of specific criteria for selection/ prioritisation
3
Past actions or actions from other plans of the municipality 2 Actions included in other municipalities’ action plans (best practices)
2
Inputs from
stakeholders 1
No reference in
the action plan 4
Estimates of the impact of actions/ alternatives in GHG emissions reduction 9 in other indicators 5 Definition of indicators for monitoring ** Overall energy sustainability indicators 4 Action progress-based indicators 4
* For residential and transport sectors.
** Indicators are normally found in municipalities’ monitoring reports.
Although some common features of action plans can be identified in Table 2, such as the diagnosis of current situation in terms of GHG emissions by sector and by energy carrier and the setting of a GHG emissions reduction target, there are great variations in local energy planning practices among municipalities.
A characterisation of energy consumption and GHG emissions by energy end-use categories is not a practice adopted by municipalities. Only the plan of Barcelona (Ajuntament de Barcelona, n.d.) contains such a disaggregated characterisation, but only for the residential and transport sectors.
GHG emissions reduction corresponds to the only target being adopted by the local authorities, with the exception of Dublin which adopts a target on energy use as well. Nevertheless, objectives at other environmental, economic and social levels are mentioned in about 70% of the action plans. This shows that albeit GHG emissions are an ultimate goal of energy planning, local authorities recognise the importance of energy planning in other sustainable development objectives. Chicago action plan states that
26
benefit from their efforts to reduce emissions. One result will be better air quality, leading to improved health for everyone. Raising the energy efficiency of buildings saves money, lowers housing costs for families and creates jobs, especially for local businesses. Economic development gets a boost. As people are able to live closer to work, schools and services, they enjoy a better quality of life’ (City of Chicago, n.d.). The same is
recognised by London’s action plan: ‘Reducing London’s CO2 emissions will not only
benefit the environment but also boost London’s economy, improve energy security and tackle fuel poverty, making it a better place to live and work’ (Mayor of London, 2010).
A considerable number of plans (7 out of 10) include a reference or business-as-usual scenario to show how current trends are projected into the future. However, the methodology and assumptions behind the construction of such scenario are not explicitly presented in none of the plans. Stockholm included assumptions on ‘population growth’ and ‘improvement of energy efficiency in buildings per year’ (City of Stockholm, 2002), while Almada adopted an annual growth-rate approach (based on European projection studies) (CMA & Ageneal, 2010). In addition to the reference scenario, usually one alternative scenario is considered – the one including the actions outlined in the action plan. Exceptions are Dublin (Codema, 2010) and Stockholm (City of Stockholm, 2002) energy action plans which consider two alternative scenarios to the reference scenario.
In what regards the process of selecting the actions included in the action plans, this is barely documented in the action plans reviewed. The basis for including actions on the plans is superficially mentioned in the action plans of Cambridge: ‘It builds on past
actions and proposes new actions (...)’ (City of Cambridge, n.d., p.3-5); San Francisco: ‘To develop this list of action items, we have drawn from several related plans and policies governing transportation, energy and recycling in the City (...)’ (SF Environment
& SFPUC, 2004, p.3-1); Barcelona: ‘When preparing its energy strategy, rather than
acting in isolation from the rest of the world, Barcelona took into account policies carried out by other cities’ (Ajuntament de Barcelona n.d., p.45); London: ’The approach taken in this action plan has been to set out a program that the Mayor is confident can be delivered in London and which prioritises initiatives that will achieve the greatest carbon emissions reductions most quickly and most cost-effectively’ (Mayor of London, 2007,
p.27); and Stockholm: ‘The City of Stockholm should have a certain control over the
measures; measures must not have a negative impact on other environmental objectives, and; measures must be as cost-effective as possible’ (City of Stockholm,
2002, p.11). The action plan of Chicago presents explicitly the criteria used for evaluating each action: ‘reduction potential – total achievable greenhouse gas emissions
reductions; cost-effectiveness – cost of implementation and the potential savings generated; feasibility – ease of achievement and potential to overcome barriers; benefits
27
and burdens – advantages and drawbacks to the action, such as savings to residents, job creation and quality of life improvements; regional impact – level of opportunity for the larger six-county area (Cook, Will, DuPage, Kane, McHenry and Lake); and rapid deployment – opportunity to effect changes quickly’ (City of Chicago, n.d., p. 17), but
the description of the procedure is lacking.
Estimates of GHG emissions reduction of actions or alternatives (set of actions) are included in most of the plans reviewed. Five plans presented quantification of the impact of actions in other indicators such as costs. Stockholm action plan quantified the impact of certain actions in terms of job creation while jobs generated by the implementation of Chicago’s Climate Action Plan were subjected to a specific study (Schrock & Sundquist, 2009).
The identification of indicators for monitoring in the action plans reviewed was only included in San Francisco and Seattle action plans. The indicators identified in these plans are easily-measurable indicators and specific to follow-up the progress of each particular action (action-based indicators). For instance, for the action on ‘Substantially increase the use of biofuels’ in Seattle’s action plan (City of Seattle, 2006), the indicator chosen is the ‘Number of biofuel stations in Seattle’. This indicator does not provide information on how much biofuel is actually being sold and consumed. Rather than focusing on evaluating the impact of the actions, indicators such as the one presented focus on the degree of implementation of the actions.
But the fact that indicators are not addressed in the action plans does not mean that local authorities are not using them at all. Indeed, it was found out that indicators are afterwards included in monitoring or progress reports. These reports aim at monitoring the implementation of the actions stated in the action plan and although essentially based on a qualitative description of the progress made, the reports contain indicators which vary between overall performance indicators (most frequent are GHG emissions by sector and energy consumption) and action or project-based indicators. Table 3 lists examples of indicators being adopted by four municipalities for monitoring purposes. The list excludes the action-based indicators included in the action plans of San Francisco and Seattle for being too action specific and diverse. The examples of indicators presented in Table 3 show that there is a wide variation on the indicators used among municipalities, and besides GHG emissions it is difficult to identify other common metrics.
28
Table 3 – Example of indicators included in the reporting of the progress of the energy and climate action plans of Cambridge, Seattle, Stockholm and Barcelona. Sources: City of Cambridge (2004); City of Cambridge
(2005); City of Cambridge (2006); City of Seattle (2008a); City of Seattle (2008b); City of Seattle (2009); Hedvik (n.d.); Agència d’Energia de Barcelona (2006); Agència d’Energia de Barcelona (2008).
Indicators Ca Se St Bcn
GHG emissions by sector
Per capita GHG emissions per sector
Residential emissions per household
Per capita residential electricity use
Electricity and natural gas consumption by sector
Use of electricity (total & per capita)
Electricity generated by source in the municipality
Renewable energy produced by source in the municipality
Final energy use by energy sources and by sector
Per capita water consumption
Bike to work day participants
Average Weekday Metro and Sound Transit Ridership
Energy consumption per square foot (of specific municipal buildings)
Vehicle miles travelled (or vehicle kilometre)
Vehicles registered
Waste and recycling collected by City
Solar Photovoltaic systems power installed
LEED certified and registered projects
Municipal vehicle fuel use
Energy source of district heating
Surface areaof solar thermal installed
From the review of action plans, it is possible to identify common practices on energy planning such as: the elaboration of diagnosis of the current situation in terms of energy demand, supply and GHG emissions; the setting of a GHG emissions reduction target; and the estimates of the GHG emissions reduction potential of the actions selected. The elaboration of a reference scenario (without plan) for a certain time horizon has also a considerable expression among the practices of the municipalities selected. Nevertheless, the practices in constructing a reference scenario or estimating the impact of actions or alternative scenarios are different given that the cities develop their own approaches and do not follow a common standard.
The fact that most of the action plans do not provide any background information about the methods adopted for selecting or prioritising actions seems to indicate that cities have not developed or followed a structured method for this particular task. Monitoring the implementation of an action plan appears to remain a challenge as well, namely in finding adequate and if possible common metrics to track progress towards local energy sustainability. The indicators need to provide a comprehensive overview of the behaviour and impacts of the local energy system. There is a need to shift towards
29
measuring things that should be measured instead of things that can be measured (Bell & Morse, 2008).
1.5 Research scope and methodology
This thesis addresses the methodological challenges of local energy planning identified in the previous section. The focus is on the methodological framework behind energy planning, namely on end-use energy modelling and on the generation and evaluation of alternative scenarios (or strategies) based on multiple sustainability objectives. Energy planning is a decision process and thus involves choices regarding the future of the community. In order to ensure transparency and make well-weighted choices it is important to include the values and preferences of the local actors into the energy planning process.
In this context, the key research question underlying this thesis is: How to develop a
methodology for decision support on local energy planning, which allows selecting a mid-term energy action plan based on local actors’ sustainability objectives and preferences?
In order to address the research question, the methodology intended to be developed in this thesis shall focus on the following features:
1) Include all the relevant energy demand sectors, end-uses, carriers, and end-use conversion technologies;
2) Provide a database of energy management actions to be included in the generation of alternative mid-term action plans and quantify their impacts;
3) Evaluate alternative mid-term action plans based on multiple strategic objectives of sustainable development that arise at the local level as well as local actors’ preferences on those objectives.
These features will be the ground upon which the decision support methodology for local sustainable energy planning will be designed (chapter 4). Being the features of multidisciplinary nature, it becomes necessary to explore methods from different disciplines (chapter 3) to support the design of the methodology, namely energy modelling techniques to aid in modelling the local energy system at the end-use level; problem structuring methods to help in defining the objectives of the local sustainable energy planning problem; and multi-criteria evaluation methods to support on the incorporation of multiple objectives and preferences from the local actors into the energy planning process. An eclectic approach will thus be used in the development of the methodology.
30
The territorial scope of this work is the local level. According to the Eurostat administrative division for EU Member States, the scope refers to municipalities or NUTS III (Nomenclature of Territorial Units for Statistics) levels. The reason for focusing on the local level is that local authorities own a great power and responsibility to promote energy sustainability in their administrative territories (see section 1.2).
Therefore, this thesis aims at developing a technically sound and scientifically based decision support methodology for local sustainable energy planning, which accommodates the multiplicity of objectives and preferences of local actors. It combines technical modelling with involvement of local actors, leading to the creation of a socio-technical approach to local energy planning. By adopting a comprehensive approach, the methodology proposed seeks to pave the way towards sustainable and inclusive local energy planning.
1.6 Thesis roadmap
The current chapter (chapter 1) introduced the issue of local energy planning and provided a review of current local energy planning practices. It also presented the research scope of this thesis, including the main research question and the key features of the decision support methodology for local sustainable energy planning intended to be developed in this thesis.
Based on the outcomes of the review of local energy planning practices (section 1.4), it was considered worth to investigate deeper existing indicators for local sustainable energy. The review has identified a lack of common and comprehensive metrics to evaluate local energy sustainability as well as a lack of methods for selecting appropriate actions to be included in local energy action plans. Thus, the aim of chapter 2 is twofold: to provide local authorities with acomprehensive set of indicators; and at the same time to initiate the first research step towards the development of the methodology with the identification of potential indicators (later called attributes) that may be used in the selection of actions/alternatives.
Chapter 3 provides an extensive review of background methods and theories to support the design of the methodology proposed in this thesis. The review of methods from different disciplines, such as energy systems modelling and multi-criteria decision analysis, aimed at identifying suitable methods to be integrated in the methodology as well as the needs for the development of new methods. The identification of those
31
methods and analysis of their suitability in line with the desired features of the methodology (section 1.5.) is performed in section 3.5.
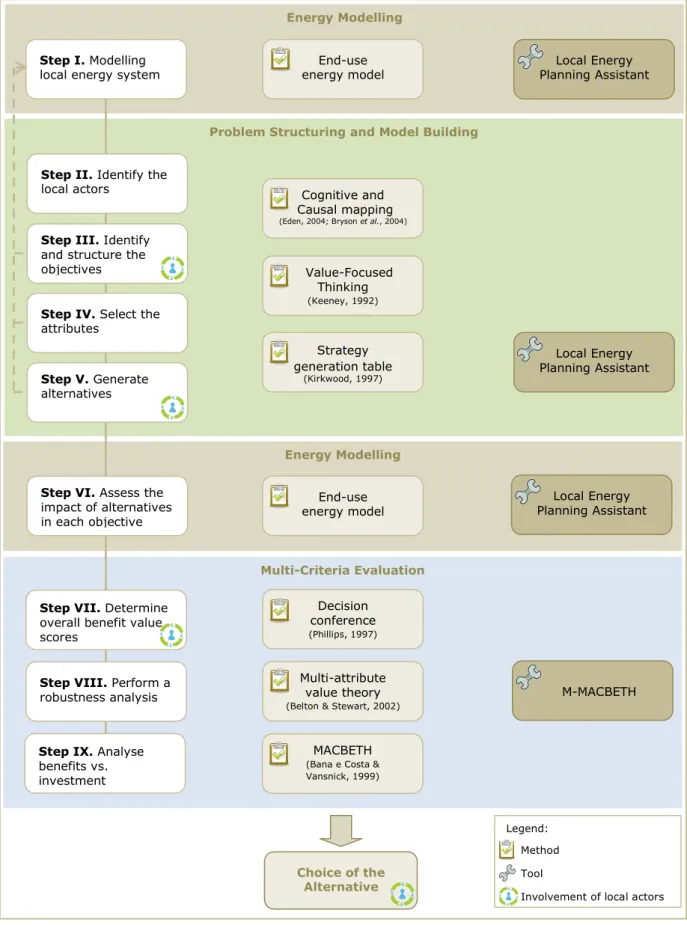
Chapter 4 describes in detail the proposed decision support methodology for local sustainable energy planning. The methodology is a patchwork of several methods, approaches and theories - energy modelling, cognitive/causal mapping, value-focused thinking, strategy generation table, decision conferencing, multi-attribute value theory and MACBETH. It adopts a socio-technical approach to the whole energy planning process – from structuring to the choice of the action plan, by combining social aspects resulting from the interaction with the local actors with technical aspects deriving from the application of models and tools.
Chapter 5 provides an application of the methodology for the municipality of Barreiro in Portugal. The whole process of application of the methodology is documented in this chapter, namely the application of the local energy planning assistant tool developed and the interaction with the local actors in the construction of the multi-criteria evaluation model.
The conclusions of this work are presented in chapter 6 as well as suggestions for future research.
1.7 Summary
This chapter introduced the issue of local energy planning and provided a review of current local energy planning practices. Throughout this chapter local sustainable energy planning was defined and the key issues that are addressed in this thesis were identified. In particular, this thesis aims at developing a decision support methodology for local sustainable energy planning, focused on modelling energy demand at end-use level and on the evaluation of alternative scenarios based on multiple objectives and local actors’ preferences. By adopting a comprehensive approach, the methodology proposed seeks to pave the way towards sustainable and inclusive local energy planning.
33
2. In-depth study of local energy sustainability
indicators
2.1 Introduction
The review on local energy planning practices in the previous chapter (see section 1.4) has shown that although indicators are being adopted by local authorities for monitoring their energy and climate action plans, there is a wide variation on the indicators used across municipalities. Indicators are frequently action-specific, being only developed to assess the progress on the implementation of each action and not the overall impact.
The reasons for having a chapter dedicated to local energy sustainability indicators are twofold: 1) the need for proposing comprehensive and potentially common metrics to evaluate local energy sustainability; and 2) the need for identifying indicators (later called attributes in chapter 4) to help in the choice of actions/alternatives during the energy planning process. The use of indicators in the planning stage has, very likely, the potential to help in the choice of actions to be integrated in energy and climate action plans, and therefore to provide new insights to conventional energy planning processes (Neves & Leal, 2010).
In this context, this chapter contains a review of existing energy-related indicators and proposes a framework of local energy sustainability indicators. The proposed framework of indicators aims at serving several functions within an energy planning process:
- Diagnosis – indicators allow providing a characterisation of the current status of the local energy system. The integration of environmental, social and economic indicators helps to see the broader picture of the local energy system – ‘Helicopter view’.
- Monitoring – indicators allow monitoring the progress towards the vision and objectives set at the beginning of the energy planning process.
- Benchmarking – indicators allow a solid basis for comparison with other municipalities. Municipalities are able to measure where they are in relation to other municipalities. For this, it is important to adopt the same calculation method and to take into account certain characteristics of local authorities such as demographic and economic factors when performing comparisons. Further recommendations on the calculation method of indicators are detailed in a methodological guide (appendix I).
34
- Planning – indicators can be used as attributes in a multi-criteria evaluation within the energy planning process, and in this way assist in the identification of the alternative that better suits the objectives identified.
The use of indicators has been considered a fundamental tool to measure sustainable development. Agenda 21, the United Nations’ action plan for sustainable development, which resulted from the United Nations Conference on Environment and Development in 1992, calls countries to develop indicators of sustainable development. These indicators need to be developed to provide solid bases for decision-making at all levels and to contribute to a self-regulating sustainability of integrated environment and development systems (UNSD, 1992). The Aalborg Charter, approved in 1994 by the European Conference on Sustainable Cities and Towns, commits the signatory local authorities to the use of different types of indicators, including those of urban environmental quality, urban flows, urban patterns, and indicators of urban systems sustainability. The indicators are considered to be a supporting tool for policy-making towards sustainability, useful to describe and monitor current status and progress (Charter of European Cities & Towns towards Sustainability, 2004).
2.2 Methodology
The development of the framework of local energy sustainability indicators encompassed several methodological steps as shown in Figure 2.
The first step consisted in performing a literature review of sets of energy and sustainable development indicators, namely the Energy Indicators for Sustainable Development (IAEA, 2005); the United Nations Commission of Sustainable Development (CSD) Indicators of Sustainable Development (United Nations, 2007); Sustainable Development Indicators proposed by Eurostat Task-Force (Eurostat, 2005); European Environment Agency core set of indicators (EEA, 2005); European Common Indicators (AIRI, 2003), and; Study on Indicators for Sustainable Development at the local level (JRC, 2004). Publications on sustainable development sets of indicators in Portugal (APA, 2007) and in Switzerland (Montmollin & Altwegg, 2000) were also included in the literature review. Starting by performing this literature review aimed at ensuring that this work would not ‘reinvent the wheel’, but instead ‘adapt the wheel’ to the context of local energy sustainability.
The European Common Indicators (AIRI, 2003) report and the Study on Indicators for Sustainable Development at the local level (JRC, 2004) were designed only for the local level. In the case of the European Common Indicators, the indicators have been
35
developed according to a bottom-up approach, involving an extensive consultation with local authorities (AIRI, 2003). A bottom-up approach was also adopted in the development of the framework of local energy sustainability indicators herein proposed.
The choice of reviewing publications on indicators oriented to both national and local levels as well as of reviewing publications with a broader scope than only energy was due to the lack of sufficient works on energy-related indicators oriented to the local level. This has called attention to the newness of the topic and again to the need of developing the framework of indicators.
Figure 2 - Methodology adopted for the development of the framework of local energy sustainability indicators.
Step 2 in Figure 2 consisted in identifying the energy-related indicators included in the eight publications reviewed. This resulted in the identification of 110 indicators. Figure 3 shows the number of energy-related indicators in the overall number of indicators in each publication.
S te p 1 Final set Selected set Unique set Energy-related set
1. Relevance for sustainable development
2. Coverage of the main dimensions of sustainability Selection of the indicators to integrate the core set
1. Testing with a case study: Porto municipality
Core set Complementary set Proposal of adaptations
Proposal of new indicators Identification of gaps 1. Relevance for local energy sustainability 2. Measurability at the local level
3. Power of the local authority to change outcomes Application of selection criteria
Identification of similarities and elimination of repetitions
Literature review of existing sets of indicators
Pick-up the energy-based indicators
Testing the indicators State Indicators
Policy Indicators S te p 2 S te p 3 S te p 4 S te p 5 S te p 6 S te p 7 Fe edb ack Rev ie w
36
Figure 3 – Representativeness of energy-related indicators in each set of indicators.
In step 3 (Figure 2), similar indicators were removed from the set. This resulted in 59 indicators. Step 4 consisted in the application of three selection criteria:
1) Relevance of the indicator for local energy sustainability; 2) Potential measurability at the local level;
3) Power of the local authority to change the outcomes measured by the indicator.
The indicators that fulfilled simultaneously the three criteria were eligible for the following step. The selection process is documented in Table 4.
Table 4 – Application of selection criteria to the indicators.
Indicator Criteria Relevance for local energy sustainability Measurability at the local level Roles of Local authorities
Share of households (or population) without electricity or
commercial energy
Share of household income spent on fuel and electricity Household energy use for each income group and
corresponding fuel mix
Accident fatalities per energy produced by fuel chain
Energy use per capita
Energy use per unit of GDP
Efficiency of energy conversion and distribution
Reserves-to-production ratio
Resources-to-production ratio
Industrial energy intensities
Agricultural energy intensities
Service/commercial energy intensities
Household energy intensities
Transport energy intensities
Fuel shares in energy and electricity
Non-carbon energy share in energy and electricity
Renewable energy share in energy and electricity
End-use energy prices by fuel and by sector
Net energy import dependency
Stocks of critical fuels per corresponding fuel consumption
GHG emissions from energy production and use, per
capita and per unit of GDP
0 15 30 45 60 75 90 105 120 135 150 165 [8] [9] [20] [10] [21] [11] [12] [13] Total Energy-related indicators
1 UN Indicators of Sustainable Development 2 Eurostat Sustainable Development Indicators 3 European Common Indicators
4 EEA Core Set of Indicators
5 JRC Indicators of Sustainable Development at the
Local Level
6 Sustainable Development Indicators for Portugal 7 Sustainable Development Indicators for
Switzerland
8 IAEA Energy Indicators for Sustainable