INTRODUCTION
Current interest in complex inheritance is motivated by the positional cloning paradigm that seeks to map an oligogene affecting disease susceptibility as a prelude to cloning, sequencing, functional studies and potential medi-cal application. The chromosome region that is scanned may be the whole genome or a candidate suggested by func-tion or by preliminary evidence from linkage or allelic as-sociation. Published studies are rarely decisive for mod-erate effects and never have high power for small effects. Consequently the literature provides numerous samples for a particular chromosome region, differing in phenotype definition, population, genetic markers, selection of probands and relatives, and statistical methods. The com-mon denominator is a significance level assigned by large-sample theory or simulation, perhaps one-tailed or with a Bonferroni correction for the number of tests performed. Few investigators realise that estimation of location intro-duces an extra degree of freedom that affects significance levels which, although peer-reviewed, are subject to many ambiguities, errors and biases. However, apart from func-tional and cytogenetic studies they are presently the only basis for mapping in the absence of costly collaborations that discard much of the evidence and are opposed by a competitive tradition now reinforced by industrial secrecy. Here we develop a theory for meta-analysis of published studies, apply it to a database on atopy and asthma, and de-fine candidate regions.
MATERIAL AND METHODS
Ideally evidence from each study on multiple mark-ers in a particular candidate region would be summarised by a multipoint lod evaluated at the location of each marker, conditional on genetic parameters (Lio and Morton, 1997). However, this is impossible for nonparametric methods and impractical for a fully parametric model, which cannot rep-resent complex inheritance accurately. Weakly parametric methods summarise relations between genotypes and phe-notypes by a parsimonious model in which frequencies and penetrances are confounded without distorting the effect of recombination (Morton and Collins, 1998). These mod-els are variously parametrised, of uncertain relative effi-ciency, not yet in general use, and so are more appropriate for collaborative studies that adopt the same genetic map, although not necessarily the same phenotypes or markers. We therefore consider evidence from a single marker that may be summarised by a nominal significance level P with χ2
2 = -2 ln P and corresponding χ 2
1, from which the lod if the sample gives evidence against the null hypothesis is z = χ 2
1/(2 ln 10). Some studies report χ 2
m, which may be trans-formed through P to z (Morton, 1998). There are several ways to estimate P for the NPL statistic in GENEHUNTER, and the results may be strikingly different (e.g. Hizawa et al., 1998). A variant computes a one-tailed P value by simu-lation and converts 2P to a lod as above, but a nominal χ 2
1 is more usual and more likely to be conservative than other approximations. With other computer programs we accept
Mapping oligogenes for atopy and asthma by meta-analysis
A. Collins, S. Ennis, W. Tapper and N.E. Morton
Abstract
Meta-analysis is presented for published studies on linkage or allelic association that have in common only reported significance levels. Reporting is biassed, and nonsignificance is seldom quantified. Therefore meta-analysis cannot identify oligogenes within a candidate region nor establish their significance, but it defines candidate regions well. Applied to a database on atopy and asthma, candidate regions are identified on chromosomes 6, 5, 16, 11, 12, 13, 14, 7, 20, and 10, in rank order from strongest to weakest evidence. On the other hand, there is little support for chromosomes 9, 8, 18, 1, and 15 in the same rank order. The evidence from 156 publications is reviewed for each region. With reasonable type I and II errors several thousand affected sib pairs would be required to detect a locus accounting for 1/10 of the genetic effect on asthma. Identification of regions by a genome scan for linkage and allelic association requires international collaborative studies to reach the necessary sample size, using lod-based methods that specify a weakly paramet-ric alternative hypothesis and can be combined over studies that differ in ascertainment, phenotypes, and markers. This has become the central problem in complex inheritance.
the published P value, which may not consider the number of tests and so the evidence is less reliable for allelic as-sociation than for linkage. A report of “nonsignificant” with no further specification is assigned z = 0, which is the mini-mum value for the MLS and similar statistics (Holmans, 1993; Kruglyak and Lander, 1995). Lods give evidence against the alternative hypothesis by taking negative val-ues. Truncation to nonnegative values is a patent bias that could be avoided if valid lods were reported instead of sig-nificance levels, χ2, MLS, or other statistics that obscure evidence against the alternative hypothesis.
When significance tests for a particular marker in a given study were reported for several correlated traits, we accepted at most one asthma phenotype and one atopy phenotype. A global trait like asthma score was preferred to a component trait like bronchial response. In the ab-sence of a global trait we averaged lods over component traits. A few studies included eosinophils, which we con-sidered separately but grouped with asthma for compari-son with atopy.
For analysis samples falling into a bin of i ± 0.5 cM on the sex-average map (where i is an integer) are attrib-uted to the included marker with the most samples. Here-after only markers with at least one lod greater than zero are considered. Given n nominally independent lods z1, ...
zn for a particular marker, (2 ln 10) ∑ zi is taken as χ2 n and
transformed to a summary lod Z. The maximum Z in a re-gion is denoted ZM. Heterogeneity among samples within the marker is tested as χ2
n-1 = χ 2
n - (2 ln 10) Z. Treating the
N markers in a region as independent, χ2
N = (2 ln 10) ∑ Z
with corresponding lod ZR. Heterogeneity among markers is tested as χ2
N-1 = χ 2
N - (2 ln 10) ZR with corresponding lod ZH.
To identify candidate regions we select Z in descend-ing order, but not within 40 cM of a marker already se-lected, using the currently best sex-average genetic coor-dinates in the location database LDB (Collins et al., 1996a), and continue until the largest remaining Z is less than 1. Let the ordered set of selected locations for a given chro-mosome be ci, ..., cr, where c1 is closest to pter, the telom-ere of the short arm. Each of the r candidate regions is bounded by the midpoint of the intervals to the next se-lected marker or (at ends) by the telomere. Some candi-date regions will contain more than one disease locus and therefore be partitioned as evidence accumulates. Con-versely adjacent candidate regions may be merged or the boundary shifted. The human genome is divided by this pro-cedure into fewer than 100 potential regions. Although unlikely to reach conventional significance levels by chance, one or more may appear significant through biassed report-ing of positive results (Morton, 1998).
A limitation of mapping methods based only on
sig-nificance levels is that we must assume wrongly that each of nj samples within the jth marker has equal information. Then for all N markers within a region with χ 2 > 0 the com-posite likelihood is assumed to follow the Malecot equa-tion (Collins and Morton, 1998), ln L = - ∑nj [χj - C - (1-C)
A exp (- Bdj)]2/2V where χ
j = (2 ln 10) Zj/nj > 0, dj = δj (Sj
- S ), and δj = 1 if Sj≥ S or -1 else. Here Sj is the location of the jth marker and S is the location of the disease gene estimated by maximum likelihood. The nuisance param-eters describe the maximum in a region (A), the decline of linkage or allelic association with distance (B), and the bias (C) due to exclusion of nonsignificant reports that are rep-resented in the data by χ2 = 0. Usually linkage and allelic association are pooled within and among loci, and then a single value of B is estimated for each region. The residual χ2 for a region is estimated with N-q degrees of freedom, where q is the number of parameters estimated. The corre-sponding error variance, assumed independent of region, is V = ∑χ2/∑ (N - q), where summation is over all regions. We considered 4 subhypotheses of the Malecot model:
1. maximum likelihood estimates A, B, C, S (q = 4, V1 = 0.78)
2. A, B, S C = 0.321 (q = 3, V2 = 0.82)
3. C A = B = 0 (q = 1)
4. A = B = 0, C = 0.321 (q = 0)
where 0.321 was the mean of C over the 29 regions under the first subhypothesis. Then if the corresponding value of -2 ln L for a given region under V = 1 is yi (i = 1, ...,4), there are three tests of the Malecot model:
(y4 - y2)/V2, d.f. = 3 → Z1
(y4 - y1)/V1, d.f. = 4 → Z2
(y3 - y1)/V1, d.f. = 3 → Z3
Each of these Z values is associated with 1 d.f. (like ZM, ZH, ZR defined above) and in large-sample theory may be multiplied by 2 ln 10 to give a chi-square under a spe-cific pair of hypotheses. Z1 tests the hypothesis that A = B = 0 when C is constant among regions. Z2 tests the hypoth-esis that C is constant among regions and A = B = 0. Z3 tests the hypothesis that A = B = 0 when each region has its own value of C. These tests have different sensitivity to variations in C and to the shape of one or more peaks. For example, Z3 has low power to detect peaks extending over most of the region.
There have been frequent attempts to summarise evi-n
i = 1
N
i = 1
^ ^
^
^ ^ ^ ^
^ ^ ^ ^
dence on complex inheritance without a database (e.g., Duffy, 1997; Perusse et al., 1997). Internet gives a general asthma database (http://cooke.gsf.de). We used a specialised database ASTHMALOD for significance levels reported by marker locus. At the end of 1998 it contained records from 156 publications on 518 loci, of which 446 had at least one nonzero lod. There were 403 marker bins. A computer program LITDAT updates genetic and physical locations and performs the above analysis (http://cedar.genetics.soton.ac. uk/public_html/.).
RESULTS
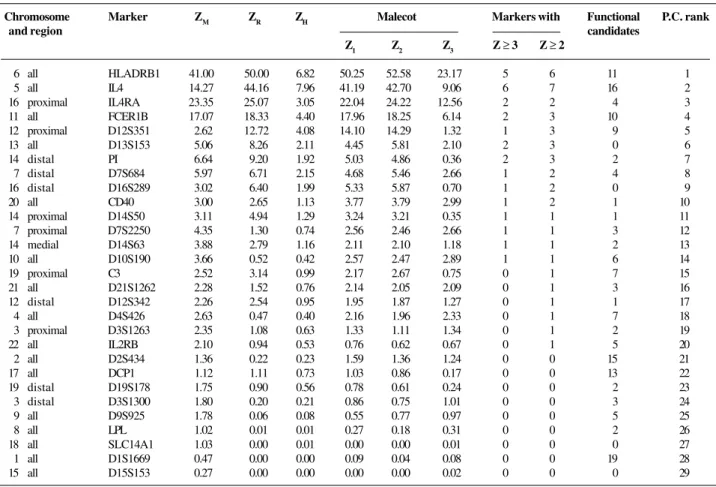
Data on all the autosomes have been reported, and for most of them there is at least one locus suggestive of linkage. Lods testing different aspects of the data are posi-tively correlated and may be summarised by the rank of the first principal component of the correlation matrix. Table I presents evidence on the autosomes in rank order. ZM and Z3 are highly correlated (r = 0.98), as are Z > 3 and Z > 2 (r = 0.95). Z1 and Z2 are almost completely correlated. The different statistics are nearly collinear, with the first prin-cipal component accounting for 91% of the variance, while the last six principal components account for only 2% of the variance. Z1, Z2, and ZR are all good predictors of the
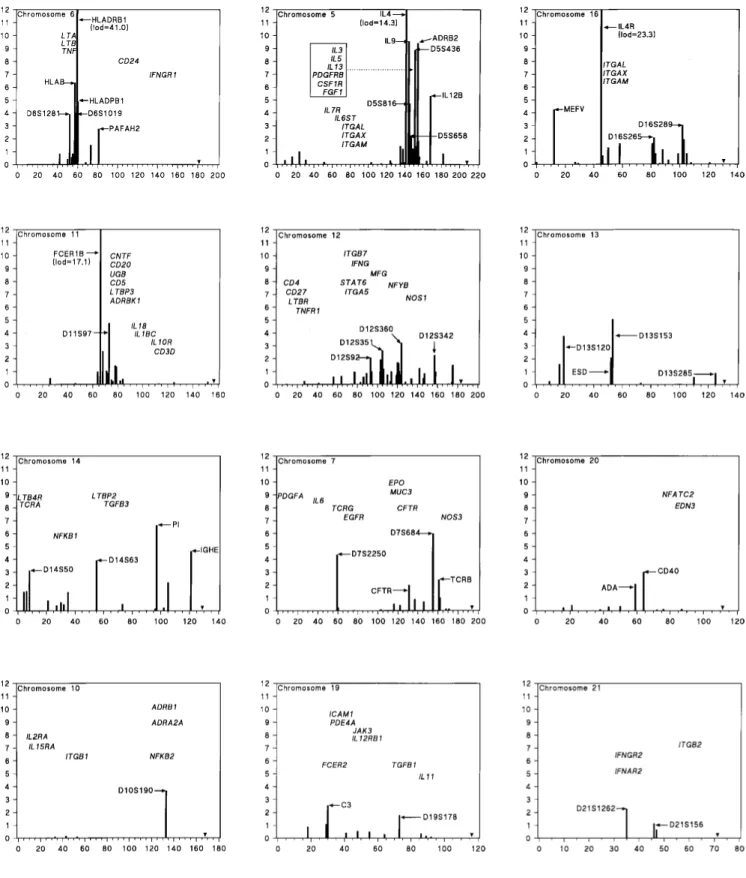
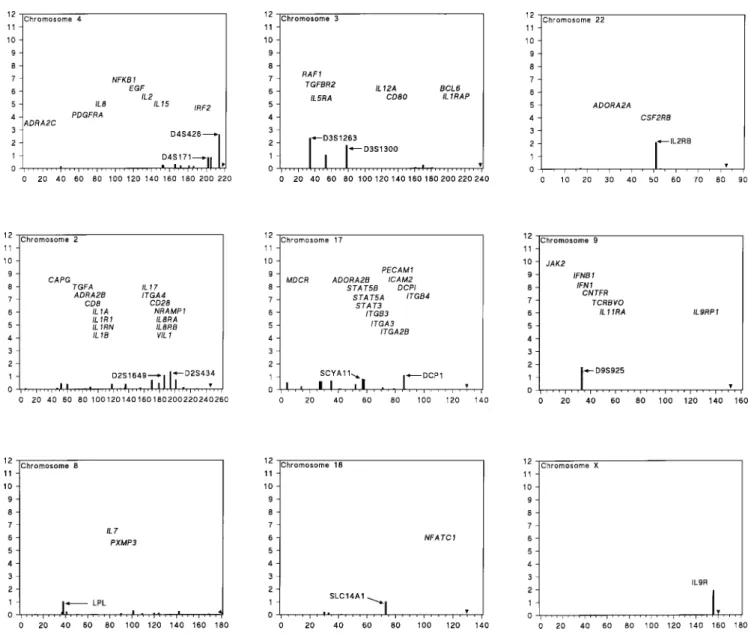
first principal component (r > 0.99), but the number of functional candidates is a poor predictor (r = 0.57). Chro-mosome 13 with no known functional candidates has strong evidence for at least one candidate region, whereas chro-mosomes 1 and 2 with many functional candidates have little evidence for a candidate region. Chromosomes 5, 6, 7, 11, 12, 13, 14, and 16 have at least one candidate region that appears to be well supported. Evidence for more than one region is strongest for chromosomes 7, 12, 14, and 16 (Figure 1).
Strong candidate chromosomes
Chromosome 6
The HLA region in chromosome 6 gives a strong sig-nal by all lods. Most of the evidence comes from the HLADRB1 marker with atopy (33 reports), but the 5 asthma reports are nominally significant and concordant (Z = 5.42, homogeneity χ2
1 = 2.94). Many of the results deal with spe-cific IgE or responses to spespe-cific allergens. Some of these are unusual, such as aspirin atopy and asthma produced by soybeans or isocyanate. Within the HLADRB1 bin are a few reports on closely linked markers in the HLAD re-gion. One study reported strong evidence for association
Table I - Chromosomes and candidate regions.
Chromosome Marker ZM ZR ZH Malecot Markers with Functional P.C. rank
and region candidates
Z1 Z2 Z3 Z ≥3 Z ≥ 2
6 all HLADRB1 41.00 50.00 6.82 50.25 52.58 23.17 5 6 11 1
5 all IL4 14.27 44.16 7.96 41.19 42.70 9.06 6 7 16 2
16 proximal IL4RA 23.35 25.07 3.05 22.04 24.22 12.56 2 2 4 3
11 all FCER1B 17.07 18.33 4.40 17.96 18.25 6.14 2 3 10 4
12 proximal D12S351 2.62 12.72 4.08 14.10 14.29 1.32 1 3 9 5
13 all D13S153 5.06 8.26 2.11 4.45 5.81 2.10 2 3 0 6
14 distal PI 6.64 9.20 1.92 5.03 4.86 0.36 2 3 2 7
7 distal D7S684 5.97 6.71 2.15 4.68 5.46 2.66 1 2 4 8
16 distal D16S289 3.02 6.40 1.99 5.33 5.87 0.70 1 2 0 9
20 all CD40 3.00 2.65 1.13 3.77 3.79 2.99 1 2 1 10
14 proximal D14S50 3.11 4.94 1.29 3.24 3.21 0.35 1 1 1 11
7 proximal D7S2250 4.35 1.30 0.74 2.56 2.46 2.66 1 1 3 12
14 medial D14S63 3.88 2.79 1.16 2.11 2.10 1.18 1 1 2 13
10 all D10S190 3.66 0.52 0.42 2.57 2.47 2.89 1 1 6 14
19 proximal C3 2.52 3.14 0.99 2.17 2.67 0.75 0 1 7 15
21 all D21S1262 2.28 1.52 0.76 2.14 2.05 2.09 0 1 3 16
12 distal D12S342 2.26 2.54 0.95 1.95 1.87 1.27 0 1 1 17
4 all D4S426 2.63 0.47 0.40 2.16 1.96 2.33 0 1 7 18
3 proximal D3S1263 2.35 1.08 0.63 1.33 1.11 1.34 0 1 2 19
22 all IL2RB 2.10 0.94 0.53 0.76 0.62 0.67 0 1 5 20
2 all D2S434 1.36 0.22 0.23 1.59 1.36 1.24 0 0 15 21
17 all DCP1 1.12 1.11 0.73 1.03 0.86 0.17 0 0 13 22
19 distal D19S178 1.75 0.90 0.56 0.78 0.61 0.24 0 0 2 23
3 distal D3S1300 1.80 0.20 0.21 0.86 0.75 1.01 0 0 3 24
9 all D9S925 1.78 0.06 0.08 0.55 0.77 0.97 0 0 5 25
8 all LPL 1.02 0.01 0.01 0.27 0.18 0.31 0 0 2 26
18 all SLC14A1 1.03 0.00 0.01 0.00 0.00 0.01 0 0 0 27
1 all D1S1669 0.47 0.00 0.00 0.09 0.04 0.08 0 0 19 28
Figure 1 - Candidate chromosomes. Maximal lods location in cM from pter. End of chromosome indicated by arrowhead.
of HLADQB1 with aspirin allergy, but no association with HLADRB1 (Kowalski et al., 1997). It is likely that more than one class II locus affects specific allergen response, to which the asthma association is secondary. On the con-trary, the TNF region is primarily associated with inflam-mation. The closely linked and partially homologous mark-ers TNF and LTA are binned with D6S1019, and all 8 re-ports are on asthma (Z = 3.97). TNF may be homologous with Bhr3, a locus for bronchial hyperreactivity in the mouse (De Sanctis et al., 1995). Two reports on the PAFAH2 locus for platelet activating factor distal to the HLA region suggest association of severe asthma with a low activity allele (Miwa et al., 1988, Stafforini et al., 1996; Z = 2.76). Proximal to the HLA region the bin for D6S1281 which includes D6S276 gives evidence of linkage to eosinophilia
(Daniels et al., 1996; Z = 3.29), dominating the pooled evidence from 6 samples (Z = 3.88). Heterogeneity be-tween the unreplicated eosinophilia report and the residual within the bin is significant ( χ2
1 = 4.60) suggesting that the candidate locus, if not a type I error, may predispose more to eosinophilia than to asthma or atopy.
Chromosome 5
sib pairs (Martinez et al., 1998). ADRB2 is associated with asthma and bronchial reactivity (D’Amato et al., 1998). IL12B shows linkage with atopy in the mouse (Gorham et al., 1996), but not in the human (Meyers et al., 1994). It would not be surprising if there were more than one candi-date locus in the cytokine region.
Chromosome 16
Our algorithm divides this chromosome into a proxi-mal region with candidates MEFV and IL4R, and a distal region in which two microsatellites have suggestive lods. Mutations in MEFV cause Mediterranean fever, an autoso-mal recessive disease commonly treated with colchicine. This drug is anti-inflammatory, and therefore likely to sup-press asthma to some extent. However, in one report pa-tients before diagnosis had a significantly lower frequency of asthma than controls (Ozyilkan et al., 1994). Whether or not MEFV homozygotes are at reduced risk for asthma, there is no evidence that heterozygotes are protected, and so MEFV is unlikely to play an important role in asthma even in populations where Mediterranean fever is common. The interleukin-4 receptor (IL4R), closely linked to an integrin cluster, is a stronger candidate for both atopy and asthma. Association with the Q576R polymorphism in IL4R has been reported (Yandava et al., 1998), but other studies are negative (Howard et al., 1998). In the distal region there is suggestive linkage of IgG to D16S265 (Wiltshire et al., 1998) and of IgE to D16S289 (Daniels et al., 1996), but no functional candidates.
Chromosome 11
The FCER1B locus gives significant evidence of link-age and association, primarily but not exclusively with measures of atopy, but its effect has been controversial (Thomas and Holgate, 1998). Several studies have suggested no linkage or association with paternal alleles. The only mechanism known to produce an allele-specific “parent-of-origin” effect is imprinting. This has not been reported for FCER1B in mice or humans, but nonexpression of pa-ternal alleles at some critical stage of a particular tissue cannot be excluded. Some studies have not observed dif-ferent risks in maternal and paternal transmission. There are several candidate loci in this region, and Adra et al. (1998) suggested that asthma susceptibility is determined by a locus distal to FCER1B.
Chromosome 12
This chromosome, divided into two regions, shows a broad peak that is therefore only weakly positive by Z3, but appears highly significant by other tests in the proximal region. The evidence comes from both asthma and atopy, whereas the distal region, including D12S342, is primarily supported by evidence from asthma (Wilkinson et al.,
1998). Although there are several candidates, none is strongly supported by allelic association.
Chromosome 13
The algorithm assigns the whole chromosome to one strongly supported region for which there are no functional candidates. Although two distinct peaks 30 cM apart are supported by measures of atopy and serum immunoglobu-lin levels, there is no intervening evidence (Wiltshire et al., 1998).
Chromosome 14
This is the only chromosome divided by our approach into three regions. The first includes D14S50, the alpha chain of the T-cell receptor TCRA and mast cell chymase 1, close to the leukotriene b4 receptor LTB4R. The medial region includes D14S63, where the evidence comes en-tirely from atopy (Mansur et al., 1999). The distal region includes the alpha-1-protease inhibitor PI in which the Z and S alleles are associated with asthma (Townley et al., 1990), and the IGH loci with some atopy-associated alle-les (Oxelius et al., 1998). In the future this region will prob-ably be divided.
Chromosome 7
In the proximal region D7S2250 (binned with D7S484) gives evidence of linkage to atopy, asthma, and eosinophilia (Daniels et al., 1996). Distally there is a higher peak around D7S684 that includes the cystic fibrosis trans-membrane conductance regulator CFTR (Dahl et al., 1998) and the beta chain of the T cell receptor TCRB (Noguchi et al.,1998).
Suggestive candidate chromosomes
The X chromosome is underreported, and conven-tional tests of sex linkage are not appropriate for the pseudoautosomal regions. A recent abstract suggests link-age with IL9R in the small pseudoautosomal region on the long arm (Holroyd et al., 1998). If the tests were one-tailed the nominal significance level corresponds to a multipoint lod of 3.23 for asthma by GENEHUNTER, but a smaller lod by two other methods. The GENEHUNTER NPL score is 2.98, corresponding to a lod of 1.93 by the normal ap-proximation.
a lod of 3.66 for linkage of IgA levels to D10S190 (Wiltshire et al., 1998), but other immunoglobulin levels are nonsignificant. Chromosome 19 has suggestive lods at C3 (Srivastava et al., 1985) and D19S178, which is binned with the anti-inflammatory locus TGFB1 (Marsh et al, 1997; Hobbs et al., 1998). Chromosome 21 has a peak lod of 2.28 for BHR at D21S1262, close to IFNAR2 and IFNGR2 (Ober et al., 1997). Asthma is not significant. Residual χ2 is significant (P = 0.002), reflecting scores of 1.12 and 0.68 for asthma with D21S156 and D21S1440 about 11 cM distally, near ITGB2 (Marsh et al., 1997).
On chromosome 4 a genome scan gives a lod of 2.63 for BHR with D4S426, near IRF2 (Daniels et al., 1996). In a second panel linkage of D4S426 is suggestive for IgE and atopy in maternal meiosis, but not in paternal trans-mission. Bronchial response was not measured. Most of the evidence favouring linkage to chromosome 3 comes from a linkage scan that included measurements of serum IgA, IgM, and IgG (Wiltshire et al., 1998). The D3S1263 marker near IL5RA gives a suggestive lod of 2.35 for IgG. At a distance of about 44 cM the D3S1300 marker gives a lod of 1.80 for IgA. Assessment of correlated phenotypes is difficult, and the authors concluded that “the marginal significance levels of the results ... require that these re-gions be investigated further to establish whether they are genuine linkages”. Adra et al. (1998) reported a lod of 1.35 for association between BCL6 HindIII genotypes and RAST scores, but not total or specific IgE levels.
Weak candidate chromosomes
Nearly all the data for chromosomes 1, 2 and 15 come from a single study that reported its nonsignificant findings (Marsh et al, 1997). The main exception is a lod of 1.48 for association of asthma with a promoter poly-morphism in IL10 on chromosome 1 (Hobbs et al., 1998). On chromosome 17 an insertion-deletion polymorphism in the angiotensin-converting enzyme locus is associated with ACE levels, and therefore is a candidate gene for asthma (Benessiano et al., 1997). In a case-control study the DD homozygote was associated with asthma. This lod of 1.12 is weak, but there is a functional rationale. Residual χ2 for chromosome 17 when this evidence is removed is barely significant (P = 0.04). The next largest lod of 0.83 is for the eotoxin locus SCYA11 (Lilly et al., 1997), at which the Ala27Thr homozygote is elevated in asthmatics. A func-tional effect of this allele is not known, but the authors note that “its position in the eotoxin sequence implies that it may alter the rate of eotoxin secretion.” The chromo-some 9 marker D9S925 in Hutterites gives a significance level for linkage to asthma that corresponds to a lod of 2.87, and weaker evidence for association with an unspeci-fied number of alleles. BHR was tested but not reported (Ober et al., 1997). Other CSGA data are negative, reduc-ing the lod to 1.78. The chromosome 8 evidence for link-age to asthma is not supported by atopy and was
consid-ered by its authors to be not confirmed (Brereton et al., 1994). The chromosome 18 marker SLC14A1 is the JK blood group, reported for suggestive linkage to serum IgE level in males only (Eiberg et al., 1985). From published results it seems unlikely that these weak candidate chro-mosomes harbour an important determinant of atopy or asthma. However, a larger sample, a different phenotype score, a more powerful ascertainment scheme, or an unre-lated population might well reveal oligogenes of low fre-quency or small effect.
DISCUSSION
Atopy and asthma illustrate all the problems that com-plex inheritance poses to genetics, statistics, and medicine. Recurrence risks estimate the logarithm of odds (β) as 1.06 for asthma and 0.49 for hay fever (Collins et al., 1996b). Assuming that family environment makes no contribution to β, that genetic effects are additive on this scale, and that hay fever is a good surrogate for atopy, a locus that ac-counts for 1/10 of the genetic effect would have a β value of about 0.1 for asthma and 0.05 for atopy. A sequential linkage test with reasonable type I and II errors would re-quire about 2000 affected sib pairs in the first case and 8000 in the second (Morton, 1996). A fixed sample size test with the same errors would need samples about three times as large (Morton, 1955). None of the national con-sortia approaches such sample sizes. Either international collaboration must be undertaken, or linkage abandoned in favour of allelic association with Bonferroni correction and controversial expected sample size, or the positional cloning paradigm will fail for most oligogenes.
will challenge variance component and other methods that assume random sampling and a continuous phenotype. Con-straints on lods that prohibit negative values such as the “possible triangle” of MLS (Holmans, 1993) invalidate summation of lods and weighted estimates of parameters. Valid methods specify an alternative hypothesis and give negative lods in regions where an excess of nonidentity by descent makes the estimated effect negative.
There is no consensus among genetic epidemiologists about optimal meta-analysis or its presentation. Gu et al. (1998) advocated the mean identity by descent (IBD) at a specified locus to combine extremely concordant and ex-tremely discordant sib-pairs for dichotomous and quanti-tative traits. Unlike lod-based methods, this approach to meta-analysis does not allow for more typical sib pairs, relatives other than sibs, allelic association, uncertainty about the number of alleles IBD or use of variance compo-nent models.
Recent evidence suggests that some candidate loci affect susceptibility to several inflammatory diseases, in-cluding asthma, inflammatory bowel disease, and rheuma-toid arthritis, while other loci are disease-specific (Becker et al., 1998; Zhang et al., 1999; Satsangi et al., 1999). Meta-analysis provides a way to test heterogeneity among diseases within a candidate region and to pool evidence on location where appropriate. We are currently extending ASTHMALOD to explore this approach.
Researchers on complex diseases differ in their will-ingness to combine evidence over multiple samples. Lumpers point to diseases associated with ABO blood groups or HLA, where the association extends to all ethnic groups. Split-ters point to malaria-dependent polymorphisms that had insufficient time to spread to all hyperendemic regions, and raise the possibility that different sets of loci produce different subtypes of disease in different populations. The number of degrees of freedom required to describe all hy-pothetical interactions is indefinitely large, making a Bonferroni correction of uncertain reliability and favouring Occam’s razor.
Correlations among different measures of atopy and asthma pose a problem that is both statistical and medical. How should correlated traits be assessed within and among studies? One approach has appealed to psychometricians who prefer a general factor for cognition and orthogonal specific factors. The first principal component of atopy and asthma scores may be an acceptable general factor for allergy, but the second principal component measures in-flammation by giving the highest score to intrinsic asthma with bronchial hyperreactivity and the lowest score to atopy without asthma, asymptomatic individuals falling in the middle. This is attractive for genetic analysis because the two orthogonal scores are able to distinguish loci that act primarily on atopy or inflammation. A more precise esti-mate of susceptibility to pulmonary inflammation is un-likely to be approved by an Ethical Committee. Until can-didate loci are confirmed and functionally characterised,
the genetic utility of different phenotype scores and clini-cal definitions will remain unsettled.
Current methods for positional cloning of oligogenes have at least one serious limitation, which may be to ran-dom samples or affected pairs, quantitative traits or affec-tion status, or like GENEHUNTER NPL they do not specify an alternative hypothesis and therefore give only an approxi-mation to lods (Kong and Cox, 1997), or they do not dis-tinguish maternal and paternal transmission to take advan-tage of sex-specific genetic maps and test for imprinting. We are now in a phase of consolidation aiming to identify and adopt the most efficient method for each situation, which must include combination of evidence over studies. As successful methods are introduced, they encoun-ter the problem that oligogenes have been named prema-turely, without confirmation in multiple samples. Workers on insulin-dependent diabetes have named putative oligogenes IDDMn, of which only IDDM1 and IDDM2 are securely established although not precisely localised in the HLA and INS regions, respectively (Lernmark and Ott, 1998). A substantial proportion of the other loci may be type I errors. Since markers identify candidate regions, it would be prudent to withhold names for unconfirmed oligogenes. Except for the largest effects, this implies that names should not be assigned until reliable methods to as-sess multiple samples are adopted.
RESUMO
Apresenta-se uma meta-análise de estudos publicados sobre associação alélica ou de ligação que têm em comum apenas os níveis de significância relatados. Os relatos são tendenciosos e a não-significância é raramente quantificada. Portanto, a meta-análise não pode identificar oligogenes dentro de uma região candidata nem estabelecer sua significância, mas define bem as regiões candidatas. Aplicando-se a um banco de dados sobre atopia e asma, as regiões candidatas são identificadas nos cromossomos 6, 5, 16, 11, 12, 13, 14, 7, 20 e 10, ordenados partindo-se das evidências mais fortes para as mais fracas. Por outro lado, há pouca evidência para os cromossomos 9, 8, 18, 1 e 15, na mesma ordem. As evidências obtidas em 156 publicações são revistas para cada região. Com erros tipo I e II aceitáveis, vários milhares de pares de irmãos afetados seriam necessários para detectar um loco responsável por 1/10 do efeito genético na asma. A identificação de regiões por uma avaliação geral do genoma visando a associação alélica e de ligação requer estudos colaborativos internacionais para atingir o tamanho necessário da amostra, usando métodos baseados em “lod” que especifiquem uma hipótese alternativa fracamente paramétrica e que possam ser combinados com relação a estudos que diferem em avaliação, fenótipos e marcadores. Este é o problema central em heranças complexas.
REFERENCES
between D11S480 and D11S1883. Am. J. Hum. Genet.63 (Suppl): A279 (Abstract 1607).
Becker, K.G., Simon, R.M., Bailey-Wilson, J.E., Freidlin, B., Biddison, W.E., McFarland, H.F. and Trent, J.M. (1998). Clustering of non-major histocompatibility complex susceptibility candidate loci in human au-toimmune diseases. Proc. Natl. Acad. Sci. USA95: 9979-9984. Benessiano, J., Crestani, B., Mestari, F., Klouche, W., Neukirch, F.,
Hacein-Bey, S., Durand, G. and Aubier, M. (1997). High frequency of a deletion polymorphism of the angiotensin-converting enzyme gene in asthma. J. Allergy Clin. Immunol.1: 53-57.
Brereton, H.M., Ruffin, R.E., Thompson, P.J. and Turner, D.R. (1994). Family atopy in Australian pedigrees: adventitious linkage to chro-mosome 8 is not comfirmed nor is there evidence of linkage to the high affinity IgE receptor. Clin. Exp. Allergy24: 868-877.
Collins, A. and Morton, N.E. (1998). Mapping a disease locus by allelic association. Proc. Natl. Acad. Sci. USA95: 1741-1745.
Collins, A., Frezal, J., Teague, J. and Morton, N.E. (1996a). A metric map of humans: 23,500 loci in 850 bands. Proc. Natl. Acad. Sci. USA93: 14771-14775.
Collins, A., MacLean, C.J. and Morton, N.E. (1996b). Trials of the β model for complex inheritance. Proc. Natl. Acad. Sci. USA93: 9177-9181. D’Amato, M., Vitiani, L.R., Petrelli, G., Ferrigno, L., di Pietro, A., Trezza,
R. and Matricardi, P.M. (1998). Association of persistent bronchial hyperresponsiveness with β2-adrenoreceptor (ADRB2) haplotypes. A population study. Am. J. Respir. Crit. Care Med. 158: 1968-1973. Dahl, M., Tybjaerg-Hansen, A., Lange, P. and Nordestgaard, B.G. (1998).
Delta F508 heterozygosity in cystic fibrosis and susceptibility to asthma. Lancet351: 1911-1913.
Daniels, S.E., Bhattacharrya, S., James, A., Leaves, M.I., Young, A., Hill, M.R., Faux, J.A., Ryan, G.F., LeSouef, P.N., Lathrop, G.M., Musk, A.W. and Cookson, W.O.C.M. (1996). A genome wide search for quantita-tive trait loci underlying asthma. Nature 383: 247-250.
De Sanctis, G.T., Merchant, M., Beier, D.R., Dredge, R.D., Grobholz, J.K., Martin, T.R., Lander, E.S. and Drazen, J.M. (1995). Quantitative lo-cus analysis of airway hyperresponsiveness in A/J and L57BL/6J mice.
Nat. Genet. 11: 150-154.
Dizier, M.-H., Sandford, A., Walley, A., Philippi, A., Cookson, W. and Demenais, F. (1999). Indication of linkage of serum IgE levels to the interleukin-4 gene and exclusion of the contribution of the (-590 C to T) interleukin-4 promoter polymorphism to IgE variation. Genet. Epidemiol.16: 84-94.
Duffy, D.L. (1997). Genetic epidemiology of asthma. Epidemiol. Rev. 19: 129-143.
Eiberg, J., Lind, P., Mohr, J. and Neilson, L.S. (1985). Linkage relationship between the human immunoglobin-E polymorphism and marker.
Cytogenet. Cell Genet. 40: 622 (Abstract).
Gorham, J.D., Guler, M.L., Steen, R.G., Mackey, A.J., Daly, M.J., Frederick, K., Dietrich, W.F. and Murphy, K.M. (1996). Genetic mapping of a murine locus controlling development of T helper 1/T helper 2 type responses. Proc. Natl. Acad. Sci. USA93: 12467-12472.
Gu, C., Province, M., Todorov, A. and Rao, D.C. (1998). Meta-analysis meth-odology for combining non-parametric sibpair linkage results: Genetic homogeneity and identical markers. Genet. Epidemiol. 15: 609-626. Hizawa, N., Freidhoff, L.R., Chiu, Y.-F., Ehrlich, E., Luehr, C.A.,
Ander-son, J., Duffy, D.L., Dunston, G.M., Weber, J.L., Huang, S.-K., Barnes, K.C., Marsh, D., Beaty, T.H. and Collaborative Study of the Genetics of Asthma (1998). Genetic regulation of Dermatophagoides pteronys-sinus-specific IgE responsiveness: A genome-wide multipoint linkage analysis in families recruited through 2 asthmatic sibs. J. Allergy Clin. Immunol. 102: 436-442.
Hobbs, K., Negri, J., Klinnert, M., Rossenwasser, L.J. and Borish, L. (1998). Interleukin-10 and transforming growth factor beta promoter polymorphisms in allergies and asthma. Am.J. Respir. Crit. Care. Med. 158: 1958-1962.
Holmans, P. (1993). Asymptotic properties of affected-sib-pair linkage analy-sis. Am. J. Hum. Genet.52: 362-374.
Holroyd, K., Martinati, E.T., Scherpbier, T., Eleff, S.M., Boner, A.L., Pignatti, P.F., Kiser, M.B., Dragwa, C.R., Hubbard, F., Sullivan, C.D., Grasso, L., Messler, C.J., Huang, M., Hu, Y., Nicolaides, N.C., Buetow, K.H. and Levitt, R.C. (1998). Asthma and bronchial hyperrespon-siveness linked to the XY long arm pseudoautosomal region. Genomics
52: 233-235.
Howard, T.D., Wiesch, D.G., Postma, D.S., Koppelman, G.H., Meyers, D.A., Stine, O.C. and Bleecker, E.R. (1998). Linkage and association stud-ies of the IL4 receptor (IL4R) gene on chromosome 16 in asthma and allergic phenotypes. Am. J. Hum. Genet. 63 (Suppl): A293 (Abstract 1694).
Kong, A. and Cox, N.J. (1997). Allele-sharing models: LOD scores and accurate linkage tests. Am. J. Hum. Genet.61: 1179-1188.
Kowalski, M.L., Bie Kiewicz, B., Woszezek, G., Pawliczak, R. and Mi, J. (1997). Association of the HLA-DQ, but not HLA-DR antigens with hypersensitivity to aspirin manifested by respiratory or skin symp-toms. J. Allergy Clin. Immunol.101: S189 (Abstract).
Kruglyak, L. and Lander, E.S. (1995). Complete multipoint sib-pair analy-sis of qualitative and quantitative traits. Am. J. Hum. Genet. 57: 439-454.
Lernmark, A. and Ott, J. (1998). Sometimes its hot, sometimes its not.
Nat. Genet. 19: 213-214.
Lilly, C.M., Nakamura, T., Weiss, S., Luster, A.D. and Drazen, J.M. (1997). A mutation in the eotaxin gene is associated with the asthma pheno-type. Am. Rev. Respir. Crit. Care Med.155: A490 (Abstract). Lio, P. and Morton, N.E. (1997). Comparison of parametric and
nonpara-metric methods to map oligogenes by linkage. Proc. Natl. Acad. Sci. USA94: 5344-5348.
Mansur, A.H., Bishop, D.T., Markham, A.F., Morton, N.E., Holgate, S.T. and Morrison, J.F.J. (1999). Suggestive evidence for genetic linkage between IgE phenotypes and chromosome 14q markers. Am. J. Respir. Crit. Care Med. (in press).
Marsh, D.G., Neely, J.D., Breazeale, D.R., Ghosh, B., Friedhoff, L.R., Ehrlich, E., Schou, C., Krishnaswamy, G. and Beaty, T.H. (1994). Link-age analysis of IL4 and other chromosome 5Q31.1 markers and total serum immunoglobin E concentrations. Science264: 1152-1156. Marsh, D.G., Maestri, N.E., Freidhoff, L.R., Barnes, K.C., Togias, A.,
Ehrlich, E., Beaty, T., Duffy, D., Rosenthal, R., Imani, F., Dunston, G., Furbert-Harris, P., Malveaux, F., Ober, C., Cox, N.J., Lester, L.A., Peterson, R., Gidley, J., Pluzhnikov, A., Anderson, J., Solway, J., Leff, A., Wolf, R., Wylam, M., Kurtz, B., Richardson, A., Parry, R., Blumenthal, M.N., King, R.A., Oetting, W., Drury, D., Rosenberg, A., Daniels, L., McEvoy, C., Lou, J., Hamra, M., Brott, M., Rich, S.S., Spray, B.J., Weber, J.L., Yuan, B., Wang, Z., Bleecker, E.R., Amelung, P., Rechstiner, B., Meyers, D.A., Samet, J., Wiesch, D., Xu, J., Murphy, S. and Banks-Schlegel, S. (1997). A genome-wide search for asthma susceptibility loci in ethnically diverse populations. Nat. Genet.15: 389-392.
Martinez, F.D., Solomon, S., Holberg, C.J., Graves, P.E., Baldini, M. and Erickson, R.P. (1998). Linkage of circulating eosinophils to markers on chromosome 5q. Am. J. Respir. Crit. Care Med.158: 1739-1744. Meyers, D.A., Postma, D.S., Panhuysen, C.I.M., Xu, J., Amelung, P.J.,
Levitt, R.C. and Bleecker, E.R. (1994). Evidence for a locus regulating total serum IgE levels mapping to chromosome 5. Genomics23: 464-470.
Miwa, M., Miyake, T., Yamanaka, T., Sugatani, J., Suzuki, Y., Sakata, S., Araki, Y. and Matsumoto, M. (1988). Characterisation of serum plate-let-activating factor (PAF) acetylhydrolase. J. Clin. Invest. 82: 1981-1991.
Morton, N.E. (1955). Sequential tests for the detection of linkage. Am. J. Hum. Genet.7: 277-318.
Morton, N.E. (1995). Lods past and present. Genetics140: 7-12. Morton, N.E. (1996). Logarithms of odds (lods) for linkage in complex
in-heritance. Proc. Natl. Acad. Sci. USA93: 3471-3476.
Morton, N.E. (1998). Significance levels in complex inheritance. Am. J. Hum. Genet. 62: 690-697.
Morton, N.E. and Collins, A. (1998). Tests and estimates of allelic associa-tion in complex inheritance. Proc. Natl. Acad. Sci. USA95: 11389-11393.
Noguchi, E., Masanao, S., Arinami, T., Takeda, K., Kobayashi, K., Matsui, A. and Hamaguchi, H. (1998). Evidence for linkage between the devel-opment of asthma in childhood and the t cell receptor beta chain in Japanese. Genomics47: 121-124.
E. (1997). Genome wide search for asthma susceptibility loci in the Hutterites. Am. J. Hum. Genet.A14: 213 (Abstract).
Oxelius, V.-A., Carlsson, A.-M. and Aurivillius, M. (1998). Alternative G1m, G2m and G3m allotypes of IGHG genes correlate with atopic and non-atopic pathways of immune regulation in children with bronchial asthma. Int. Arch. Allergy Immunol. 115: 215-219.
Ozyilkan, E., Simsek, J. and Telatar, H. (1994). Absence of asthma in patients with familial Mediterranean fever. 1st J. Med. Sci.30: 237-238.
Perusse, L., Chagnon, Y.C., Dionne, F.T. and Bouchard, C. (1997). The human obesity gene map: the 1996 update. Obes. Res.5: 49-61. Rioux, J.D., Stone, V., Daly, M., Cargill, M., Green, T., Nguyen, H., Nutman,
T., Zimmerman, P.A., Tucker, M.A., Hudson, T., Goldstein, A.M., Lander, E. and Lin, A.Y. (1998). Familial eosinophilia maps to the cytokine gene cluster on chromosomal region 5q31-q33. Am. J. Hum. Genet. 63: 1086-1094.
Ronchetti, R., Lucarini, N., Lucarelli, P., Martinez, F., Macri, F., Carapella, E. and Bottini, E. (1984). A genetic basis for heterogeneity of asthma syndrome in paediatric ages: Adenosine deaminase phenotypes. J. Allergy Clin. Immunol.74: 81-84.
Satsangi, J., Jewell, D., Parkes, M. and Bell, J. (1999). Genetics of inflam-matory bowel disease. A personal view on progress and prospects.
Dig. Dis.16: 370-374.
Srivastava, N., Gupta, S.P. and Srivastava, L.M. (1985). Association be-tween C3 complement types and bronchial asthma. Hum. Hered.35: 263-264.
Stafforini, D.M., Satoh, K., Atkinson, D.L., Jjoelker, L.W., Eberhardt, C., Yoshida, H., Imaizumi, T., Takamatsu, S., Zimmerman, G.A., McIntyre, T.M., Gray, P.W. and Prescott, S.M. (1996). Platelet-activating factor acetylhydrolase deficiency: a missense mutation near the active site of an anti-inflammatory phospholipase. J. Clin. Invest. 97: 2784-2791. Thomas, N.S. and Holgate, S.T. (1998). Editorial. Genes for asthma on
chromosome 11: an update. Clin. Exp. Allergy28: 387-391. Townley, R.G., Southard, J.G., Radford, P., Hopp, R.J., Bewtra, A.K. and
Ford, L. (1990). Association of MS PI phenotype with airway hyperresponsiveness. Chest98: 594-599.
Wilkinson, J., Grimley, S., Collins, A. and Morton, N.E. (1998). Linkage studies of asthma and atopy on chromosome 12. Genomics53: 251-259. Wiltshire, S., Bhattacharyya, S., Faux, J.A., Leaves, N.I., Daniels, S.E., Moffat, M.F., James, A., Musk, A.W. and Cookson, W.O.C.M. (1998). A genome scan for loci influencing total serum immunoglobulin lev-els: possible linkage of IgA to the chromosome 13 atopy locus. Hum. Mol. Genet. 7: 27-31.
Yandava, C.N., Pillari, A., Lilly, C.M. and Drazen, J.M. (1998). An asso-ciation of interleukin-4 α receptor gene mutation and asthma and atopy.
Am. J. Hum. Genet.63 (Suppl): A346 (Abstract 2005).
Zhang, Y., Lefont, J., Kearsey, V., Lapa e Silva, J.R., Cookson, W.O. and Vargaftig, B.B. (1999). A genome-wide screen for asthma-associated quantitative trait loci in a mouse model of allergic asthma. Hum. Mol. Genet. 8: 601-605.