Universidade de Trás-os-Montes e Alto Douro
The Asinina de Miranda donkey breed (Equus asinus):
demographic analysis and
characterization of the reproductive cycles
PhD dissertation in Veterinary Sciences – Clinical Area
Miguel Nuno Pinheiro Quaresma
Supervisor: Professora Doutora Rita Maria Payan Carreira
This work was partially sponsored by the Portuguese Science and Technology Foundation (FCT) under the Project PEst-OE/AGR/UI0772/2011 and 2014.
I declare that the contents of this thesis are my own work and that they have not been presented to any University other than the University of Trás-os-Montes and Alto Douro.
Abstract
Donkeys play a very important role in the ecological maintenance of rural areas. The interest in their conservation and characterization has increased over the last years. The main purpose of this work was to augment the knowledge on the demographic and reproductive characteristics of the Asinina de Miranda breed, giving scientific support to implement more effective conservation and breeding strategies. These objectives were accomplished through different approaches. For the purpose of demographic analysis, the Foal and Studbooks were analysed, along with a survey to donkey owners
.
To predict the progression of the breed under the current management system and to identify variables vital for the breed survival, a population viability analysis (PVA) program was applied, showing that the breed is currently at risk of extinction. The pedigree and herd records of this donkey breed were also analysed to identify genealogical and human factors that may affect the breed genetic diversity in the future. The most critical factor for breed survival was the percentage of females breeding per year but the actual percentage needed was dependent of the carrying capacity of the breed. Reducing female mortality, age at first offspring production, assuring the register on the Studbook and tracking of the foals will also significantly foster the breed recovery and maintenance. The overall neonatal mortality for the first month of life was 8.92%, being lower in females (6.51%) than in males (12.0%). The foal neonatal mortality was unevenly distributed throughout the year and lowers when females were 5 to 15 years old (8.06%), compared to younger than 4 years or older than 16 years at foaling (respectively 10.3% and 14.1%). The main identified factors for inbreeding risk were the low breeding rates, the low number of males and their unequal contribution to the genetic pool, the unequal contribution of the herds to genetic pool and the advanced age of herd owners.For the purpose of the reproductive cycle characterization of the jennies a group was followed, both during the breeding and non-breeding seasons, by ultrasonography and serum progesterone determinations for two years. The changes of body condition score (BCS) were regularly checked to test its putative effect on the ovarian activity. To access BCS, different methods were compared to find the one more sensitive to the changes in body adiposity. BCS was evaluated both by visual and palpation appraisal and by real time ultrasonography (RTU) of subcutaneous fat and thoracic wall tissue depths. A significant correlation was established between BCS and all RTU measurements. The study also showed that RTU measurements
- viii -
have a logarithmic relationship with BCS and that RTU, combined with image analysis, permits accurate fat and tissue depths measurements to monitor fat reserves in jennies.
During the breeding season, the interovulatory interval was 23.8 ± 0.551 days, with diestrus and estrus lasting 17.9 ± 0.462 and 6.65 ± 0.298 days, respectively. Age and BCS affected the length of the interovulatory intervals in the breeding season; BCS also influenced the diestrus length and the time in heat after ovulation. The incidence of single, double and triple ovulations was 57.58%, 36.36% and 6.06%, respectively. Multiple ovulations extended the interval from beginning of estrus to ovulation, but had no effects on the other periods. When combined with age, higher BCS also affected the ovulation rate. Divergence of the dominant follicle occurred around day -8.7 (day 0 = ovulation), independently of the ovulation rate. The dominant follicle was larger at divergence in single ovulators than in multiple ovulators (19.18 ± 0.968 mm vs. 18.05 ± 1.16 mm). Similarly, the maximum follicular diameter before ovulation was larger in single ovulatory cycles than in multple ovulatory cycles (40.2 ± 1.41 mm vs. 37.2 ± 0.825 mm, respectively). The daily growth rate of dominant follicles was independent of the ovulation rate for the period preceding heat or during heat.
The study of the reproductive patterns in the non-breeding season relied on the surveillance of the jennies reproductive cycles from September to May. It was found that 75% (9:12) of the females presented disruption of the normal pattern of ovarian activity during this period. Loss of the normal cyclicity included anestrus (41.7%), silent ovulatory estrus (25%), or persistency of corpus luteum (8.3%). Only 25% (3:12) of the females retained regular cyclicity during this season. The study also showed that disrupted ovarian cycles might be triggered in jennies if BCS decreases below a given threshold between autumn equinox and winter solstice, suggesting that BCS modulates the seasonal influences on ovarian cyclicity in jennies.
Keywords: Donkey, Population Viability Analysis, Pedigree, Reproductive cycles,
Resumo
Os asininos desempenham um papel fundamental no equilíbrio ecológico das zonas rurais. O interesse na sua conservação e caracterização aumentou nos últimos anos. O principal objetivo deste trabalho foi o de aumentar o nível de conhecimento da demografia e reprodução da população da raça Asinina de Miranda, fornecendo suporte científico à implementação de estratégias de conservação e maneio. Estes objetivos foram alcançados através de uma aproximação multidisciplinar. Para a análise e caracterização demográficas, analisaram-se os Livros Genealógico e de Nascimentos, complementando-se a informação obtida com um inquérito aos proprietários dos animais. No sentido de prever a progressão da raça sob as atuais condições de maneio e de identificar as variáveis vitais à sua sobrevivência, utilizou-se um programa informático de análise de viabilidade de população, que mostrou que a raça está atualmente em risco de extinção. Os registos genealógicos e dos criadores foram igualmente analisados para identificar fatores humanos e genealógicos que possam vir a afetar a diversidade genética da raça. O principal fator limitante para a sobrevivência da raça foi a percentagem anual de fêmeas em reprodução, estando esta percentagem dependente da população existente. Outros fatores importantes para a recuperação e manutenção da raça foram a redução da mortalidade das fêmeas, idade ao primeiro parto, registo no Livro Genealógico e rastreabilidade dos animais. A taxa de mortalidade dos burrancos no primeiro mês de vida foi de 8,92%, mais baixa nas fêmeas (6,51%) que nos machos (12%). A mortalidade neonatal esteve distribuída de forma não uniforme ao longo do ano, sendo igualmente menor em fêmeas com idades ao parto compreendidas entre os 5 e 15 anos (8,06%), em comparação com as fêmeas de idade inferior a 4 anos ou superior a 16 anos (10,3% e 14,1%, respetivamente). Os principais fatores de risco para o aumento da consanguinidade foram as baixas taxas de reprodução, o reduzido número de machos e a sua desigual contribuição para a genética populacional, a contribuição desigual dos diferentes criadores para a genética da população e a idade avançada dos proprietários.
No que concerne à atividade reprodutiva das fêmeas, um grupo foi seguido durante as estações reprodutiva e não-reprodutiva, por ecografia e medições da progesterona sérica durante dois anos. Foram regularmente monitorizadas as variações na condição corporal para estimar os seus eventuais efeitos na atividade ovárica, com um estudo comparativo de diferentes métodos de avaliação da condição corporal. Esta foi avaliada por métodos de observação visual com palpação e por mensuração da espessura da gordura subcutânea e da
- x -
profundidade dos tecidos subcutâneos da parede torácica, com recurso à ecografia. Encontrou-se uma correlação significativa entre a condição corporal e todas as medições ecográficas. As medições ecográficas de profundidade dos tecidos subcutâneos têm uma relação logarítmica com a avaliação da condição corporal tradicional. A ecografia combinada com a análise de imagem permite uma medição fidedigna da profundidade dos tecidos e gordura subcutâneos para a monitorização das reservas de gordura nas burras.
Na estação reprodutiva, o intervalo inter-ovulatório foi de 23,8 ± 0,551 dias; o diestro e o estro apresentaram uma duração de 17,9 ± 0,462 e 6,65 ± 0,298 dias, respetivamente. Durante este período a duração dos intervalos inter-ovulatórios foi influenciada pela idade e condição corporal; esta última influenciou ainda a duração do diestro e o tempo em cio após ovulação. A incidência de ovulações simples, duplas ou triplas foi de 57,58%, 36,36% e 6,06%, respetivamente. As ovulações múltiplas aumentaram a duração do intervalo entre o início do estro e a última ovulação do ciclo, mas não interferiram com a duração das outras fases do ciclo. Quando combinada com a idade, uma condição corporal mais elevada afetou igualmente a taxa de ovulação. A divergência do folículo dominante ocorreu cerca 8,7 antes da ovulação, independentemente da taxa de ovulação. O folículo dominante era maior à divergência em ovulações simples do que em ovulações múltiplas (19,18 ± 0,968 mm vs. 18,05 ± 1,16 mm). De igual modo, o tamanho folicular máximo antes da ovulação era maior nas ovulações múltiplas que nas simples (40,2 ± 1,41 mm vs. 37,2 ± 0,825 mm). A taxa de crescimento dos folículos dominantes foi independente da taxa de ovulação, tanto no período antes do cio como após o seu início.
Para o estudo dos padrões reprodutivos na estação não-reprodutiva, as fêmeas foram seguidas de setembro a maio. Verificou-se que 75% (9/12) destas fêmeas apresentaram alterações do padrão normal de atividade ovárica durante este período. A perda da ciclicidade normal apresentou-se como anestro (41,7%), estro silencioso com ovulação (25%) ou persistência do corpo lúteo (8,3%). Somente 25% (3/12) das fêmeas mantiveram ciclicidade regular. Este estudo revelou ainda que a interrupção dos ciclos ováricos pode ser desencadeada se a condição corporal descer abaixo de um determinado limiar entre o equinócio do outono e o solstício de inverno, sugerindo que a condição corporal modula as influências sazonais da ciclicidade ovárica em burras.
Palavras-chave: Asininos, Análise de Viabilidade de População, Genealogia, Reprodução,
Para os meus pais Para os meus filhos Para a Lina
“Crescemos sacrificando o que somos hoje pelo que podemos ser amanhã” Anónimo
Agradecimentos / Acknowledgments
Começo por agradecer à Universidade de Trás-os-Montes, na pessoa do seu Magnifico Reitor, a cedência dos meios que me permitiram realizar este trabalho, assim como ao Departamento de Zootecnia por ter acolhido os animais e os ter mantido durante o estudo.
O meu principal agradecimento vai para a Professora Doutora Rita Payan Carreira pela dedicação que colocou neste trabalho e pela preciosa orientação.
Ao Professor Doutor Severiano Silva agradeço, além da sua simpatia, toda a disponibilidade, assim como a oportunidade de colaboração que permitiu diversificar, estender e enriquecer os horizontes deste trabalho.
Ao Professor Doutor Jorge Colaço pela inestimável ajuda com estatística e com sábios conselhos na investigação.
À Professora Doutora Ângela Martins, pela sua valiosa colaboração na elaboração dos capítulos dedicados à análise demográfica. A sua simpatia e disponibilidade foram um incentivo enorme.
Ao Professor Doutor João Brandão, pela amizade, pela partilha de ideias e pelo entusiasmo contagiante no nosso esforço de investigação em torno dos asininos.
Ao Dr. Celso Santos pelo auxílio laboratorial na medição da progesterona.
Ao Professor Doutor Luis Ferreira pela preciosa e desinteressada ajuda na elaboração das figuras.
À Cristina por todo o carinho e ajuda no meu trabalho prático na UTAD e em Miranda. Sem a tua ajuda não sei se o teria feito. Este trabalho é também teu.
Ao Dr. Miguel Nóvoa da AEPGA, pela inestimável ajuda com os animais, proprietários e com os dados do Livro Genealógico.
À Associação para o Estudo e Proteção do Gado Asinino (AEPGA), pela colaboração na realização do trabalho de campo e pelas fêmeas cedidas para o estudo.
À Drª. Sara Mora, Drª Raquel Paiva, Dr. Jesus Buil Garcia e Drª Tamara pela ajuda de campo na “nossa” Miranda do Douro.
- xiv -
À Claudia Costa, à Joana Braga, ao Manuel Campião, ao Nuno Martins, à Teresa Nóvoa, à Ana Ramalho pela ajuda no campo em Miranda e por partilharem comigo o amor a estes animais.
A todos os alunos do MIMV que me ajudaram nas ecografias e tratamento das burras, com uma palavra especial para a Ana Margarida, o Rafael Correia, a Catarina Pereira e outros, que me ajudaram nas ecografias e tratamento das burras, nas noites gélidas e dias de calor infernal de Vila Real. Uma palavra especial ainda para a minha amiga Sara Ramalheira Martins pelo Template da dissertação, e, principalmente, por cada um dos seus sorrisos.
A todos os colegas da Área Hospitalar de Animais de Produção e Equinos do Hospital Veterinário que partilharam comigo estes anos de duro trabalho profissional, com uma palavra especial, que os outros perdoaram porque sabem também o que sinto por eles, à minha querida amiga Joana Elias e ao Alexandre Triguinho.
Ao pessoal do CEGA que prestou uma necessária ajuda nos cuidados das burras, com um agradecimento especial para o Eng. Paulo Fontes.
A todos os Amigos que fizeram parte da jornada até agora e que tenho a certeza que continuarão a fazer.
A todos e a cada um dos criadores e proprietários de burros, o meu mais profundo agradecimento, não só pela disponibilidade sempre presente que me permitiu observar um tão grande número de animais durante o trabalho de campo, mas principalmente porque são eles os principais responsáveis pela preservação de um património tão único. Obrigado pela forma como sempre me receberam em cada casa e em cada aldeia, obrigado por cada história partilhada, razões que fazem com que cada dia no Planalto valha a pena.
Ao meu pai por ser o meu herói e o ombro que eu sempre sei estar ali.
À minha mãe, pela força que me dá e pelo que tenho dela.
À minha querida irmã por ser uma das luzes e exemplo da minha vida.
Para os meus filhos, meus heróis e meu orgulho.
Para toda a minha família, um agradecimento tão especial, por me terem sempre apoiado tanto em todas as minhas decisões e em todos os meus sonhos.
Para a Lina, por tudo o que somos há mais de 20 anos. Uma caminhada em que ela sempre esteve para mim.
Uma palavra especial e saudosa ao meu avô José Inácio Quaresma, um homem superior com uma vida que me serve de exemplo nos princípios e valores da vida e à minha querida avó Ana, uma heroína que criou sozinha 9 filhos e que permitiu também a cada um deles e dos seus netos serem o que são hoje.
Index of figures
Figure 1. Neighbour-joining tree for seven Iberian donkey breeds, based on nucleotide
divergence between populations (Adapted from Aranguran-Mendez et al., 2004). ______ 6
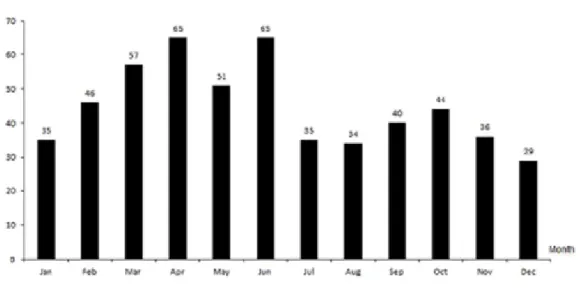
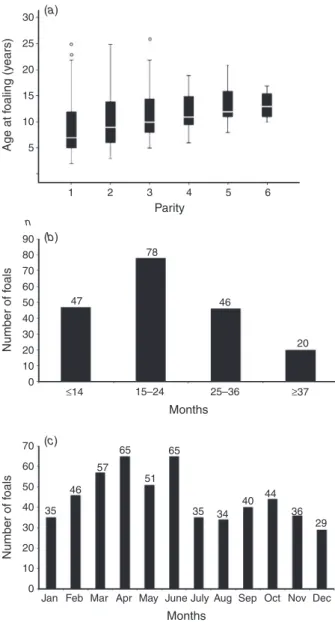
Figure 2. Total of Asinina de Miranda foals born each month during a ten years period,
Contents
1. Background _____________________________________________________ 1
1.1. The Donkey ____________________________________________________ 3 1.1.1. The origin of the donkey species ___________________________________ 3 1.1.2. Donkeys situation worldwide ______________________________________ 4 1.1.3. The Asinina de Miranda breed and donkeys situation in Portugal __________ 5 1.2. Demographic analysis ____________________________________________ 7 1.2.1 Population viability analysis _______________________________________ 9 1.2.2 Pedigree analysis _______________________________________________ 10 1.3. The reproductive physiology of female donkeys _______________________ 11 1.3.1. Donkey sexual behaviour _______________________________________ 16 1.3.2. Reproductive efficiency in equids _________________________________ 17 1.3.3. Body Condition Score __________________________________________ 18
2. Aims of the thesis ________________________________________________ 21 3. Material and Methods ____________________________________________ 25
3.1. Demographic analysis (paper I-II) __________________________________ 27 3.2. Animals, Handling and Housing (papers III-V) _______________________ 28 3.3. Assessment of BCS (paper III) ____________________________________ 29 3.4. Characterization of the reproductive activity (papers IV and V) __________ 29 3.4.1. Serum progesterone determination ________________________________ 30 3.4.2. Ultrasound survey of the ovarian pattern ___________________________ 30 3.4.3. Descriptors definition __________________________________________ 31 3.5. Statistical analysis in non-population studies (papers III-V) _____________ 32
4. Main results ____________________________________________________ 35
4.1. Demographic analysis (papers I-II) _________________________________ 37 4.1.2. Population viability analyses (paper I) ______________________________ 38 4.1.2. Pedigree analysis (paper II) _______________________________________ 39 4.2. Establishment of a sensitive method for BCS analysis (paper III) _________ 40 4.3. Characterization of the ovarian pattern in the breeding season (paper IV) ___ 40 4.4. Characterization of the ovarian pattern in the non-breeding season (paper V) 42
5. General discussion _______________________________________________ 43 6. Main conclusions _______________________________________________ 51
- xviii -
7. Future research _________________________________________________ 57 8. References _____________________________________________________ 61 Appendices
Appendices
Papers I-V
The present thesis is based on the following papers, which will be referred to in the text by their Roman numerals:
I. Quaresma M, Martins, AMF, Rodrigues JB, Colaço J, Payan-Carreira R (2014) Viability analyses of a donkey breed endangered of extinction: the case of the Asinina
de Miranda (Equus asinus). Animal Production Science,
http://dx.doi.org/10.1071/AN13307.
II. Quaresma M., Martins AMF, Rodrigues JB, Colaço J, Payan-Carreira R (2013) Pedigree and herd characterization of a donkey breed vulnerable to extinction. Animal
8, 354-359.
III. Quaresma M, Payan-Carreira R, Silva S. (2013) Relationship between ultrasound measurements of body fat reserves and body condition score in female donkeys. The Veterinary Journal 197, 329-334.
IV. Quaresma M, Payan-Carreira R (2015). Characterization of the estrous cycle of Asinina de Miranda jennies (Equus asinus). Theriogenology 83, 616-624.
V. Quaresma M.; Payan-Carreira, R; Silva, S. (2013). Effects of body condition on ovarian activity patterns in the winter season in Asinina de Miranda donkeys
(Submitted).
Papers I to III are reproduced under the Publishers´ policies for copyright and self-archiving.
Other works have been produced during my PhD studies, either in the forms of full paper, short communications or communications in scientific events. They might be used in the thesis, during the introduction or the discussion of results, but were only listed in my Curriculum vitae.
Abbreviations
%TF Percentage of males from outside the farm
AEPGA Associação para o Estudo e Proteção do Gado Asinino AGE Average age of parents at all offspring birth
ANOVA Analysis of variance
BCS Body condition score
BW Body weight
CV Coefficient of variation
DR Dispersal regions
FAO Food and Agriculture Organization of the United Nations
FCT Portuguese Science and Technology Foundation
FSH Follicle-stimulating hormone
GCI Genetic conservation index
HR Home region
INE Instituto Nacional de Estatística
INT Average age of breeder parents at descendants’ birth
LH Luteinizing hormone
MHz MegaHertz
mtDNA Mitochondrial deoxyribonucleic acid
No. Number
NH Number of herds
OFIC Ovulation fossa inclusion cyst
P4 Progesterone
PVA Population viability analysis
R Pairwise correlation coefficient
r2 Determination coefficient
RAM Asinina de Miranda breed
rsd Residual standard deviation
RTU Real time ultrasonography
SD Standard deviation
SE Standard error
SEM Standard error of the mean
- xxiv -
SFR Subcutaneous fat at rump
SFW Subcutaneous fat at withers
SFT Subcutaneous fat at tail head
SFTh Subcutaneous fat at thorax
TD Thoracic wall tissue depth
TDBrib6 Thoracic wall tissue depth between the 6th and 7th ribs TDBrib13 Thoracic wall tissue depth between the 12th and 13th ribs TDOrib6 Thoracic wall tissue depth over the 6th rib
TDOrib13 Thoracic wall tissue depth over the 13th rib
UTF Use of bought stallions
Background
1. Background
1.1. The Donkey
1.1.2. The origin of the donkey species
The close symbiotic relationship of Homo sapiens and domestic animals over millennia is changing. Accompanied by domestic animals, mankind thrived worldwide over the last 12 000 years, increasing domestic animal biodiversity via adaptation to many environmental challenges, resulting in about 6 000 breeds within only a small number of species. However, during the last 50 years of the 20th century, about one fifth of these livestock breeds have become extinct. This lost in diversity is sometimes presented as a choice of no deep consequence, even though we are in the process of losing valuable genetic resources and our historic heritage (Hodges, 2006). The domestic donkey (Equus asinus) is one of the two domestic species of the genus Equus, along with the horse (Equus caballus). According to mtDNA analysis, differences between the donkey and the horse suggest that the evolutionary separation of the two species occurred 9 million years ago (Xu et al., 1996), distinctly earlier than the 3 to 5 million years that paleontological data pointed before (Lindsay et al., 1980).
Domestication of the donkey might have responded to the needs of pastoralists and other societies in the North-eastern region of Africa due to the desertification of the Sahara (Beja-Pereira et al., 2004). The domestication of the donkey marked a major cultural shift, allowing extensive movement and trade to the early sedentary societies, transforming ancient transport systems in Africa and Eurasia (Clutton-Brock, 1999). The donkeys’ ability to carry heavy loads trough arid lands enabled pastoralists to move farther and more frequently (Rossel et al., 2008).
Archaeological evidences suggest that donkeys were domesticated around 6 000 years ago, in a non-linear and prolonged process with multiple locations (Beja-Pereira et al., 2004; Rossel et al., 2008, Kimura et al., 2011). It is now widely accepted that the wild origins of the domestic donkeys were the African wild asses, the Equus africanus africanus (Nubian wild ass) and the Equus africanus somaliensis (Somali wild ass) (Epstein, 1984; Camac, 1989). These subspecies were estimated to have diverged 0.303 to 0.910 million years ago into two wild populations geographically separated (Beja-Pereira et al., 2004). Asiatic wild asses were excluded as ancestors of the domestic donkey by genetic testing (Lei et al., 2007), despite the earlier proposed theory for a Near-East domestication of donkeys (Clutton –Brock, 1999).
Miguel Nuno Pinheiro Quaresma
- 4 -
Genetic studies of modern donkeys worldwide showed the existence of two distinct mitochondrial halogroups, termed Clades 1 and 2, that are distinct in the two recognised ancestor lines: Nubian wild asses present Clade 1 halogroup, while Clade 2 halogroup, initially attributed to the Somali wild ass, remains nowadays of unascertained origin (Kimura et al., 2011).
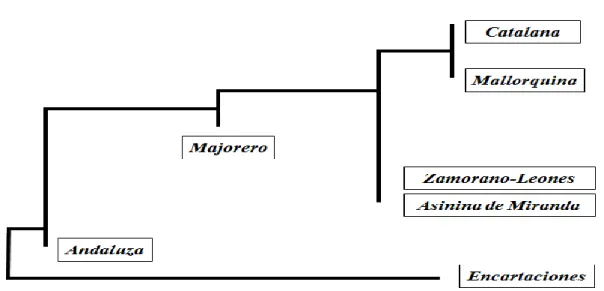
The Nubian ass (Equus asinus africanus) is at the origin of the North African breeds, as well as of the Andaluza (from South of the Iberian Peninsula) and Majorera (from the Canary Islands) breeds, both of grey-brown coat (García Dory et al., 1990; Yanes, 1999; Jordana and Avellanet, 2002). On the other side, the Somalian ass (Equus africanus somaliensis) have been proposed to originate the Southwest Asia donkeys and probably also the majority of European breeds, including the Catalonian, Mallorquina, Encartaciones and Zamorano-Leones, the four black coated breeds from north of the Iberian Peninsula (Epstein, 1984; Aranguren-Mendez et al., 2001, 2002, 2004).
1.1.2. Donkeys situation worldwide
Among the domestic animals, the donkey still plays an important role in the development of human society (Chen et al., 2010). In 1996, there was an estimated donkey population of 44 million animals worldwide, most of them maintained for work. In 2007, FAO reported a decrease of this number to 41 millions. However, not all countries maintain accurate estimates of donkey populations, because donkey ownership is seldom registered. The decline in the Southern Europe donkey population, namely in Mediterranean region, was more pronounced than in other regions of the world. This issued from the development of modern, highly mechanized agriculture practises that reduced the donkeys’ importance for work. Although donkeys can be milked, this is not common; also, only few countries prize donkeys’ meat. Consequently, food-based donkey products are of limited interest and, in most industrialized countries, donkeys are kept specifically for recreation, breeding, showing or companionship. Some farmers keep donkeys for guarding sheep (Starkey and Starkey, 1996).
Donkeys may be found in almost all world regions but, as other lower numbered species, present a less uniform distribution pattern compared to cattle, sheep or chickens (FAO, 2013). Donkey populations have declined dramatically in most industrialized countries of Europe (Ivankovic et al., 2002; Barbosa, 2003) and North America (Starkey and Starkey, 1996) prompting the assumption that donkey populations will also decline rapidly in the emerging
Background
industrialized nations, following its rapid urbanization; yet, such countries also have large rural populations of low incomes, which may continue to benefit from donkeys for local transport (Fielding, 1991; Starkey and Starkey, 1996; Lei et al., 2007; Zhang et al., 2010). Animal traction is increasing in importance in parts of Africa; thereby the species decline in draught is far from universal. Donkeys continue to serve as pack animals even in parts of Europe and the Caucasus. Moreover, grazing donkeys can play a role in landscape management and fire prevention (FAO, 2007). Even in countries where they have a major economic importance to the large rural population, like Mexico, the donkeys have traditionally been ignored (Lopez-Lopez et al., 2005). There is a justification to contribute to an objective assessment of the donkey as a low cost effective source of renewable power. One aspect of this assessment will, of necessity, include the need to have a more complete knowledge of the reproductive characteristics of the donkey, particularly of the female (Fielding, 1988).
1.1.3. The Asinina de Miranda breed and donkeys situation in Portugal
In Europe, asinine populations went from 3 million in 1944 to less than 1 million in 1994. As a consequence, many autochthonous donkey breeds face extinction (Starkey and Starkey, 1996). Although in 1925 there were accounted 243 702 donkeys in Portugal (Sttau-Monteiro, 1933), its number decreased to less than 15 000 in 2009 (INE, 2011). Conversely, with the evolution of the rural Portuguese agriculture and socio-economic conditions, donkeys re-assume a new, renewed utility (Barbosa et al., 2003). Socio-economic reasons preserved the Asinina de Miranda breed in the Northeast Portugal; some of the agricultural work in this mountain region can only be done with the help of these animals (Barbosa et al., 2003).
The Asinina de Miranda donkey type was first recognised by Samões (2000), who characterized the population of donkeys on the Douro International Natural Park. In 2002, the breed was officially recognized by the national authorities that created the breed Studbook, to be maintained by the Associação para o Estudo e Proteção do Gado Asinino (AEPGA), in Miranda do Douro (Quaresma et al., 2005). Considering the studies by Aranguren-Mendez et al. (2001, 2002 and 2004), and the close phenotypic and geographic relation between the Portuguese Asinina de Miranda and the Spanish Zamorano-Leonês breeds, the neighbour joining tree for the Iberian donkey breeds would place the Asinina da Miranda as described on Figure 1.
Miguel Nuno Pinheiro Quaresma
- 6 -
Figure 1. Neighbour-joining tree for seven Iberian donkey breeds, based on nucleotide divergence between
populations (Adapted from Aranguran-Mendez et al., 2004).
In 2003, a preservation plan was initiated for the Asinina de Miranda, analogous to the one done for the Catalonian breed (Jordana and Folch, 1998), with different measures occurring simultaneously: 1) general description of the population; 2) census and individual registry of the animals; 3) morphologic and genetic characterization of the animals, with pedigree analysis; 4) health and welfare characterization of the population; 5) in situ conservation program, incrementing the population size, maximizing the influence of all founders, keeping the maximum genetic diversity. Several steps had commenced then, such as the points 2, 3, 4 and 5; others have been postponed in time. Some recent studies provided the necessary scientific support to this proposal (Barros, 2013; Couto, 2013; Quaresma et al., 2013b; Rodrigues, 2013) and tried to address more specific topics.
For a breed recovery and maintenance, a high reproductive efficiency must be attained. When the breed is endangered, the production of more individuals is needed and, after recovery, the equilibrium between produced and harvested animals is necessary to maintain a viable population. This efficiency depends on genetic factors, as inbreeding depression and the species or breed limitations for offspring production (Al-Atiyat, 2009; Colli et al., 2012). It is also dependent of natural factors as the dual effect of body condition score and nutrition or seasonality (Ferreira-Dias et al., 2005; Aurich, 2011). At last, the success of any breed is highly dependent on its capacity to make the stockholders produce and maintain the animals
Background
for economic or cultural reasons (Gandini and Villa, 2003; Reist-Marti et al., 2006; Hoffmann, 2010; Colli et al., 2012).
1.2. Demographic analysis
In order to secure population viability, management strategies must be sensitive to local ecological, social and economic conditions. Understanding the basic population dynamics is fundamental to a successful conservation program (Armbruster and Lande, 1993; Duchev and Groeneveld, 2006). Also, to create an effective conservation program there is the need to know where a breed stands in terms of population viability and genetic diversity, which success strongly depends on the regular evaluation of parameters characterizing the target population (FAO, 2007). This allows a better access to the critical level of endangerment of a breed, being useful to evaluate the success of carried out conservation strategies and to suggest new ones to be implemented in the future (Pinheiro et al., 2013).
One of the first stages of any conservation program is the evaluation of genetic diversity within a breed (Ciampolini et al., 2007), since long term survival of a population depends on the maintenance of sufficient genetic variation for individual fitness, population adaptability and fertility (Falconer, 1989; Meuwissen and Woolliams, 1994; Lacy et al., 1995; Falconer and Mackay, 1996; Fernandez et al., 2000; Valera et al., 2000; Frankham et al., 2004). Breeds that suffered substantial decline in population size may present high levels of inbreeding, resulting in inbreeding depression and aggravated risk of extinction, since the loss of heterozygosity is usually inversely proportional to population size (Ghafouri-Kesbi, 2010).
Development of selection and mating criteria for controlling inbreeding are based on relationships obtained from pedigrees, on the principle of reducing the average coancestry among selected individuals for mating (Fernandez et al., 2000). In a small population as the Asinina de Miranda it will be hard to maintain a long time mating process using only unrelated animals in mating decisions. To minimize the negative impact of an increase of overall inbreeding, reduction of effective population size and, consequently, loss of genetic variability, a mating policy must be implemented pursuing the equal contribution of the maximum number of animals from both genders to the next generation (Falconer and MacKay, 1996; Folch and Jordana, 1998).
Miguel Nuno Pinheiro Quaresma
- 8 -
Inbreeding depression is a major concern in populations that are small, isolated or have low intrinsic population growth rate (Allendorf and Ryman, 2002); it corresponds to a reduction of a population genetic fitness as a consequence of crossing closely related individuals. To avoid inbreeding depression and foster sufficient genetic diversity for adaptive change to occur, it is necessary a minimum number of animals. The effective number may vary with the author, and have to be adapted to each situation. Waples (2002) defend an effective population size (Ne) of at least 100 individuals to census population sizes of about 500 to 1000 animals, while Lande (1988) suggest that an effective population size of 550 individuals is necessary to maintain the typical levels of genetic variability for quantitative traits in a population. Rasch and Herrendorfer (1990; in FAO, 1992) recommended a Ne of 200 for maintaining a genetically constant population over 50 generations. Contrasting, Brem et al. (1990; in FAO, 1992) defend that a population is not threatened when the effective population size is over 50, for a minimum of 10 males. Still, for effective selection, a Ne of at least 100 is necessary (FAO, 1992), or as defended by Meuwissen and Woolliams (1994), the critical size for Ne is between 50 and 100.
Within the framework of breed conservation, the combination of genetic diversity and kinship information provides important baseline data for future breed conservation efforts, especially for critically endangered breeds (Gomez et al., 2012). In human managed populations, selection is the main factor responsible for the loss in genetic diversity (Hedrick, 2000; Ghafouri-Kesbi, 2010). Where only a few phenotypically superior animals are allowed to contribute to the gene pool of the next generation, a genetic bottleneck is imposed on the population (Allendorf, 1986). In such situations, breeding management measures are essential to assure that the effective population size does not go under acceptable levels (Foose et al., 1986).
The studies on genetic diversity of donkey breeds using molecular markers showed an underestimation of the inbreeding coefficient by pedigree analysis alone, probably due to the lack of genealogical records. Several studies have been performed on the demographic and genealogical structure of donkey breeds in Spain (Folch and Jordana, 1998; Jordana et al., 1999; Jordana et al., 2001; Aranguren-Mendez et al., 2002; Guttiérez et al., 2005), Italy (Cecchi et al., 2006; Ciampolini et al., 2007), and in other countries of the Mediterranean area (Ivankovic et al., 2002; Vranova et al., 2011).
Background
1.2.1 Population viability analysis
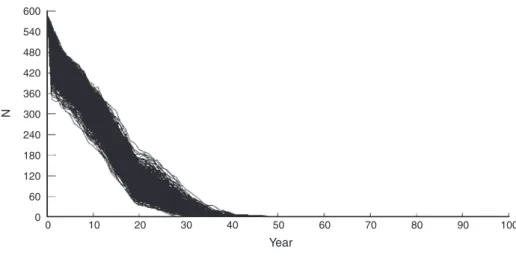
Population viability analysis has become a commonly used tool in endangered populations’ management. However, one must be aware that it should be treated as a model and that models are simplifications of the real world (Reed et al., 2002); therefore, predictions are only probabilistic (Shaffer, 1990). Despite these caveats and limitations, PVA remains an important tool for conservation biologists in effecting positive management actions (Reed et al., 2002). These analyses uses stochastic models with fluctuating population size and varying demographic parameters to predict population size and the probability of persistence for a defined period, under specific conditions (Soulé, 1987). PVA is mostly appropriate for comparing the relative effects of potential management actions on population growth or persistence (Marmontel et al., 1997; Reed et al., 2002). For most endangered species, an extinction risk of less than 5% in 100 years is taken as an acceptable goal for preservation from extinction (Marmontel et al., 1997). A desired population level is one that is unlikely to fall into an extinction process (Lacy, 1993).
There is no single mathematical process that constitutes PVA, but all approaches have in common an assessment of a population’s risk of extinction or its projected growth, either under current conditions or expected from proposed management. Results should be presented to express the range of possible results and the uncertainty associated within this range, rather than as a single value, such as mean time to extinction (Reed et al., 2002). In PVA, the mean is typically larger than the median, so the median time to extinction might be more appropriate for reporting population persistence (Mills et al., 1996).
Sensitivity analysis can complement the predictions that arise from PVA by providing insights into factors that most affect population growth or extinction probability and can also benefit researchers by identifying factors whose estimation is most critical for population-level studies (Reed, 2002). Because the insights provided by sensitivity analysis can change with variations in a population’s carrying capacity (Beissinger and Westphal, 1998; Reed, 2002), a small measured sensitivity does not necessarily mean that a parameter has always such an effect on population growth (Reed et al., 2002). For example, structure, age-specific mortality, and age-age-specific reproduction are usually key factors determining the ability of a population to persist (Marmontel et al., 1997).
Vortex 9.99c is a software program often used for PVA that uses a Monte Carlo simulation of the effects of both deterministic and stochastic events (demographic, environmental and
Miguel Nuno Pinheiro Quaresma
- 10 -
genetic) on populations (Lacy et al., 1993, 2009). Demographic stochasticity includes random variation in demographic parameters, whereas environmental stochasticity refers to variation in the environment external to a population (Simberlof, 1988). Nevertheless, this distinction is somewhat arbitrary: the first affects only very small populations whereas the latter may be significant to larger populations (Goodman, 1987).
1.2.2 Pedigree analysis
The concept of pedigree analysis goes back to the work of Wright and McPhee (1925). Later on, James (1972) described a procedure on how to compute genetic contributions of individuals to later generations from pedigrees. The pedigree analysis allows population managers to assess the genetic structure of a population and to plan appropriate breeding strategies targeting a balance between genetic response and the loss of genetic diversity (Ghafouri-Kesbi, 2010). It is considered a useful tool to describe genetic variability within populations and its evolution across generations (Boichard et al., 1997). Pedigree analysis has been applied to study the genetic variability and population structure in many equine breeds, exploiting the application of different software to analyse genealogical data (Sabbioni et al., 2007).
The theory of population genetics, developed for ideal populations, can be extended to real populations by computing effective population size (Ne), which adjusts the actual number of active breeding animals to a gender ratio of 1:1 (Wright, 1931). The calculation of Ne is considerably sensitive to the quality of pedigree information and accurate estimates of Ne are central to developing suitable conservation strategies, when making the estimation of parameters based on identity-by-descent of genes (Ghafouri-Kesbi, 2010; Gomez et al., 2012). Consequently, another approach can be recommended to assess genetic diversity - the analysis of the probabilities of gene origin, first introduced by Dickson and Lush (1933) and further developed by Lacy (1989). An important advantage of parameters obtained by this approach is to be less sensitive to pedigree completeness in comparison to parameters based on identity-by-descent of genes (Boichard et al., 1997).
The effective number of founders (fe) concept was defined by Lacy (1989), who also
introduced the concept of founder genome equivalents (Lacy, 1989, 1995). Alderson (1991) proposed computing the gene origin probabilities or each potential candidate for breeding with reference to the founders, and then selecting animals with the highest effective number
Background
of founders as a way of equalizing founder contributions. Caballero and Toro (2000, 2002) found that effective population size, effective number of founders and founder genome equivalents are interrelated in terms of coancestry and variance of contributions from ancestors to descendants, and proposed a new parameter - the effective number of non-founder genomes - to describe the relationship between the effective number of non-founders and founder genome equivalents.
Studbooks with accurate records are vital so that information on the genetic size of a population can be obtained by analysing pedigree information. However, the creation and closing of a Studbook can originate bottlenecks on the genetic diversity of a population; that´s why Studbooks should be continuously surveyed to prevent further losses of genetic diversity (Schurink et al., 2012).
Compared to other farm animals, equids present a higher generation interval. Within small populations that primarily target breed conservation; long generation intervals are advantageous in order to minimize the increase of inbreeding per unit of time (Vostry et al., 2011). On the other hand, the time span is longer before an increase in inbreeding rate is detected due to the low numbers of stallions and breeding mares used (Hamann and Distl, 2008; Vostry et al., 2011).
Pedigree analysis for the evaluation of genetic variability and diversity was already done in Portuguese horse breeds as the Sorraia (Luís et al., 2007; Pinheiro et al., 2013), Garrano (Morais et al., 2005) and Lusitano (Vicente et al., 2012), as well as for other European horse breeds (Sabbione et al., 2007; Hamann and Distl, 2012; Schurink et al., 2012; Siderits et al., 2013), but such information for the Asinina de Miranda breed is still lacking.
1.3. The reproductive physiology of female donkeys
Of the two domestics equid species, horses are by far the most studied in terms of the reproductive cycle. It is therefore natural that a lot of the studies in donkey arose by comparison. While many similarities in reproductive physiology exist between donkeys and horses, there are important differences (Blanchard and Taylor, 2005). It is generally accepted that the diestrus is longer in jennies than in mares (Vandeplassche, 1981; Meira et al., 1995; Ginther et al., 1995), while the estrus is similar in length between these species (Vandeplassche, 1981; Henry et al., 1987; Carluccio et al., 2005); consequently, donkeys
Miguel Nuno Pinheiro Quaresma
- 12 -
present longer interestrous intervals (Ginther et al., 1987; Fielding, 1988; Blanchard et al., 1999; Taberner et al., 2008). One of the main reasons endorsing the increased understanding of the jennies estrous cycles is the interest to manipulate the cycle for optimization of fertility (Carluccio et al., 2006).
During the breeding season, in horses, cycle length is about 22 days, with 5–7 days of estrus (Aurich, 2011). The first report on the length of donkey estrous cycle, by Nishikawa and Yamazaki (1949b), describe similar characteristics for standard jennies in Japan: an interestrous interval of 22.8 ± 0.109 days (ranging 13-31 days) with an estrus length of 6.02 ± 0.677 days (ranging 3-14 days). In this first report, the resemblances between donkeys and horses on respect to seasonality, duration of estrus and estrous cycle were also established. Since then, several other studies were performed on different donkey breeds, such as Catalan (Taberner et al., 2008), the Anatolian (Kalender et al., 2012), the Brazilian Pêga (Meira et al., 1995) and Marchador (Conceição et al., 2009), the Mammoth (Blanchard et al., 1999), the Martina Franca (Contri et al., 2014) and the Baudet de Poitou (Trimeche et al., 1995).
Equids are seasonal polyestrous species, presenting the onset of the breeding season in spring, triggered by an increase in daylight, temperature and food availability (Naggy et al., 2000). In horses, seasonal reproductive activity is stimulated by long days and short nights (Palmer and Guillaume, 1992; Fitzgerald and McManus, 2000; Nagy et al., 2000; Ferreira-Dias et al., 2005). In the northern hemisphere, the natural breeding season occurs from April to September in most horses, while in less domesticated horse breeds it may occur between May and October. In the mare, the non-reproductive season can be differentiated into an autumn transitional phase from cyclic activity to anestrus, a mid-anovulatory period at winter and a second transitional phase to cyclic activity in spring (Ginther, 1992; Aurich, 2011). Among riding and racing breeds, about 30% of mares show ovulatory cycles throughout the winter season (Aurich, 2011), while in most other breeds, 85 to 95% of mares cease ovarian cyclicity around the autumn equinox (Ginther, 1992). As in the rest of the northern hemisphere, in Portugal the reproductive season lasts from April to September, although some females start cycling as early as January (Ferreira-Dias et al., 2005; Atayde and Rocha, 2011; Fradinho et al., 2014).
One of the first studies characterizing the reproductive activity in Japanese jennies showed a breeding season lasting from April to September and an anestrus season between December and January, while the transition stages into and from the breeding season occurred from
Background
February to March and from October to November, respectively (Nishikawa and Yamazaki, 1949b). It is generally accepted that the reproductive function is less affected by season in donkeys than in horses (Ginther el al., 1987; Henry et al., 1987; Lemma et al., 2006), though the genetic of the breed may influence seasonal determinism. Mammoth donkeys seem to be less affected by season than the reported in other standard donkeys, displaying estrous cycle and estrus of similar length (respectively, 23.3 ± 2.6 days and 5.9 ± 2.1 days among the four seasons of the year (Blanchard et al., 1999).
The seasonal reproductive pattern results from an endogenous circannual rhythm determined by external environmental factors such as photoperiod and temperature, which are considered as main determinants of seasonality (Fitzgerald and McManus, 2000; Naggy et al., 2000; Aurich, 2011). However, other external cues may also influence the strength exerted by seasonality on the suppression of ovarian activity in the non-breeding season – determining the anestrus depth. Among these factors, age, nutrition and body condition may act as secondary modulator factors for the reproductive activity (Henneke et al., 1983; Fitzgerald and McManus, 2000; Godoi et al., 2002; Gentry et al., 2002; Salazar-Ortiz et al., 2011, Fradinho et al., 2014; Morley et al., 2014). Therefore, in many horse populations a proportion of mares might cycle continuously throughout the year, usually those with high body condition (Waller et al., 2006).
Not all reports agree on the differences in the estrous cycle length or the duration of each cycle stage in mares passing into anestrus (Ginther, 1992; Blanchard et al., 2003; King et al., 1993; Nequin et al., 1990), which may result from year differences, the location of the study, the breed or type, age or nutrition level (Ginther et al., 2004). In the autumn transition, ovulation failure is followed by a phase of variable follicular activity anticipating the reduction in the follicular growth characteristic of deep anestrus. Even in mares that keep cycling year-round, small differences in the length of the estrous stages have been reported during the breeding and the non-breeding seasons. Dowsett et al. (1993) reported the shortening of estrus during winter season, compared to spring or summer, together with the elongation of the estrous cycle, while King et al. (1993) described a non-significant decrease in the luteal stage in mares during winter.
In mares, the follicular growth during winter is usually minimal and corresponds to successive waves of small follicles development, with a diameter of no more than 15 mm. Low circulating concentrations of luteinizing hormone (LH) contribute to the reduction in
Miguel Nuno Pinheiro Quaresma
- 14 -
follicular growth (van Niekerk and van Niekerk, 1997b). However, follicle-stimulating hormone (FSH) surges are maintained and follicular waves can be distinguished throughout the anovulatory season. The spring transitional period is variable in length, ranging from 30 to 90 days. It begins with the resuming of follicular deviation, with development of a dominant follicle reaching a size between 20 mm and 30 mm in diameter. In addition, it also encompasses the development of an increasing number of follicles with a diameter greater than 15 mm. Subsequently, usually one to three anovulatory follicular waves develop before ovulation occurs (Ginther, 1992; Donadeu and Watson, 2007). The length of the anovulatory period varies among mares (Dowsett et al., 1993).
Galisteo and Perez-Marin (2010) identified the photoperiod as the most important factor for synchronizing seasonal reproductive activity in jennies. However, other factors may modify the intensity of the depression over the reproductive activity, alike the coupled effect of nutrition, energy balance and BCS, as reported by Lemma et al. (2006) for jennies in latitudes with small photoperiodic variation.
With regard to pre-ovulatory follicular development and ovulation, equids differ from other farm animal species. The pre-ovulatory follicle is larger and ruptures at a specific region of the ovary – the ovulation fossa. From deviation onwards, that occurs when dominant follicle attains a size around 22.5 mm and 7 days before ovulation (Ginther et al., 2006; Donadeu and Watson, 2007), the pre-ovulatory follicle grows at an average rate of 3 mm per day to a diameter of approximately 35 mm, four days before ovulation. Continued growth occurs up to 2 days before ovulation, when follicular size reaches a plateau at approximately 40 mm (Ginther et al., 2008). Mares ovulate consistently from similar pre-ovulatory diameters in consecutive cycles (Cuervo-Arango and Newcombe, 2008).
Nishikawa and Yamasaki (1949a) reported that the diameter of the largest follicle at the beginning of estrus was 10 to 30 mm in diameter for standard Japanese jennies. Ovulation occurs in jennies at a maximum follicle size of 30 to 45 mm (Nishikawa and Yamasaki, 1949a; Dadarwal et al., 2004), an average of 6.6 days after the estrus onset (Nishikawa and Yamasaki, 1949a). In jennies, estrus average follicular growth rates range from 2.4 and 3.7 mm/day (Ginther, 1992; Dadarwal et al., 2004; Taberner et al., 2008; Conceição et al., 2009), considering different donkey breeds.
In mares, the follicle size at ovulation, as well as the rate of dominant follicle growth, differs according to the ovulation rate, in particular during the 2.5 days prior to ovulation; this results
Background
in a lower preovulatory follicle diameter in double ovulators compared to single ovulators mares (Aurich, 2011). The reduced follicular growth might be related to lower FSH concentrations, most probably due to higher estradiol concentrations from the two preovulatory follicles (Ginther et al., 2008). In mares, multiple ovulations vary between 7% and 25%. Genetic influences on twining are not clear, but incidence of multiple ovulations varies with the breed (Bresinska et al., 2004; Wolc et al., 2005), with larger breeds having a higher incidence than smaller breeds of horses or ponies. In addition, it may also vary with the reproductive status and age, or in consequence to the administration of hCG or its analogues in the schemes of estrous cycle manipulation (Aurich, 2011).
Multiple ovulations are more prevalent in donkeys than in horses. The rate of multiple ovulations in this species varies with the reports, ranging from 5.3% to almost 70% (Nishikawa and Yamasaki, 1949a; Vandeplassche et al., 1981; Henry et al., 1991; Meira et al., 1995; Ginther et al., 1987; Taberner et al., 2008). The incidence of multiple ovulations in a herd of Mammoth jennies was found to be higher (61%) than that reported for other jennies. Moreover, it was found that jennies displaying multiple ovulations tend to repeat it in several estrous cycles (Blanchard et al., 1999; Taberner et al., 2008), suggesting the existence of a genetic influence. Also, Ginther (1992) refers the repeatability of multiple ovulations in individual mares, considering it a heritable trait. So, the higher incidence of multiple ovulations reported in the herd of Mammoth jennies (Blanchard et al., 1999) may reflect the selection of certain family lines. No season effects were detected on the incidence of multiple ovulations in jennies (Ginther et al., 1987) but, in the mare, the prevalence of multiple ovulations is positively affected by the female BCS (Guillaume et al., 2006).
Multiple ovulations may occur in a synchronous event, if ovulations occur at intervals shorter than 24 hours, or asynchronously, if the interval between ovulations lasts for more than 24 hours (Ginther et al., 1987; Taberner et al., 2008; Meira et al., 1995). In jennies, most of the multiple ovulators remain in estrus until after the final ovulation (Ginther et al., 1987; Blanchard et al., 1999), as it was also reported for the mare (Blanchard et al., 2003).
In the mare, circulating concentrations of progesterone immediately increase at the time of ovulation (Roberto da Costa et al., 2005). Maximal concentrations of progesterone are reached on day 8 after ovulation and then slowly decrease until the onset of luteolysis that begins at approximately day 14. Functional luteolysis occurs around day 15 and is initiated by endometrial secretion of prostaglandin F2α (PGF2α)(Aurich, 2011). Also, individual variations
Miguel Nuno Pinheiro Quaresma
- 16 -
are expected either on the onset of progesterone peak and on progesterone values in mares with similar length of estrous cycles (Squires et al., 1974; Satué and Gardon, 2013); such variations were associated with differences in the secretory capacity of the corpus luteum and the hormonal catabolic rate and the existence of multiple ovulations (Satué and Gardon, 2013). In jennies, the progesterone patterns resemble those described in mares. Progesterone levels usually remain below 1ng/ml during estrus, rising rapidly after ovulation to reach peak levels above 10 ng/ml five days after ovulation and dropping sharply two to three days prior to the onset of estrus (Henry et al, 1987 Carluccio et al., 2008; Meira et al., 1995; Contri et al., 2014).
Pregnancy length in jennies is described as quite variable (Fielding; 1988). There are values reported from 353.4 ± 13 days (Crisci et al., 2014) to 355-365 days (Galisteo and Perez-Marin, 2010), longer in average than pregnancy in mares (Ginther, 1992). In jennies, no significant differences were observed between the breeds. Breeding season has a significant effect on gestation length, with longer gestation lengths when jennies were covered during the early period of breeding season. Breed, age of jenny, year of birth, foal gender, month of breeding, and type of gestation do not have a significant effect on gestation length (Galisteo and Perez-Marin, 2010).
1.3.1 Donkey sexual behaviour
Sexual behaviour of donkeys is characterized by a series of attitudes during sexual interactions. Jennies display a variety of estrus behaviors that include: a) mounting; b) herding/chasing other jennies, teasing of other jennies, and Flehmen response; c) mouth clapping; d) winking; e) raising the tail; f) urination; g) posturing (i.e., abducted rear legs, arched tail, tipped pelvis, and lowered perineal area); h) standing to be mounted. Interestingly, in estrus, mouth clapping begins almost one day before onset of other positive signs and lasts almost one day more (Clayton et al., 1981; Vandeplassche, 1981; Henry et al., 1998; McDonnell, 1998). A conspicuous characteristic of donkeys mating is the usually longer time for mating and the fact that jacks will continue to pursue and attempt mounting even if kicked (Clayton et al., 1981; McDonnell, 1998). Several periods of sexual interactions separated by periods of male withdrawal from the female are needed before breeding is achieved. In comparison to mares, jennies play a more active role in the mating process (Vandeplassche, 1981; Henry et al., 1991, Henry et al., 1998). Breeding potential of this species is high;
Background
human interference in the pattern of sexual interaction does not seem to change attitudes displayed during courtship but may alter breeding efficiency of the jacks (Henry et al., 1998).
1.3.2 Reproductive efficiency in equids
The reproductive efficiency is a major determinant of profitable equids breeding and conservation programs, in case of endangered species or breeds. For these programs, the knowledge of the reproductive capability, manifested by the production of viable offspring (Ginther, 1992), and the identification of the main determining effects on the reproductive success is of major importance (Morel et al., 2010). However, one major limitation might be the difficulties in obtaining accurate fertility data (Kuisma et al., 2006).
Compared to other domestic species, horses have been considered as presenting relatively low reproductive efficiency, particularly when under traditional, low technique, breeding systems (Morris e Allen, 2002; Ricketts and Troedsson, 2007). The reproductive efficiency for the species depends on both genomic and non-genomic effects. Among the genomic effects, besides the particularities of the breed, are major determinants of the reproductive success the number of available reproducers and breed inbreeding (already reviewed in this document), as most often fertility is negatively correlated with homozygosity (van Eldik et al., 2006). Breeds with small populations have increased susceptibility to infertility and lower pregnancy rates, thereby presenting decreased reproductive success (Collins et al., 2012). This may be due to compromised reproductive physiology (Collins et al., 2012) or to a decrease in the breed fitness to environmental changes (Sommer, 2005).
From the non-genomic effects, main determining issues are the factors associated with the animal, such as age and parity for females (Carnevale and Ginther, 1992), and the environmental effects, that include the photoperiod, the nutritional status and its reflection on BCS (Aurich, 2011), and the management factors, including managerial arbitrary decisions (Ricketts and Troedsson, 2007). The photoperiod extent may influence the length of the breeding season, the differences being more pronounced between animals living near the poles and those in living tropical areas. The longer the length of the breeding season, higher will be the season pregnancy or the foaling rates (Osborne, 1975; Satué and Gardon, 2013). For animals living in temperate regions, nutrition and the energetic metabolism may be the major drive force in the regularity of the yearly oestrous cycles (Fitzgerald and McManus, 2000).
Miguel Nuno Pinheiro Quaresma
- 18 - 1.3.3. Body Condition Score (BCS)
Inadequate nutrition and reduced body fat are associated with impaired reproductive efficiency in mares (Henneke et al., 1983, 1984; Hines et al., 1987; Waller et al., 2006). It is commonly accepted that most mares with high BCS (7.5 to 8.5) continue to cycle throughout the non-breeding season. On the other side, low BCS in mares were associated with a consistent seasonal anovulatory state.
Although low BCS and leptin concentrations were associated with inactive ovaries during winter and early spring, mares with low BCS eventually ovulated in April and May while leptin concentrations remained low (Gentry et al., 2002b), suggesting that although important modulators, BCS or the serum metabolites are not major determinants of regular ovarian activity during a positive photoperiod. Fitzgerald and MacManus (2003) reported an increase in the length of diestrus and interovulatory interval in fat mares (BCS ≥ 7) under controlled management compared to mares in moderate BCS. In free ranging tropical jennies, variations in BCS can also affect the ovarian activity (Lemma et al., 2006).
Both obesity and emaciation are, paradoxically, common problems in donkeys, the first in rich (Pearson and Ouassat, 2000) and the second in poor countries (Pritchard et al., 2005). Good management involves ensuring that animals eat the daily requirements for maintenance and satisfaction of the work and production needs (Eley and French, 1994; Pearson and Ouassat, 2000; Vall et al., 2003), but overfeeding and obesity are risky. Hyperlipaemia is a severe condition that can affect overweight donkeys. It has a high mortality rate and several predisposing factors are recognized in donkey breeds, such as obesity, female gender, pregnancy, lactation, older age, intercurrent disease and anorexia (Reid and Mohammed, 1996; Durham, 2006).
The body condition score has often been used as an index of nutritive status of livestock (Russel et al., 1969; Lowman et al., 1976; Edmonson et al., 1989; Santucci et al., 1991; Frutos et al., 2012). In horses and donkeys it uses visual appraisal and palpation of some anatomical landmarks (Henneke et al., 1983; Pearson and Ouassat, 2000; Vall et al., 2003; Carter et al., 2009), but these methods are affected by a certain level of subjectivity (Vecchi et al., 2010), and small BCS changes cannot be realistically detected even by trained observers (Ferguson, 1996; Mottet et al., 2009). Although there are reports of BCS systems in donkeys (Pearson and Ouassat, 2000; Vall et al., 2003), more accurate methods have never been tested. BCS must be considered a subjective technique to a certain degree (Ferguson, 1996; Mottet et al.,
Background
2009; Vecchi et al., 2010; Frutos et al., 2012). On the other side, Real Time Ultrasound (RTU) can be used in the field to routinely predict body fat reserves with a higher degree of accuracy (Schröder and Staufenbiel, 2006; Dugdale et al., 2010), giving even better results if used in conjunction with BCS traditional assessment (Dugdale et al., 2011a). RTU measurements has been proved to be accurate in predicting body fat in different species (Westervelt et al., 1976; Gee et al., 2003; Silva and Cadavez, 2012), but not all points for the collection of images equally reflect body fat reserve changes (Gentry et al., 2004; Argo et al., 2012).
Aims of the thesis
2. Aims of the Thesis
Limited knowledge exists on donkey reproductive activity, in particular on that of the Asinina de Miranda breed. The identification of the most important internal and external factors modulating their reproductive traits is vital, when designing a breeding program. Moreover, previous work (Quaresma et al., 20111) suggested that some of the detected reproductive abnormalities might have a genetic background, possibly associated to increased consanguinity or to a high ovulation rate per cycle. Thus, the overall aims of this thesis were to assess and characterise the reproductive activity in Asinina de Miranda jennies and to identify the most important factors limiting the reproductive efficiency in this breed.
Taking into consideration the perception that the Asinina de Miranda breed was endangered of extinction, and that endogamy is often present in such populations and might be a strong determinant of the breed fertility, studies on the breed demography and on its reproductive function were envisaged. The acquisition of evidence-based scientific knowledge on the breed demography and female reproduction is of paramount importance on the recovery and maintenance of the Asinina de Miranda breed. It also may be useful supporting recovery programs of other breeds in similar conditions.
Specific aims for the present thesis were:
To determine the putative influences of several genetic factors on the Asinina de Miranda reproduction, in particular:
- To estimate the viability of the Asinina de Miranda breed on the present scenario, identifying the variables that are determinant to the breed conservation and suggest new management strategies, if perceived as needed;
- To analyse some fertility traits (such as foal rate, neonatal survival, conception rates, twin index, foaling intervals), age pyramid and mortality rates in Asinina de Miranda population;
- To analyse the pedigree records and typify some of the socioeconomic features of herds and owners of the Asinina de Miranda breed, identifying the environmental and management factors that may affect the breed genetic variability in the future;
1 Quaresma M, Payan-Carreira R, Pires MA, Edwards JF. 2011. Bilateral ovulation fossa inclusion cysts in Miranda jennets. J Comp Pathol. Nov;145(4):367-72