20th
APDR
Congress
|
ISBN
978
‐989
‐8780
‐01
‐0
1082
Bender, K.A., Donohuet, S.M., Heywood, J.S. (2005), “Job Satisfaction and Gender Segregation”, Oxford Economic Paper, (57), pp. 479‐ 496 Berg, I. (1973), “Education and Jobs. The Great Training Robbery”, Middlesex: Penguin Education, Penguin Books Clark, A.E., Oswald, A.J. (1996), “Satisfaction and Comparion Income”, Journal of Public Economics, 61, pp. 359‐381 Comunicación al Consejo, al Parlamento Europeo, al Comité Económico y Social y al Comité de las Regiones, “Políticas sociales y de empleo. Un marco para invertir en la calidad”, COM/2001/0313 final */ Davis, K., Newstrom, J.W. (1991), “Comportamiento Humano en el Trabajo: Comportamiento organizacional”, McGraw‐Hill, México Doeringer, P., Piiore, M. (1972), “ Internal Market and Manpower Analysis”, Lexington, MA: Health Lexington BooksFabra, M.E., Camisón, C. (2008), “Ajuste entre el Capital Humano del Trabajador y su Puesto de Trabajo como Determinante de la Satisfacción Laboral”, Revista del Ministerio de trabajo e inmigración, (76), pp. 129‐142 Freeman, R. (1978), “Job Satisfaction as an Economic Variable”, American Economic Association, Papers and Proceedings, 68, pp. 135‐ 141 Gamboa, J.P, Gracia, F.J., Ripoll, P., Peiró, J.M. (2007), “La Empleabilidad y la Iniciativa Personal como Antecedentes de la Satisfacción Laboral”, Instituto Valenciano de Investigaciones Económicas, (1), pp.1‐26 Gamero, C. (2007), “Satisfacción Laboral y Tipo de Contrato en España”, Investigaciones económicas, 21(3), pp. 415‐444
Green, F., Zhu, Y. (2010), “Overqualification, Job Dissatisfaction and Increasing Dispersion in the Returns to Graduate Education”, Oxford Economics Papers, pp.1‐33
Herzberg, F, Mausner, B, Snyderman, B (1959), “The Motivation to Work”, New York: Wiley
Hamermesh, D (1977), “Economics Aspects of Job Satisfaction” en O.C. Ashenfelter y W.E. Oates (eds.), Essays in Labor Market Analisys, New York: John Wiley
Hartog, J., Oosterbeek, H (1988), “Health, Wealth and Happines. Why Pursue a Higher Education?”, Economics and of Education Review, 17 ( 3)
ISTAS (2010), “Manual del Método CoPsoQ‐istas21 (versión 1.5) para la Evaluación y Prevención de los Riesgos Psicosociales”, Instituto Sindical de Trabajo, Ambiente y Salud. Barcelona
Knill, C. (2001), “The Europeanisation of National Administrations. Patterns of Institutional Change and Persistence”, Cambribge University Press
Lassibille, G., Navarro, M.L. (2012), “Un Compendio de Investigaciones en Economía de la Educación”, Presupuesto y gasto público, (67), pp. 9‐28
Ley del Estatuto básico del Empleado Público, 7/2007, de 12 de abril, Boletín Oficial del Estado, de 13 de abril de 2007, no. 89, pp.16270, España
Mayo, E (1933), “The Human Problems of an Industrial Civilization”, New York: Macmillan Maslow, A.H. (1954), “Motivation and Personality”, New York: Harper and Row
Mincer, J. (1974), “Schooling, Experience and Earning”, National Bureau of Economics Research, Nueva York
Murray, R (2000), “Human Resources Mangement in Swedish Central Government”, en Farnham D y Horton, S (comps.), “Human Resources flexibilities in the Public Services”, Macmillan Business
Quintás, J. R., Sanmartín, J. (1978), “Aspectos Económicos de la Educación: Comparaciones Internacionales”, Información Comercial Española, 537 (Mayo), pp. 37‐47
Revuelto, L., Fernández, R. (2003), “Relación de las Características Demográficas y las Percepciones del Clima Laboral con la Satisfacción en el Trabajo de los Empleados Públicos”, Arxius de Ciencias Sociales, (8), pp. 133‐161 Riboud, M., Hernandez, F. (1983), “Inversiones en Capital Humano de los Hombres y Equilibrio en el mercado de trabajo”, Formación y Utilización de Recursos Humanos en Andalucía, Instituto de Desarrollo Regional, Sevilla Rousseau, D.M. (1995), “Psychological Contract in Organizations: Understanding Written and Unwritten Agreements”, Thousand Oaks, CA: Sage Rumberger, R. (1981), “Overeducation in the US”, Labor Market, New York: Praeger
Sánchez, J.L. (2001), “Desajuste Educativo: Existencia, Medición e Implicaciones en la Industria Hostelera de Andalucía”, Tesis Doctoral, Universidad de Málaga
Schultz, T. W. (1961a), “Investment in Human Capital”, American Economic Review, 51, pp. 1‐17
Sicherman, N., Galor,O. (1990), “ A Theory of Career Mobility”, Journal of Political Economy, 98(1), pp. 169‐192
Souza‐Poza, A, Souza‐Poza, A.A. (2000b), “Well‐being at Work: A Cross‐national analysis of the level and determinants of job satisfaction”, Journal of Socio‐Economics, 28, pp. 517‐538
Spence, M. (1973), “Job Market Signaling”, Quaterly Journal of Economics, 87, pp. 355‐374 Taylor, F.W. (1991): “Principles of Scientific Management”, Nex Yor: Harper & Row
Thurow, L. C. (1975), “Generating Inequality: Mechanisms of Distribution in the U.S. Economy”, Basic Books, New York
Traut, C.A., Larsern, R, (2000), “Hanging On or Fading Out? Job Satisfaction and the Long‐Term Worker”, Public Personnel Management, 29 (3), pp. 343‐351
Tsang, M.C., Levin, H.M. (1985), “The Economics of Overeducation”, Economics of Education Review, 4 (82)
Van del Krogt, T., Beersen, E., Kemper, A. (2000), “The Netherlands: towards personnel flexibilities”, en Farnham D y Horton, S (comps.), “Human Resources flexibilities in the Public Services”, Macmillan Business Verdugo, R. y Verdugo, N, “The Impact of Surplus Schooling on Earning”, Journal of Human Resources, 24, 4
[1040] INTRA‐REGIONAL WAGE INEQUALITY IN PORTUGAL
João Pereira1,Aurora Galego2 1 Universidade de Évora and CEFAGE‐UE, Largo dos Colegiais, 2, Évora, Portugal, Email: [email protected] 2Universidade de Évora and CEFAGE‐UE, Largo dos Colegiais, 2, Évora, Portugal, Email: [email protected]ABSTRACT. Studies on intra‐regional inequality are scarce, particularly for European countries. This paper
aims at further investigating inequality by focusing on wage differences within regions. We consider the case of Portugal, which is considered one of the countries with the highest economic inequality. In particular, we analyse the evolution of intra‐regional wage inequality between 1995 and 2005, employing the quantile‐ based decomposition suggested by Melly (2005), which allows us to study inequality along the entire wage
20th
APDR
Congress
|
ISBN
978
‐989
‐8780
‐01
‐0
1083 distribution. Our results show that wage inequality evolution has been different for the several regions, as it increased in some regions and decreased in others. Different changes in the work force composition explain these diverse developments. Keywords: inequality, wage decomposition, quantile regression, regions RESUMO. Estudos acerca da desigualdade intra‐regional são escassos, em especial no que respeita a países europeus. Este artigo tem como objetivo aprofundar o estudo da desigualdade concentrando‐se na análise das diferenças salariais dentro de cada região. Vamos considerar o caso de Portugal, que é considerado um dos países com maiores níveis de desigualdade. Em particular, analisamos a evolução da desigualdade salarial de cada região entre 1995 e 2005, usando a decomposição sugerida por Melly(2005) que nos permite a análise da desigualdade ao longo de toda a distribuição salarial. Os resultados mostram que a desigualdade salarial teve uma evolução diferente para as várias regiões, tendo aumentado numas e diminuído noutras. Estes desenvolvimentos são essencialmente explicados por diferentes alterações na composição da mão‐de‐obra nas diversas regiões ao longo do tempo.
Palavras‐chave: desigualdade, decomposição salarial, regressão de quantis, regiões
1. INTRODUCTION
Economic inequality is a major concern not only for governments but also for academics around the world. Studies report that economic inequality remained relatively stable since the second world war until the 1980s (Blinder, 1980; Lemieux, 2008). However, in the 1980s and 1990s several studies reveal an upward trend in economic inequality in many countries, namely in Anglo‐Saxonic countries such as the USA, the UK and Canada (Lemieux, 2008). Other countries, such as France, Japan and Germany did not experience such upward trend in inequality. There is also evidence that the upward trend in inequality continued in the 2000s in the USA and other countries but at a slower pace (Autor et al., 2008; Centeno and Novo, 2009; Dustmann, 2009; OECD, 2011).
The vast majority of studies analyse inequality at national level or differences among countries. There are, as well, several studies that have considered inter‐regional wage differences (Blackaby and Murphy, 1995; Garcia and Molina, 2002; Motellón et al., 2011; Pereira and Galego, 2011; Pereira and Galego, forthcoming). These studies analyse wages of different regions at equal moments of the wage distribution (the mean or specific quantiles), but fail to explain the dispersion of wages within regions. Research at intra‐regional level, rising issues of potential spatial heterogeneity on wage inequality, is very scarce, particularly about Europe (Monastiriotis, 2002; Taylor, 2006; Dickey, 2007 for the UK; Goerlich and Mas, 2001 for Spain or Perugini and Martino, 2008 for the European regions). Yet, in order to better understand the causes of wage inequalities it is important not only to investigate inequalities at national level and even inter‐regional differences, but also to study intra‐regional inequality. Indeed, regional inequality may have important economic consequences as it may reduce economic growth in the long run (Goerlich and Mas, 2001; Perugini and Martino, 2008). Therefore, a comprehensive knowledge of this labour market feature is important in order to improve the effectiveness of policies and to design inequality correction programs. This paper aims at further investigating inequality by focusing on wage differences within regions. We consider the case of Portugal which is referred to as one of the countries with the highest economic inequality (OECD, 2005; Cardoso, 1998; Centeno and Novo, 2009). Although Portugal shares most institutional features of Continental Europe, it displays inequality levels similar to those of the Anglo‐Saxonic countries (Centeno and Novo, 2009; Cardoso, 1998). There are also important and persistent inter‐regional wage differentials in Portugal, which are documented by several studies (Vieira et al., 2006; Pereira and Galego, 2011; Pereira and Galego, forthcoming). Nevertheless, as well as for the rest of Europe, empirical research focusing on earnings inequality within regions is missing in Portugal.
The evolution of intra‐regional wage inequality in Portugal between 1995 and 2005 is analysed. We consider data from the Portuguese Ministry of Employment – Quadros de Pessoal ‐ and employ a quantile‐based decomposition method suggested by Melly (2005). To the best of our knowledge, this is the first application of this methodology to the issue of intra‐regional wage inequality. This approach has several advantages in relation to the usual single index measures (Gini, Theil, etc.) commonly used in economic inequality analysis. Firstly, it allows analysing economic inequality along the entire wage distribution. Secondly, single index measures can yield different rankings of inequality, as they weight differently distinct parts of the wage distribution (Melly, 2005). Finally, and in the spirit of the Blinder (1973) and Oaxaca (1973) and Juhn et al. (1993) decompositions, Melly (2005) method decomposes changes in inequality into components explained by changes in characteristics, returns to characteristics and residuals, allowing for a better understanding of the causes for changes in inequality.
20th
APDR
Congress
|
ISBN
978
‐989
‐8780
‐01
‐0
1084
Our results show that wage inequality evolution has been heterogeneous in the several regions of Portugal, as inequality increased in some regions, but decreased in others. This heterogeneity occurs also at the gender level. However, in general, there was a trend towards lower wage inequalities between and within specific groups of workers in the regions (due to coefficients and residuals), which occurred for both genders. Hence, the increase in wage inequality in some regions is explained by substantial improvement in the work‐force composition (due to changes in characteristics). These findings confirm that it is important to consider the analysis of inequality inside regions, besides national inequality and inter‐regional inequality, so that we can fully understand the patterns of inequality in each country. The paper is organised as follows. In section 2 there is a summary of the empirical literature on inequality. Then, in section 3, the methodology used in this study is presented. Section 4 provides a preliminary analysis of the data. In section 5, we present and discuss our findings. Finally, section 6 concludes. 2. BRIEF REVIEW OF EMPIRICAL EVIDENCE ON INEQUALITY Investigation on economic inequality regained strong interest as several studies for Anglo‐Saxonic countries documented an increase in inequality since the 1980s to at least the middle of the 2000s (Autor et al., 2008; Lemieux, 2008; OECD, 2011). However, the pattern followed by economic inequality along these decades was not equal. While in the eighties inequality increased along the entire wage distribution, in the following decades the increase was concentrated in the upper‐tail of the wage distribution (Autor et al., 2008; Lemieux, 2008).A field of the literature has suggested that skill‐biased technological change, driven by the computer revolution, raised the relative demand for skilled workers leading to an increase in inequality (Acemoglu, 2002; Krueger, 1993). However, analyses for other countries (like France, Germany and Japan) reveal that inequality did not follow the same trend as in English‐speaking countries. Therefore, other complementary explanations emerged stressing the role of wage‐setting institutions to justify these different developments. First, in continental Europe the wage‐setting process is more centralised and unions have a stronger influence than in the USA. Second, the decline in the real minimum wage in the USA accounts for most of the increase in wage inequality at the lower end of the wage distribution (Dinnardo et al., 1996). Third, Piketty and Saez (2006) point out performance pay schemes of executive and top executives as responsible for the increase of the top‐end inequality in the nineties. Finally, de‐unionization may also have contributed to increase top‐end inequality (Card, 1992; Freeman, 1993).
Within continental Europe, Portugal is one of the countries with the highest economic inequality in the private sector (Cardoso, 1998; OECD, 2005; Centeno and Novo, 2009). Cardoso (1998) reports a very high level of wage inequality in Portugal as compared to other labour markets by mid‐ eighties. At that time, the overall wage inequality (measured by the Gini index) was higher in Portugal than in Canada, Sweden, Australia and West‐Germany, but similar to that of the UK (which was slightly lower than that of the USA, the paradigm of an unequal labour market). Since the beginning of the eighties Portugal has been continuously displaying high levels of inequality, although with some fluctuations, with inequality levels by mid‐2000s being higher than in the eighties (Centeno and Novo, 2009). In 2006 wage inequality in the upper tail of the wage distribution was even higher in Portugal than in the USA (Centeno and Novo, 2009).
Studies on wage inequality in Portugal have identified differences in education (Andini, 2010; Carneiro, 2008; Centeno and Novo; 2009; Machado and Mata, 2005; Budría and Pereira, 2011), differences in skills as well as changes in the relative demand for very qualified workers within industries (Cardoso, 1998) as the most important factors explaining inequality. Since the beginning of the eighties to mid‐nineties, inequality increased due to both the rise in the returns to education and to compositional changes in the work force, mainly concerning education (Machado and Mata, 2005; Centeno and Novo, 2009). After this period, compositional changes in the work force had a stronger role on inequality change, reflecting a greater supply of educated workers (Centeno and Novo, 2009).
Research focusing on intra‐regional inequalities is much less common and mainly analyse the case of the UK: Monastiriotis (2002), Taylor (2006) and Dickey (2007). There is also a study for Spain (Goerlich and Mas, 2001) and another for European regions (Perugini and Martino, 2008). Studies for the UK conclude that there are significant regional differences in inequality and that the causes differ across regions. Monastiriotis (2002) studies both inter and intra‐regional inequality between 1982 and 1997, concluding that most of the increased inequality in the UK in this period was due to intra‐regional differences. The author further concludes that the main determinant of wage inequality was the evolution of the returns to occupations. The focus of Taylor (2006) is on within‐group wage inequality across UK regions, its causes and how they evolved along a 15 year period. Dickey (2007), in turn, investigates inequality at different points of the earnings distribution, concluding that increasing returns to occupation, age and skills were responsible for the widening of all regional earnings distributions. Moreover, this author identifies the factors that shape
20th
APDR
Congress
|
ISBN
978
‐989
‐8780
‐01
‐0
1085 inequality differences across regions, like differences in wage premium for high‐skilled workers and on the impact of migration. Goerlich and Mas (2001) employ several inequality indicators for analysing inequality in the provinces and regions of Spain, concluding that there are marked differences in income inequality in the country. They also find evidence of a negative correlation between regional inequality, per capita income and growth. In fact, the richest (poorest) regions of the country are those more egalitarian (unequal). The negative association between inequality and growth is not confirmed in the study of Perugini and Martino (2008) for European regions, as the results indicate that regional inequality promotes growth in the short and medium terms. However, the negative link between inequality and growth is not rejected in the long term.
For Portugal, the analysis of earnings inequality within regions has been neglected. However, at the inter‐ regional level the literature reports important, persistent, and increasing differences along the wage distribution, partially explained by regional differences in education, occupational structure and firm size (Vieira et al., 2006; Pereira and Galego, 2011a; Pereira and Galego, forthcoming).
3. METHODOLOGY
We base our empirical analysis on Melly (2005) quantile‐based decomposition. Melly (2005) uses a similar framework as Juhn et al. (1993) to decompose differences in wage distributions between two time periods (years). The methodology takes as a starting point quantile estimations for t=0 (1995) and t=1 (2005) for Mincerian type wage equations:
ln
t t t( )
t,
1,0
i i iw
=
x
β θ
+
u
t
=
(1) whereln
t iw
represents the hourly real wage (in logs) i=1,…n is the number of observations in each year t, θ is the quantile being analysed,u
i is an idiosyncratic error term, and xi represents a set of explanatory
variables.
In the spirit of Juhn et al. (1993), the objective is to decompose changes in wage inequality along the time into three components: changes in characteristics, changes in coefficients and changes in residuals. First, Melly (2005) notes that taking the median as a measure of central tendency of the distribution, the wage equation for each time period can be written as:
ln
( )
0, 5
,
1, 0
t t t t i i iw
=
x
β
+
u
t
=
(2) Where( )
0, 5
tβ
is the coefficient vector of the median regression in year t. Next, the counterfactual wage distribution, that is, the distribution that would have prevailed in period 0 if the distribution of individual characteristics had been the same as in period 1, has to be estimated. This can be calculated by minimizing the following expression, over the distribution ofx
iin year 1 and using the coefficient estimates for period 0.( )
(
1)
(
( )
)
1 11
ˆ
ˆ
ˆ
,
inf
:
N J j j1
i j i jq
x
q
x
q
N
β
τ
τ
−β τ
θ
= =⎧
⎫
⎪
⎪
=
⎨
−
≤
≥
⎬
⎪
⎪
⎩
∑ ∑
⎭
(3) Hence,(
0 1)
(
)
(
1 0( )
)
1 1 11
ˆ
ˆ
ˆ
,
inf
:
1
N J j j i j i jq
x
q
x
q
N
β
τ
τ
−β τ
θ
= =⎧
⎫
⎪
⎪
=
⎨
−
≤
≥
⎬
⎪
⎪
⎩
∑ ∑
⎭
(4)is the
θ
th
quantile of the counterfactual wage distribution. The difference between(
)
0 1
ˆ
ˆ
,
q
β
x
and(
ˆ
0 0)
ˆ
,
q
β
x
is explained by changes in characteristics. In turn, to separate the coefficients effect from the residual effect we consistently estimate theτ
th
quantile of the residuals distribution conditional onx
by( )
( )
(
ˆ
ˆ 0.5
)
x
β τ
−
β
. The wage distribution that would exist if the median return to characteristics had been equal to that of period 1 but the residuals had been distributed as in period
0
is estimated by
20th
APDR
Congress
|
ISBN
978
‐989
‐8780
‐01
‐0
1086
(
ˆ
1, 0 1)
ˆ
m r,
q
β
x
, where 1, 0ˆ
m rβ
is a vector with the j element equal to( )
( )
( )
( )
1, 0 1 0 0
ˆ
m rˆ
0.5
ˆ
ˆ
0.5
j j
β
τ
=
β
+
β τ
−
β
. Consequently, the difference between
(
)
1, 0 1
ˆ
ˆ
m r,
q
β
x
and(
ˆ
0 1)
ˆ
,
q
β
x
results from changes in (median) coefficients as characteristics and residuals remain at the samelevel. Finally, the difference between
( )
1 1
ˆ
ˆ
,
q
β
x
and(
)
1, 0 1ˆ
ˆ
m r,
q
β
x
represents the variation due to residuals.
The following expression summarizes the three effects (residuals, coefficients and characteristics) responsible for the wage change between period 1 and period
0
.(
) (
) (
) (
)
(
) (
)
(
) (
)
1 1 0 0 1 1 1, 0 1 1, 0 1 0 1 : : 0 1 0 0 cˆ
ˆ
ˆ
ˆ
ˆ
ˆ
ˆ
,
ˆ
,
ˆ
,
ˆ
,
ˆ
,
ˆ
,
ˆ
ˆ
ˆ
,
ˆ
,
m r m rresiduals within group component coefficientes between group component
haracteristics
q
x
q
x
q
x
q
x
q
x
q
x
q
x
q
x
β
β
β
β
β
β
β
β
− −⎡
⎤
⎡
⎤
−
=
⎣
−
⎦
+
⎣
−
⎦
+
⎡
⎤
= +
⎣
−
⎦
14444244443
14444
4244444
3
1444424444
3
(5)The within‐group component (residuals) represents the part of the wage change explained by changes in wages within a specific group; the between‐group component represents the part of the wage differential explained by changing wage premiums of specific groups; finally, the characteristics effect represents the part of the wage variation explained by changes in the composition of the work force (Melly, 2005; Autor et al., 2005).
In a similar way we can decompose the wage changes at several inequality indexes. As in other studies (Autor et al., 2008; Dustman, 2009), we base our analysis on the following inequality indexes and their decomposition: changes in the 90‐10 log wage differential as measure of change in overall inequality; changes in the 90‐50 and the 50‐10 log wage differentials as measures of change of inequality in the upper‐ tail and lower‐tail of the wage distribution, respectively.
4.THE DATA
In this study we use individual data from Quadros de Pessoal for 1995 and 2005. This is a matched employer‐ employee dataset produced by the Portuguese Ministry of Employment. The survey provides information about all workers and firms in the private sector. It does not include data about the unemployed, those employed in public administration, the self‐employed or the armed forces. The available dataset contains information about earnings, hours of work, age, education, tenure, firm size, industry affiliation, occupation and the region where firms are located. In our sample, we considered only workers between 16 and 65 years of age and excluded those working in agriculture and fisheries sectors, as well as unpaid family workers and apprentices. We investigated the five regions on mainland Portugal, considering level two of regional aggregation – NUTS‐2. Therefore, individuals working in the Madeira and the Açores regions were not included468. In addition, given the huge amount of data available in Quadros de Pessoal and due to the time‐consuming methods used in this study, we randomly selected a sample of 10% individuals per region from the raw data. The final dataset includes 406,100 observations (234,873 males and 171,227 females).
Table 1 presents the descriptive statistics of the main variables for mainland Portugal and for the several regions469. Referring to national data, it is possible to conclude that there is an increase in wage levels between 1995 and 2005, for both genders. There is also an obvious upgrading in the workers’ education and occupations. On the contrary, there is a general decline on the average workers’ experience and tenure as well as on the average size of firms.
At regional level, there is a wage increase from 1995 to 2005 in all regions and for both genders as well as an improvement in the workers’ educational levels. There are, however, important gender and regional differences. Indeed, Lisboa is the region which displays the highest average
468 These regions are made up of islands and, therefore, present a quite different situation to those located on mainland Portugal.
20th
APDR
Congress
|
ISBN
978
‐989
‐8780
‐01
‐0
1087 wage for both 1995 and 2005, and also the region which presents the highest percentage of workers with university degree and secondary education. Between 1995 and 2005, for males, the increase of individuals with secondary education was higher than for those with a university degree in all regions. Yet, while in Lisboa and in the Norte the growth in secondary education was not much different from the change in the individuals with a university degree, in other regions, like the Algarve and Alentejo, secondary education grew far more than university education. On the contrary, the increase of females with a university degree was clearly higher than for those with secondary education across all regions.
Another important structural characteristic of the Lisboa region is that it shows the highest percentages of Senior officials and Managers, Professionals, Technicians and Associate professionals. Moreover, the percentage of workers performing these occupations (men and women) increased along the period under analysis. In general, the same trend occurred in other regions (apart from Alentejo and the Algarve in the case of Technicians and Associate professionals for men).This indicates the increasing role of high skilled jobs in the regions´ economy. Regional differences are not so evident in the workers’ experience and tenure levels. Apart from the Norte, the general level of experience decreased in the males’ case from 1995 to 2005; for women, it decreased in some regions (Lisboa, Algarve), but increased in other cases (Norte, Centro and Alentejo). With regard to tenure, there is a general decrease in the period indicating higher labour market turnover. Furthermore, in general, Lisboa also presents firms with higher average size in both years and genders. Nevertheless, the average firm size has decreased in every region between 1995 and 2005.
5. ANALYSIS OF RESULTS
To implement the wage decomposition proposed by Melly (2005), regional wage equations by gender and for several quantiles were first estimated. The logarithm of the real hourly wage was the dependent variable. As explanatory variables we used worker’s experience, tenure, 15 control dummies for industry affiliation, 9 occupational dummies, dummies for education and the logarithm of firm size. The coefficient estimates were in general statistically significant and displayed the expected signs. Due to the huge number of regressions for the several quantiles and both genders these estimates are not presented. However they can be provided upon request.
Figures 1 and 2 display the decomposition of wages changes (from 1995 to 2005) at national and regional levels for both genders. The measures of change in wage inequality and the decomposition analysis are presented in tables 2 and 3. Considering first the evolution of wage inequality at aggregate national level, we may conclude that there are some gender differences: whereas for men there is a slight decrease on the rate of change in wages along the wage distribution, for women there is a slight tendency to an increasing Table 1 Descriptive Statistics – selected variables
Norte Centro Lisboa Alentejo Algarve Portugal
1995 2005 1995 2005 1995 2005 1995 2005 1995 2005 1995 2005 MEN ln hourly wage 0.978 (0.538) 1.114 (0.521) 1.014 (0.504) 1.186 (0.505) 1.343 (0.651) 1.460 (0.675) 1.089 (0.539) 1.200 (0.533) 1.088 (0.552) 1.144 (0.490) 1.112 (0.594) 1.235 (0.583) Exp 24.345 (12.101) 24.673 (12.190) 25.544 (12.744) 25.193 (12.670) 25.619 (12.910) 24.125 (12.572) 25.911 (13.228) 24.679 (12.649) 25.144 (12.846) 24.851 (12.677) 25.107 (12.596) 24.644 (12.464) Tenure 8.614 (8.969) 7.977 (9.061) 8.481 (9.012) 7.671 (8.907) 9.585 (9.682) (9.111) 7.947 8.565 (9.143) 7.000 (8.433) 6.651 ( 8.025) 5.293 (7.318) 8.836 (9.216) 7.719 (8.951) Lfsize 3.799 (1.703) 3.331 (1.604) 3.607 (1.604) 3.203 (1.581) 4.212 (1.924) 3.773 (1.859) 3.354 (1.621) 3.077 (1.640) 3.182 (1.542) 2.894 (1.402) 3.851 (1.773) 3.392 (1.689) Secondary education 0.085 0.125 0.093 0.143 0.162 0.229 0.112 0.164 0.124 0.181 0.114 0.163 University degree 0.036 0.073 0.030 0.072 0.087 0.149 0.029 0.066 0.029 0.057 0.051 0.093 Senior officials and
Managers 0.026 0.043 0.025 0.043 0.057 0.064 0.029 0.044 0.040 0.046 0.036 0.049 Professionals 0.021 0.040 0.017 0.039 0.044 0.076 0.012 0.032 0.013 0.031 0.027 0.049 Technicians and Associate professionals 0.084 0.092 0.086 0.093 0.158 0.165 0.102 0.087 0.098 0.090 0.110 0.113 WOMEN ln hourly wage 0.723 (0.463) 0.943 (0.493) 0.750 (0.470) 0.965 (0.467) 1.105 (0.616) (0.616) 1.275 0.758 (0.465) 0.976 (0.442) 0.868 (0.482) 1.013 (0.441) 0.854 (0.545) 1.050 (0.541) Exp 20.676 (10.899) 22.027 (11.859) 2‐1.579 (11.553) 23.054 (12.514) 22.796 (12.512) 21.905 12.753) 23.539 (12.601) 23.792 (13.126) 23.682 (12.559) 23.283 (12.899) 21.748 (11.734) 22.383 (12.411) Tenure 7.844 (8.045) 7.542 (8.483) 7.264 (7.757) 7.114 (7.825) 8.353 (8.720) 7.582 (8.571) 6.667 (7.665) 6.428 (7.768) 5.620 (7.162) 5.383 (7.575) 7.757 (8.184) 7.291 (8.301) Lfsize 4.062 (1.758) 3.403 (1.684) 3.829 (1.741) 3.301 (1.642) 3.789 (1.953) (1.881) 3.504 3.143 (1.703) 3.017 (1.6078) 3.064 (1.612) 2.865 (1.554) 3.855 (1.828) 3.362 (1.732) Secondary education 0.098 0.171 0.125 0.189 0.226 0.281 0.158 0.214 0.177 0.235 0.149 0.213 University degree 0.035 0.110 0.035 0.116 0.098 0.202 0.032 0.094 0.026 0.092 0.054 0.136 Senior officials and
Managers 0.011 0.022 0.010 0.023 0.027 0.035 0.014 0.024 0.011 0.028 0.016 0.026 Professionals 0.018 0.056 0.019 0.057 0.046 0.090 0.013 0.041 0.010 0.039 0.026 0.065 Technicians and Associate professionals 0.043 0.079 0.046 0.072 0.120 0.135 0.054 0.080 0.063 0.077 0.069 0.094
20th
APDR
Congress
|
ISBN
978
‐989
‐8780
‐01
‐0
1088
rate of change in wages (see figures 1 and 2). Therefore, we may expect a decrease in wage inequality between those at the top and those at the bottom of the wage distribution in the case of men and an increase in the case of women. The measures of wage dispersion displayed in table 2 confirm a small decrease in overall inequality (90‐10) in the case of men from 1995 to 2005, while the opposite occurred in the women’s case (table 3). The slight decrease in overall inequality for men was stronger in the lower tail of the wage distribution (50‐10). The moderate increase in women’s wage inequality is explained by the increase of wage inequality in the lower tail of the wage distribution: the differential between those at the 50th and those at the 10th percentile increased about 3 log points from 1995 to 2005, whereas the differential between those at the 90th and those at the 50th percentile did not change significantly.
Melly (2005) wage decomposition allows us to understand very important developments in the determinants of the changes in wage inequality. Both the within‐groups (residuals) and the between‐groups (coefficients) components contributed to reduce overall wage inequality from 1995 to 2005. Indeed, the contribution of these two components for the (90‐10) log wage differential is negative for both genders. On the contrary, the covariates (characteristics) effect contributes to increase overall wage inequality for both genders. This contribution is stronger in the women’s case and in the upper‐tail of the wage distribution (90‐50=0.12), but occurs almost along the entire wage distribution (figure 2; table 3). This indicates that the small increase in wage inequality for women results from changes in the work force composition, particularly at the upper‐tail of the wage distribution, and not from increasing inequalities between or within workers’ groups. In the men’s case (figure 1; table 2), the contribution of the upgrade on the work force composition to the increase in wage inequality occurs only in the upper‐tail of the wage distribution (90‐50=0.066; 50‐10=‐0.006).
Our findings, as far as the price and composition effects are concerned, are in line with the results of Centeno and Novo (2009) and Budría and Pereira (2011). They report evidence of negative price effects and strong composition effects after 1995, mainly in the upper‐tail of the wage distribution. These results confirm that these trends continued up to the mid‐2000s. According to Centeno and Novo (2009), the strong increase in the supply of qualified workers after 1995, as a consequence of the country’s efforts to improve education, may explain these results. The key role of the compositional aspects on explaining the change in inequality reflects the shortage of skilled workers in the eighties and nineties in Portugal. This is a particular feature of the Portuguese labour market. Evidence for the USA (Juhn et al., 1993; Autor et al, 2008) reports a more modest contribution of the compositional changes of the work force for the change of wage inequality. The reduction in within‐group inequality is also in accordance with previous findings. In fact, Budría and Pereira (2011) found a decrease in the differential of the return to education between the 9th and the 1st decile of the wage distribution since the mid‐nineties (the within‐group component explained by education). This effect is particularly evident for individuals with tertiary education, which reduces within educational group wage inequality.
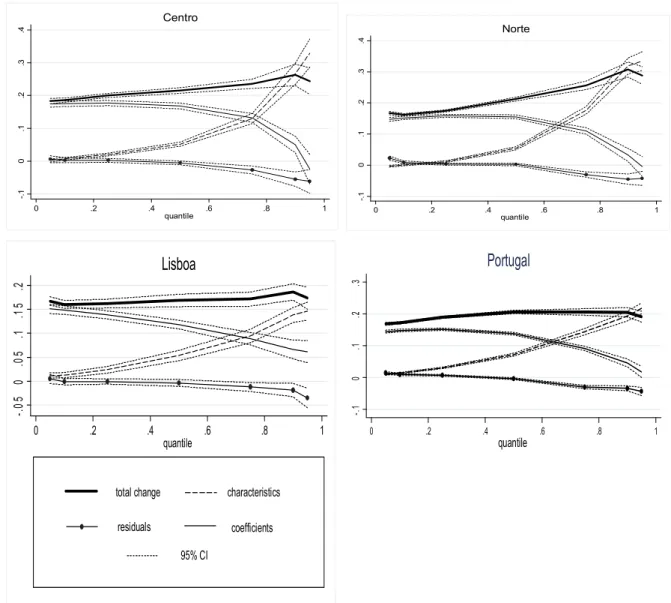
Analysing wage inequality at regional level, we conclude that the change in wages along the wage distribution is clearly heterogeneous among regions and genders (see: figures 1 and 2; tables 2 and 3). In fact, for males, the change in wages increases along the wage distribution in Lisboa, but clearly decreases in the Norte and the Algarve and remains more or less stable in the Centro. For example, in the region of Lisboa, the wage differential between those at the 90th and those at the 10th percentile increased about 9 pp (see table 2); the differential in the lower‐tail (50‐10) of the wage distribution increased about 3 pp, whereas in the upper‐tail (90‐50) it increased 5.5 pp. On the contrary, in the Norte and in the Algarve, the measures of change in wage inequality indicate a decrease in inequality along the wage distribution, stronger in the upper‐tail, particularly in the Algarve.
This regional heterogeneity on the evolution of regional inequality is also evident for women. Once again, there are regions where the change in wages typically increase along the wage distribution (Norte, Centro), whereas in others this change decreases (Alentejo and the Algarve). In particular, the wage differential between those at the top and at the bottom of the wage distribution decreased significantly in the Algarve (90‐10): ‐8.6 pp, while in the Norte and Centro the same wage differential increased 14.5 and 7.7 pp, respectively (see table 3). As in the cases where wage inequality increases, in the cases where it decreases, the movements in the upper‐tail (90‐50) of the wage distribution are more pronounced than in the lower‐tail (50‐10).
20th
APDR
Congress
|
ISBN
978
‐989
‐8780
‐01
‐0
1089 Figure 1: Decomposition of wage differences – Men -. 0 5 0 .05 .1 .15 .2 0 .2 .4 .6 .8 1 quantile Alentejo -. 2 -. 1 0 .1 .2 0 .2 .4 .6 .8 1 quantile Algarve -. 05 0 .0 5 .1 .1 5 .2 0 .2 .4 .6 .8 1 quantile Centro -.1 0 .1 .2 0 .2 .4 .6 .8 1 quantile Norte -. 1 0 .1 .2 0 .2 .4 .6 .8 1 quantile total change 95% ci characteristics residuals coefficients Lisboa -. 0 5 0 .0 5 .1 .1 5 0 .2 .4 .6 .8 1 quantile Portugal -. 1 0 .1 .2 .3 0 .2 .4 .6 .8 1 quantile Alentejo -. 2 -. 1 0 .1 .2 .3 0 .2 .4 .6 .8 1 quantile Algarve
20th
APDR
Congress
|
ISBN
978
‐989
‐8780
‐01
‐0
1090
Figure 2: Decomposition of wage differences – Women Concerning the intra‐regional decomposition analysis (figures 1 and 2; tables 2 and 3), the evolution of the part of the wage change explained by changes in coefficients (the between‐ groups component) is in line with the aggregate national evolution. In fact, there is a clear
Table 2: Decomposition of changes in measures of wage dispersion ‐ Men
Region Statistic Total change Residuals Coefficients Characteristics
Median 0.0735* (0.012) ‐0.018** (0.007) 0.131*(0.010) ‐0.039 *(0.009) Algarve 90–10 ‐0.164* (0.023) ‐0.06**(0.023) ‐0.025 (0.02) ‐0.078** (0.027) 50–10 ‐0.046*(0.011) ‐0.022** (0.011) 0.013 (0.008) ‐0.037* (0.007) 90–50 ‐0.117* (0.022) ‐0.038 (0.021) ‐0.038** (0.017) ‐0.041 (0.024) Median 0.100* (0.010) 0.007 (0.006) 0.132* (0.008) ‐0.039* (0.008) Alentejo 90–10 ‐0.025 (0.021) 0.026 (0.015) ‐0.050* (0.019) ‐0.002 (0.018) 50–10 ‐0.030*(0.01) ‐0.001(0.007) ‐0.002 (0.007) ‐0.027* (0.006) 90–50 0.004 (0.018) 0.027**(0.012) ‐0.048* (0.014) 0.025 (0.016) Median 0.137* (0.003) ‐0.011*(0.002) 0.142* (0.003) 0.006* (0.002) Norte 90–10 ‐0.040* (0.011) ‐0.040*(0.008) ‐0.067*(0.008) 0.067* (0.008) 50–10 ‐0.015* (0.004) ‐0.020*(0.003) 0.002 (0 .002) 0.004** (0.001) 90–50 ‐0.026*(0.009) ‐0.020* (0.007) ‐0.070*(0.007) 0.064* (0.007) Median 0.169*(0.00) ‐0.007* (0.003) 0.180 *(0.004) ‐0.004 (0.003) Centro 90–10 0.013 (0.012) 0.012 (0.008) ‐0.020**(0.009) 0.021**(0.009) 50–10 0.007 (0.005) ‐0.006 (0.004) 0.015* (0.003) ‐0.002 (0.002) 90–50 0.007 (0.010) 0.018**(0.007) ‐0.034* (0.007) 0.023* (0.008) Median 0.110*(0.005) ‐0.008*(0.003) 0.135* (0.004) ‐0.017* (0.004) Lisboa 90–10 0.088*(0.011) ‐0.031* (0.007) ‐0.006 (0.009) 0.125* (0.008) 50–10 0.033*(0.005) ‐0.007 (0.004) 0.030 *(0.004) 0.010* (0.003) 90–50 0.055*(0.009) ‐0.024* (0.006) ‐0.036 *(0.008) 0.115*(0.007) Median 0.123* (0.003) ‐0.010* (0.001) 0.143* (0.002) ‐0.010* (0.002) 90–10 ‐0.014** (0.006) ‐0.034* (0.004) ‐0.041* (0.005) 0.060* (0.005) -. 1 0 .1 .2 .3 .4 0 .2 .4 .6 .8 1 quantile Centro -.1 0 .1 .2 .3 .4 0 .2 .4 .6 .8 1 quantile Norte -. 05 0 .0 5 .1 .1 5 .2 0 .2 .4 .6 .8 1 quantile
total change characteristics residuals 95% CI coefficients
Lisboa
-. 1 0 .1 .2 .3 0 .2 .4 .6 .8 1 quantilePortugal
20th
APDR
Congress
|
ISBN
978
‐989
‐8780
‐01
‐0
1091 Portugal 50–10 ‐0.008* (0.002) ‐0.015* (0.002) 0.013* (0.002) ‐0.006* (0.001) 90–50 ‐0.007 (0.005) ‐.0018* (0.004) ‐0.054* (0.005) 0.066* (0.004) Notes: Bootstrap standard errors with 100 replications are in parentheses. (*), (**) significant at 1% and 5% level, respectively.
and generalised decrease of the wage premiums for the groups at the top‐end of the wage distribution relatively to those at the median (90‐50). This evolution occurs for both genders and across all the regions, but it is more pronounced for women. Quite likely, the increase in the supply of qualified workers resulting from the country’s efforts to improve education contributed to reduce these wage premiums (Centeno and Novo, 2009).
Also in line with the evolution at national level is the contribution of the residuals component to reduce intra‐regional wage inequality, mainly at the upper‐tail of the wage distribution (90‐50). A general negative contribution of residuals to inequality change means that within specific groups of workers, the wage differentials are lower in 2005 than in 1995. This trend occurs for both genders but its contribution to reduce inequality is clearly lower than the between component.
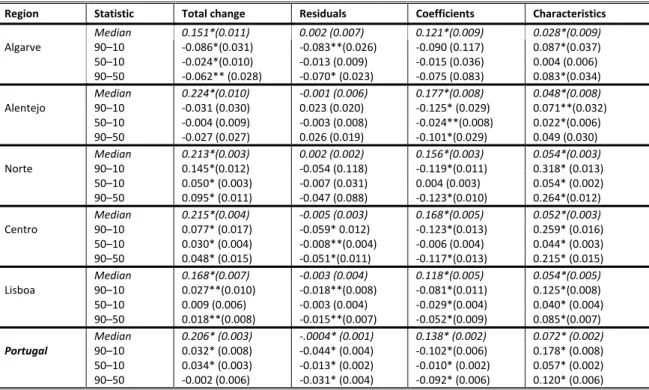
Table 3: Decomposition of changes in measures of wage dispersion ‐ Women
Region Statistic Total change Residuals Coefficients Characteristics
Median 0.151*(0.011) 0.002 (0.007) 0.121*(0.009) 0.028*(0.009) Algarve 90–10 ‐0.086*(0.031) ‐0.083**(0.026) ‐0.090 (0.117) 0.087*(0.037) 50–10 ‐0.024*(0.010) ‐0.013 (0.009) ‐0.015 (0.036) 0.004 (0.006) 90–50 ‐0.062** (0.028) ‐0.070* (0.023) ‐0.075 (0.083) 0.083*(0.034) Median 0.224*(0.010) ‐0.001 (0.006) 0.177*(0.008) 0.048*(0.008) Alentejo 90–10 ‐0.031 (0.030) 0.023 (0.020) ‐0.125* (0.029) 0.071**(0.032) 50–10 ‐0.004 (0.009) ‐0.003 (0.008) ‐0.024**(0.008) 0.022*(0.006) 90–50 ‐0.027 (0.027) 0.026 (0.019) ‐0.101*(0.029) 0.049 (0.030) Median 0.213*(0.003) 0.002 (0.002) 0.156*(0.003) 0.054*(0.003) Norte 90–10 0.145*(0.012) ‐0.054 (0.118) ‐0.119*(0.011) 0.318* (0.013) 50–10 0.050* (0.003) ‐0.007 (0.031) 0.004 (0.003) 0.054* (0.002) 90–50 0.095* (0.011) ‐0.047 (0.088) ‐0.123*(0.010) 0.264*(0.012) Median 0.215*(0.004) ‐0.005 (0.003) 0.168*(0.005) 0.052*(0.003) Centro 90–10 0.077* (0.017) ‐0.059* 0.012) ‐0.123*(0.013) 0.259* (0.016) 50–10 0.030* (0.004) ‐0.008**(0.004) ‐0.006 (0.004) 0.044* (0.003) 90–50 0.048* (0.015) ‐0.051*(0.011) ‐0.117*(0.013) 0.215* (0.015) Median 0.168*(0.007) ‐0.003 (0.004) 0.118*(0.005) 0.054*(0.005) Lisboa 90–10 0.027**(0.010) ‐0.018**(0.008) ‐0.081*(0.011) 0.125*(0.008) 50–10 0.009 (0.006) ‐0.003 (0.004) ‐0.029*(0.004) 0.040* (0.004) 90–50 0.018**(0.008) ‐0.015**(0.007) ‐0.052*(0.009) 0.085*(0.007) Median 0.206* (0.003) ‐.0004* (0.001) 0.138* (0.002) 0.072* (0.002) Portugal 90–10 0.032* (0.008) ‐0.044* (0.004) ‐0.102*(0.006) 0.178* (0.008) 50–10 0.034* (0.003) ‐0.013* (0.002) ‐0.010* (0.002) 0.057* (0.002) 90–50 ‐0.002 (0.006) ‐0.031* (0.004) ‐0.092* (0.006) 0.120* (0.006) Notes: Bootstrap standard errors with 100 replications are in parentheses. (*), (**) significant at 1% and 5% level, respectively. Referring to the contribution of the characteristics effect at regional level, we conclude that the evolution is not homogenous. In fact, in some regions the characteristics effect was strong enough to increase regional wage inequality. This is the case of Lisboa for males and of Norte and Centro for females (see: figures 1 and 2; tables 2 and 3). The positive characteristics effect is particularly strong at the upper‐tail of the wage distribution (90‐50). This development means that there were upgrading movements in the work force composition, reinforcing the weight of the groups at the top‐end of the wage distribution. Therefore, inequality increased in some regions (Lisboa: males; Norte and Centro: females) due to changes in the composition of the work‐force and not because the wage differential between or within defined groups had increased. Moreover, there are some gender differences in the characteristics effect which is always positive and particularly higher for women in all the regions, which does not occur for men.
The Melly (2005) decomposition method does not provide information about the contribution of each covariate to the wage decomposition (characteristics effect, coefficients effect and residuals effect). However, the heterogeneity in the regional evolution of the characteristics effect obviously results from asymmetric regional developments of single or groups of covariates. Taking into account the analysis in section 4, the most evident regional and gender asymmetries are on the evolution of education. In fact, it is likely that the characteristics effect had contributed to increase wage inequality in regions where the increase of individuals with a university degree was at least similar to those with secondary education. Also, the observed gender differences are most probably related to the increasing participation of women in
20th
APDR
Congress
|
ISBN
978
‐989
‐8780
‐01
‐0
1092
education along the years (secondary education and universities) in Portugal. This suggestion is consistent with previous evidence at national level, namely as regards the effects of a higher proportion of more educated individuals on increasing inequality (Centeno and Novo, 2009; Machado and Mata, 2005). Quite likely, the factors explaining why relatively more jobs requiring skills at the level of secondary education were created in some regions than in others, are linked with differences in the industrial and occupational structures. 6.CONCLUSIONS In this paper we analysed intra‐regional wage inequality in Portugal using the Melly (2005) decomposition approach. To the best of our knowledge, this is the first application of this methodology to study issues of intra‐regional inequality. This approach allows analysing wage inequality along the entire wage distribution unlike the studies that are carried out using single index measures (Gini, Taylor). In addition, by using the Melly (2005) approach we may identify the reasons for the changes in wage inequality in three components: change in characteristics, change in returns to characteristics and change in residuals. Our results show that there is regional heterogeneity on the evolution of wage inequality in Portugal. In fact, there are regions where wage inequality increased (males: Lisboa; females: Norte and Centro), whereas in others it decreased (males: Norte and the Algarve; females: Alentejo and the Algarve). We conclude that, in general, there was a decline in the wage premiums ‐ the between component ‐ related to education, high‐ skilled occupations and other workers’ skills, which contributed to reduce wage inequality. Likewise, the residual or within‐group component of Melly’s (2005) wage decomposition also contributed to reduce wage inequality. Hence, the characteristics effect is the main responsible for the asymmetric evolution in inequality. Indeed, wage inequality increased in regions where there were substantial improvements of workers’ characteristics, mainly in the upper‐tail of the wage distribution. The most obvious explanation for this development seems to be the increase of individuals with university degree, which is particularly evident in the women’s case.In sum, while previous evidence at national level has identified education as a source of increased wage inequality, in this study we further uncover that its influence is not homogenous across the space. Inequality dynamics may be strongly influenced by different developments related to workers’ education in the regions. Hence, public actions aiming at reducing wage inequality should consider these regional differences. Moreover, policy makers should take into account that these educational differences of the working force may be also related to the regional industrial and occupational structures. These divergent developments in the overall inequality of the Portuguese regions confirm that analysing inequality at intra‐regional level and along the wage distribution may be quite relevant, even in the case of a small country as Portugal. References Autor, A, Katz, L and Kearney, Melissa (2008) Trends in U.S. wage inequality: revising the revisionists. The Review of Economics and Statistics, May 2008, 90(2): 300–323. Andini, C (2010) Within‐groups wage inequality and schooling: further evidence for Portugal. Applied Economics 42: 3685–3691. Acemoglu D (2002) Technical change, inequality, and the labor market. Journal of Economic Literature 40(1):7–72.
Blackaby D. and Murphy P. (1995) Earnings, unemployment and Britain’s north–south divide: real or imaginary?, Oxford Bulletin of Economics and Statistics 57(4): 487–512.
Blinder A. (1973) Wage discrimination: reduced forms and structural estimates, Journal of Human Resources 8(4), 436–455.
Blinder, AS (1980) The level and distribution of economic well‐being. In: Feldstein M (ed) The American economy in transition. University of Chicago Press, Chigago, pp 415–499. Budría, S. and Pereira, P. (2011) Educational qualifications and wage inequality: evidence for Europe. Revista de Economía Aplicada 56(19), 5‐34. Card, D (1992) The effects of unions on the distribution of wages: redistribution or relabelling? NBER Working Paper No. 4195. Cardoso, A (1998) Earnings inequality in Portugal: high and rising? Review of Income and Wealth 44(3): 325‐343. Carneiro (2008) Equality of opportunity and educational achievement in Portugal. Portuguese Economic Journal 7: 17‐41. Centeno, M and Novo, A (2009) When Supply Meets Demand: Wage Inequality in Portugal, IZA Discussion Papers 4592, Institute for the Study of Labor (IZA). Dickey H (2007) Regional earnings inequality in Great Britain: evidence from quantile regressions. Journal of Regional Science 47: 775‐ 806. DiNardo J, Fortin N, Lemieux T (1996) Labor market institutions and the distribution of wages, 1973–1992: a semiparametric approach. Econometrica 64(5):1001–1046. Dustmann, C., Ludsteck, J. and Schonberg, U. (2009), Revisiting the German wage structure, Quarterly Journal of Economics, 124(2): 843–881. Freeman, R (1993) How much has deunionization contributed to the rise of male earnings inequality? In:Danziger S, Gottschalk P (eds) Uneven tides: rising income inequality in America. Russell Sage Foundation, New York, pp 133–163 Freeman, R, Katz L (1995) Differences and changes in wage structures. University of Chicago Press,Chicago. García I. and Molina J. (2002) Inter‐regional wage differentials in Spain, Applied Economic Letters 9: 209–215. Goerlich F. and Mas, M. (2001) Inequality in Spain 1973‐91: contribution to a regional database, Review of Income and Wealth 47(3): 361‐378.
20th
APDR
Congress
|
ISBN
978
‐989
‐8780
‐01
‐0
1093 Juhn, C., Murphy, M. and Pierce, B. (1993) Wage inequality and the rise in returns to skill, Journal of Political Economy 101: 410‐442. Lemieux, T (2008) The changing nature of wage inequality. Journal of Population Economics 21: 21‐48. Machado, J and Mata, J (2005) Counterfactual decomposition of changes in wage distributions using quantile regression, Journal of Applied Econometrics 20: 445‐465. Melly, B (2005), “Decomposition of differences in distribution using quantile regression”, Labour Economics, 12, 577–590.
Monastiriotis, V (2002), Inter and Intra‐regional wage inequalities in the UK: sources and evolution,
http://www2.lse.ac.uk/geographyAndEnvironment/research/Researchpapers/rp70.pdf
Motellón E., Bazo E. and Attar M. (2011) Regional heterogeneity in wage distributions: evidence from Spain, Journal of Regional Science 51(3): 558–584.
Krueger A (1993) How computers have changed the wage structure: evidence from microdata, 1984–1989. Quarterly Journal of Economics 108(1):33–60.
Oaxaca R. (1973) Male–female wage differentials in urban labour markets, International Economic Review 14, 693–709. OECD (2005) Employment Outlook. OECD Publishing, Paris.
OECD (2011) An overview of growing income inequalities in OECD countries: main findings, Divided We Stand: Why Inequality Keeps Rising, OECD Publishing, Paris.
Piketty T, Saez E (2006) The evolution of top incomes: a historical and international perspective. American Economic Review 96(2):200–205.
Pereira, J. and Galego, A. (2011) Regional wage differentials in Portugal: static and dynamic approaches, Papers in Regional Science, 90, 529‐548.
Pereira, J. and Galego, A. (forthcoming) Inter‐Regional Wage Differentials in Portugal: An Analysis Across the Wage Distribution, Regional Studies.
Pereira, P and Martins, P (2004) Returns to education and wage equations. Applied Economics 36(6): 525‐531.
Perugini, C. and Martino, G. (2008) Income inequality within European regions: determinants and effects on growth, Review of Income and Wealth 54(3): 373‐406.
Taylor, K (2006) UK Wage inequality: an industry and regional perspective, Labour: Review of Labour Economics and Industrial Relations, 20(1): 91‐124.
Vieira J, Couto J and Tiago M (2006) Inter‐regional wage dispersion in Portugal. Regional and Sectoral Economic Studies, 6. URL:
http://www.usc.es~economet/reviews/eers616.pdf
APPENDIX A. Definition of variables
ln hourly wage Logarithm of the hourly wage rate (wage rate includes base remuneration, other regularly paid components and payment for overtime; the hours of work includes the normal duration of work and overtime hours).
Wages were deflated using the regional consumer price index from INE and are at 1995 prices. exp years of potential experience in the labour market = (age ‐ years of education ‐ 6)
exp2 exp2/100 tenure tenure in the current job (in years) tenure2 tenure2 /100 secondary education dummy variable; equals one if individual has a secondary education (twelve years). university degree dummy variable; equals one if individual has an university degree. lfsize Logarithm of the firm size occupational dummies Dummy variables identifying occupations at one digit level of aggregation of the Portuguese occupational classification.
industry dummies Dummy variables identifying the economic sector where the individual works, at one digit level of aggregation.
RS10.1 Tourism and Sustainable Development
Chair: Roberto Dias