Cycle Superhighway
ii
DIREITOS DE AUTOR E CONDIÇÕES DE UTILIZAÇÃO DO TRABALHO POR TERCEIROS Este é um trabalho académico que pode ser utilizado por terceiros desde que respeitadas as regras e boas práticas internacionalmente aceites, no que concerne aos direitos de autor e direitos conexos.
Assim, o presente trabalho pode ser utilizado nos termos previstos na licença abaixo indicada.
Caso o utilizador necessite de permissão para poder fazer um uso do trabalho em condições não previstas no licenciamento indicado, deverá contactar o autor, através do RepositóriUM da Universidade do Minho. Licença concedida aos utilizadores deste trabalho
Atribuição-NãoComercial-CompartilhaIgual CC BY-NC-SA
Cycle Superhighway
iii
Acknowledgements
This section will be written in Portuguese, once it is of better understanding for the people mentioned here.
Primeiramente agradeço a Deus, por ter proporcionado a experiência de vir fazer o mestrado em Portugal. Agradeço aos meus pais, Maristela e José Domingos, por sempre darem todo o amor e suporte necessário para a minha caminhada e para a realização dos meus sonhos.
À minha irmã Nathália, por todo o apoio e companheirismo, e por ser um exemplo de profissional no qual me inspiro.
Ao meu orientador, Professor Doutor Paulo Ribeiro, por todo o tempo dedicado para a orientação, pelas discussões e reflexões em conjunto para a elaboração deste trabalho.
Aos Professores Doutores Ana Seráfico e Marcus Seraphico, por plantarem em mim a semente da pesquisa na área dos transportes urbanos.
Aos meus amigos e companheiros nesse período do mestrado longe da família, por todo o apoio na realização deste trabalho.
Cycle Superhighway
iv
STATEMENT OF INTEGRITY
I hereby declare having conducted this academic work with integrity. I confirm that I have not used plagiarism or any form of undue use of information or falsification of results along the process leading to its elaboration. I further declare that I have fully acknowledged the Code of Ethical Conduct of the University of Minho
Cycle Superhighway
v
Abstract
Cycle Superhighways
Only 8% of the European Union residents use bicycle to commute, being the Netherlands the country with the biggest representativeness in bicycle use for everyday activities. Meanwhile in Portugal only 1% of the population use bikes for daily commutes, being the car, the most common mode of transport used by its residents.
Even if there is no expressive use of bicycles in most European countries, the benefits of this mode of transportation are well known. Starting from the health benefits, as bicycling is considered a physical activity, what lower people’s body fat and decreases the risk of diabetes, hypertension and some kinds of cancers, to the environmental benefits of the bicycle, which are related to the reduction of CO2
emissions to the atmosphere.
Cycle Superhighways (CS) were thought to be the bicycle connection between cities when people need to commute to work or study. These infrastructures are longer than 5 km and up to 30 km and allow bicyclists to perform higher speeds than the ones practiced in cities. The CS can be placed alongside highways or in totally different sites, but the basis is that bicycles have their own space away from cars and pedestrians to make inter-cities displacements.
Successful examples from the Netherlands, Denmark, Germany and United Kingdom, will be used to propose a Cycle Highway network to the Minho Region in Portugal to connect work and study sites to homes. This will contribute to make Portugal a cycling nation, as it is proven that CS promote the increase in bicycle use, and an eco-friendly country as well.
A use case of CS is proposed to the Minho Region to connect cities, such as Guimarães to Braga, what represents the connection between the two campuses of the University of Minho. Also, the connection by bicycle between Fafe, Guimarães and the site of research AvePark will be proposed.
Cycle Superhighway
vi
Resumo
Rodovias para Bicicletas
Apenas 8% dos moradores da União Europeia usam bicicleta para locomover-se, sendo a Holanda o país com maior representatividade no uso de bicicletas para atividades cotidianas. Entretanto em Portugal apenas 1% da população utiliza bicicletas para deslocações diárias, sendo o automóvel o meio de transporte mais utilizado pelos seus residentes.
Mesmo que não haja uso expressivo de bicicletas na maioria dos países europeus, os benefícios desse meio de transporte são bem conhecidos. Desde os benefícios à saúde, visto que o ciclismo é considerado uma atividade física, o que diminui a gordura corporal e diminui o risco de diabetes, hipertensão e alguns tipos de câncer, até os benefícios ambientais da bicicleta, que estão relacionados à redução das emissões de CO2 para a atmosfera.
As Cycle Superhighways (CS) foram pensadas para ser a conexão por bicicleta entre cidades quando as pessoas precisam ir ao trabalho ou estudar. Essas infraestruturas têm mais de 5 km e até 30 km e permitem que os ciclistas realizem velocidades mais altas do que as praticadas nas cidades. A CS pode ser colocada ao lado de rodovias ou em locais totalmente separados, mas a base é que as bicicletas têm seu próprio espaço longe de carros e pedestres para fazer deslocamentos entre cidades.
Exemplos bem-sucedidos da Holanda, Dinamarca, Alemanha e Reino Unido serão usados para propor uma rede de estradas cicloviárias à região do Minho, em Portugal, para ligar locais de trabalho e casas. Isto contribuirá para tornar Portugal uma nação ciclista, já que está provado que a CS promove o aumento do uso de bicicletas e um país mais ecológico.
Um estudo de caso de CS é proposto para a Região do Minho para conectar cidades, como Guimarães a Braga, o que representa a conexão entre os dois campi da Universidade do Minho. Também será proposta a conexão de bicicleta entre Fafe, Guimarães e o laboratório de pesquisa AvePark.
Cycle Superhighway vii
Table of Contents
Acknowledgements ... iii Abstract ... v Resumo ... viTable of Contents ... vii
List of Figures ... ix
List of Tables ... xi
List of Charts ... xii
1 Introduction ... 1
1.1 Objectives ... 2
1.2 Methodology ... 2
1.3 Structure of the Thesis ... 5
2 Literature Review ... 7 2.1 Bicycle Usage ... 7 2.1.1 Europe ... 7 2.1.2 Portugal ... 8 2.2 Benefits of Cycling ... 9 2.2.1 Health ... 9 2.2.2 Social Benefits ... 10 2.2.3 Environmental Benefits ... 10 2.2.4 Economic Benefits ... 11
2.3 Conventional Bicycle, e-bikes and Pedelecs ... 12
2.4 Infrastructure for Bicycles... 13
2.4.1 Cyclist Operating Space ... 14
2.4.2 Principles of Bicycle Infrastructure ... 15
2.4.3 Main Types of Bicycle Infrastructure ... 16
2.4.3.1 Shared Paths ... 16
2.4.3.2 Signed Shared Roads ... 17
2.4.3.3 Bicycle Lane ... 18
2.4.3.4 Bicycle Track ... 20
2.4.4 Cycle Infrastructure in Roads ... 21
2.4.4.1 Road Classification ... 22
2.4.4.2 Road Classification for Bikes ... 24
2.4.4.3 Making space for bicycles ... 27
2.4.4.4 Priority at intersections ... 29
3 Cycle Superhighways ... 32
Cycle Superhighway viii 3.2 Examples of CS in Europe ... 36 3.2.1 Denmark ... 36 3.2.2 United Kingdom ... 39 3.2.3 Germany ... 40 3.2.4 The Netherlands ... 41
3.2.5 Other lesser known Cycle Superhighways ... 42
3.2.6 Results of the CS usage ... 43
3.3 Infrastructure for a Cycle Superhighway ... 44
3.3.1 Planning process ... 44
3.3.2 Type of Path for CS ... 46
3.3.2.1 Paths in their own route ... 46
3.3.2.2 Paths along roadway ... 48
3.3.2.3 Bi-directional path along roadways ... 49
3.3.2.4 Other types of paths for Cycle Superhighways ... 50
3.3.3 Intersections on a Cycle Superhighway ... 50
3.3.3.1 Cycle Superhighway interaction with non-motorized road users ... 51
3.3.3.2 Intersections out of level ... 52
3.3.3.3 Signalized Crossings ... 53 3.3.3.4 Roundabouts ... 54 3.3.4 Road surface ... 55 3.3.5 Lighting ... 55 3.3.6 Service features ... 56 4 Case of Study ... 58 4.1 Site of Study ... 58
4.2 Travel Patterns in Guimarães ... 60
4.2.1 Modal share ... 62
4.3 Connecting Guimarães Closest Cities by Bike ... 63
4.4 Cycle Superhighway Connecting Fafe, Guimarães, AvePark and Braga ... 65
4.4.1 The issue of the access to AvePark ... 65
4.4.2 The Proposed New Freeway to AvePark... 67
4.4.3 The high demand of road access from Guimarães to Braga ... 69
4.4.4 Proposed Route of Cycle Superhighway ... 70
4.4.4.1 Estimated Cost of implementation ... 76
5 Discussion and Conclusion ... 78
5.1 SWOT Analysis ... 78
5.2 Conclusions ... 79
5.3 Future Works ... 81
List of References ... 82
Cycle Superhighway
ix
List of Figures
Figure 1: Method used to select the references used in the dissertation ... 3
Figure 2: Infrastructure standards discussed in the dissertation ... 4
Figure 3: Steps used to perform the use case of Cycle Superhighways in this dissertation ... 5
Figure 4: Comparison between bicycles, e-bikes and pedelecs Source: (Schleinitz, Petzoldt, Franke-Bartholdt, Krems, & Gehlert, 2017) ... 13
Figure 5: Bicyclist operating space Source: (American Association of State Highway and Transportation Officials - AASHTO, 1999) ... 15
Figure 6: Example of shared path Source: (Austroads, 2017) ... 17
Figure 7: Cross section of two-way shared use path Source: (American Association of State Highway and Transportation Officials - AASHTO, 1999) ... 17
Figure 8: Signed shared road Source: (Ulster County Trasportation Council, 2018) ... 18
Figure 9: Example of light segregated lane for bicycles Source: (Transport for London, 2014) ... 19
Figure 10: Example of mandatory cycle lane for bicycles Source: (Transport for London, 2014) ... 19
Figure 11: Typical bike lane cross section in a street with parking on both sides of the road Source: (AASHTO 1999) ... 20
Figure 12: Example of bicycle track Source: (Austroads, 2017) ... 20
Figure 13: Removal of traffic lane Source: (Sustrans, 2014) ... 27
Figure 14: Narrowing of traffic lanes Source: (Sustrans, 2014) ... 28
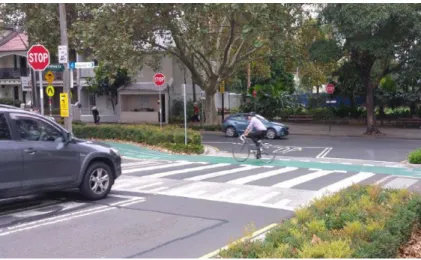
Figure 15: Example of an intersection where a path crossing has priority over a side street Source: (Austroads, 2017) ... 31
Figure 16: Cycle Superhighway with overpass in Denmark Source: (Capital Region of Denmark, n.d.-b) ... 32
Figure 17: Cycle Superhighways with wide width in the Netherlands Source: (Snelfietsroutes Gelderland, n.d.) ... 33
Figure 18: Planned Cycle Superhighways in Denmark by the year of 2017 Source: (Super Cykelstier Office, 2017) ... 37
Figure 19: Cycle network in London Source: (van Tuyl, 2017)... 39
Figure 20: Coverage area of RS1 in Germany Source: (Metropole Ruhr, 2015) ... 40
Figure 21: Routes of Cycle Superhighways in the Netherlands Source: (Goudappel Coffeng, n.d.) ... 42
Figure 22: Paths in their own route Source: (Super Cykelstier Office, 2017) ... 47
Figure 23: Illustration of bi-direction path in their own route with separation from pedestrians. Source: (Vejregler, 2016) ... 47
Figure 24: Paths along roads Source:(Super Cykelstier Office, 2017) ... 48
Figure 25: Illustration of path along the road Source: (Vejregler, 2016) ... 48
Figure 26: Bi-directional path along road Source: (Super Cykelstier Office, 2017) ... 49
Figure 27: Illustration of bi-directional path along road Source: (Vejregler, 2016) ... 49
Figure 28: Bus stop platform Source: (Farrell, 2015) ... 52
Figure 29: Bridge as intersection out of level in a CS Source: (Capital Region of Denmark, n.d.-a) ... 53
Figure 30: Signalized crossing in a CS Source: (Capital Region of Denmark, n.d.-a) ... 54
Figure 31: Footrest on CS intersections Source: (Capital Region of Denmark, n.d.-a) ... 54
Figure 32: Lights in a CS tunnel Source: (Supercykelstier, n.d.-a) ... 56
Figure 33: Service point on a CS Source: (Supercykelstier, n.d.-b) ... 57
Cycle Superhighway
x
Figure 35: Map of displacements to and from Guimarães Created by the author with data from: (Município de Guimarães,
2016) ... 64
Figure 36: Cycle Superhighway network ... 65
Figure 37: AvePark location Source: (Google Maps, 2019) ... 66
Figure 38: Map of dedicated road to AvePark Source: (Mendes & Ribeiro, 2015) ... 68
Figure 39: Cycle Superhighway network to connect Fafe, Guimarães, AvePark and Braga ... 71
Figure 40: View of the existing greenway connecting Guimarães to Fafe Source: (Ciclovia Portugal, n.d.) ... 72
Figure 41: Proposed view of requalified greenway connecting Guimarães to Fafe ... 72
Figure 42: Bicycle underpass between Guimarães and Fafe Source: (Ciclovia Portugal, n.d.) ... 73
Figure 43: Same level intersection between Guimarães and Fafe Source: (Ciclovia Portugal, n.d.) ... 73
Figure 44: Area if intervention in Guimarães at Doutor Alfredo Pimenta street Source: (Google Maps, 2019) ... 74
Figure 45: Section of requalified Doutor Alfredo Pimenta street in Guimarães ... 74
Figure 46: Proposed section for AvePark road with CS ... 75
Figure 47: Proposed section for CS along road M585 ... 75
Figure 48: "Ecovia" in Braga ... 76
Figure 49: Section of requalified “ecovia” in Braga ... 76
Cycle Superhighway
xi
List of Tables
Table 1: Principles of bicycle infrastructure implementation ... 16
Table 2: Cycle track width depending on the bicycle intensity ... 21
Table 3: Road Classification and its relationship with travel characteristics ... 23
Table 4: Road classification in Portugal ... 23
Table 5: Option diagram for road sections inside urban areas ... 26
Table 6: Guidance for cycling infrastructure ... 29
Table 7: Summary of the main requirements for intersections ... 30
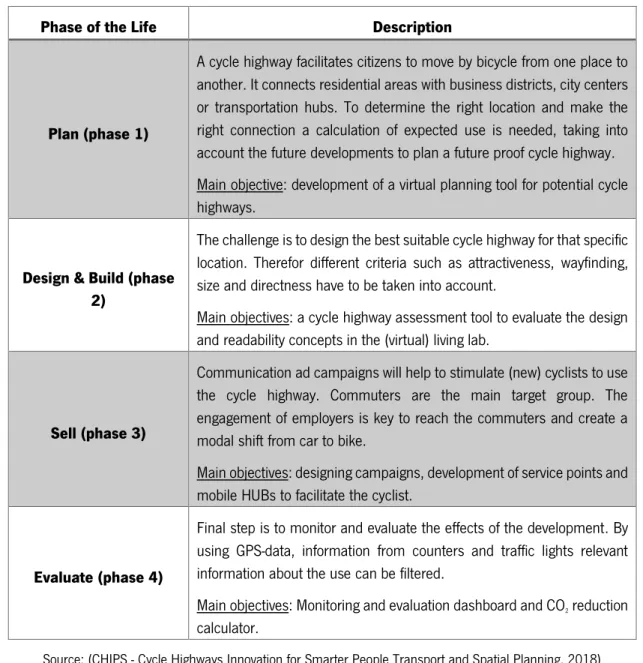
Table 8: The four phases of the life of a Cycle Superhighway ... 35
Table 9: Standard width for Cycle Superhighways in Denmark ... 38
Table 10: List of other lesser known Cycle Superhighways ... 43
Table 11: Synthesis of CS comparison ... 44
Table 12: Cycle Superhighway quality objectives ... 45
Table 13: Recommended widths for bi-directional path in own route ... 48
Table 14: Recommended width for paths along roads ... 49
Table 15: Recommended width for bi-directional path along road ... 50
Table 16: Other types of CS paths ... 50
Table 17: Principles for CS intersections ... 51
Table 18: Principles of lighting for CS ... 56
Table 19: Service features on a CS ... 57
Table 20: Global quantities of journeys in Guimarães... 60
Table 21: Main departure/destination places from Guimarães and the cost of the trip ... 61
Table 22: Annual Average Daily Traffic in different road sections from Guimarães to AvePark ... 67
Table 23: Monthly Average Daily Traffic at A11 in the first three months of 2019 ... 70
Table 24: Estimated Cost of Fafe-Guimarães-AvePark-Braga Cycle Superhighway ... 77
Cycle Superhighway
xii
List of Charts
Chart 1: Percentage of trips made by active and motorized modes of transport in the EU27, in 2014 Source: Created with data from (European Commission, 2014) ... 7 Chart 2: The expansion of the Cycle Superhighways in Denmark Source: (Office for Super CycleHighways, 2018) ... 38 Chart 3: Modal share in Guimarães Source: (Instituto Nacional de Estatística, 2011) ... 62
Cycle Superhighway
xiii
“Time and the world do not stand still. Change is the law of life.” John F. Kennedy
Cycle Superhighway
1
1 Introduction
The car has been the main mode of transport around the world since the 20th century, and the problems with its usage can be felt in the present days. Major and medium-sized cities suffer from long queues of traffic congestion everyday not only on peak hours, the problem with air pollution has been affecting people’s health and demanding more funding from governments for health units. Stress has also been a huge problem in modern society due to the problems caused by driving long hours and also for being stuck in traffic for long periods of time. These are some of the main reasons to promote a sustainable transportation, not only in cities, but also between them.
Bicycles have been used around society for more than two centuries and are proven to be a health and eco-friendly mode of transport. Promoting bicycle use in urban areas can lead to the reduction of traffic congestion, enable people to exercise outside when they are commuting, and make them interact with the streets and the surround environment, since bicycles have no barriers.
Therefore, this dissertation will show how bicycles have been used in a different way around Europe to promote a healthy and sustainable manner of commuting. The concept of Cycle Superhighways created in the Netherlands lead people to go through different cities by bicycle within a distance of more than 5 km in a comfortable and fast way. A suitable infrastructure is provided to cyclists since they do not need to interact with cars and pedestrians in these fast routes. The trails are planned to give total priority to cyclists with intersections in different levels from car roads and pedestrian paths.
Along with the concept and benefits of the use of bicycle in cities and between cities through Cycle Superhighways, there will also be made a benchmarking of the current infrastructures being used in Europe and the ones planned to be built in the next years. Emphasis will be given to countries that have been constructing wider networks of this kind of cycle infrastructure, such as Netherlands, Denmark, United Kingdom and Germany.
Although Portugal has a current very low bicycle usage rate, and has no Cycle Superhighways implemented in its territory, it is a small country, and the distances between cities are short, thus CS would be a procedure to promote the increase of bicycle use, as well as what happened to the countries where Cycle Highways were built.
The planning process of a Cycle Superhighway will also be presented in this dissertation. Starting with the information and the studies needed beforehand to attest the demand of a CS in a region. Also, the
Cycle Superhighway
2
infrastructure that is needed, since the types of CS that can be constructed to the special features that make a Cycle Superhighway a unique infrastructure for cyclists.
Thus, network of possible connections by CS’s will be proposed to the Minho Region of Portugal connecting major and smaller cities where the need of transport between households and worksites are significant and traffic congestion is perceived. The site of study chosen was the city of Guimarães, and from it the necessary traffic and demand studies will be performed to justify the need of CS in the region to connect Guimarães to other important cities.
1.1
Objectives
The objective of this dissertation is to understand and explore the concept of Cycle Superhighways and how these can contribute to a better, healthier, and easier way of commuting from one city to another. Another objective of this thesis is to show how favorable the implementation of Cycle Superhighways and bicycle infrastructure in general can be to the environment (by the reduction of pollutants in the air) and people who use the infrastructure (improvement in health and well-being).
Also showing successful cases of CS use around Europe to show how this infrastructure is meant to work and to be built to promote a cyclable society, as in Portugal less than 1% of the commutes are made by bicycle.
This dissertation also has the objective of presenting the infrastructure standards for CS implementation, starting from the planning process to the special infrastructure that makes a cycle path into a Cycle Superhighway.
Thus, this study has the main goal of study and present a proposal of a Cycle Superhighway to the Minho Region of Portugal, through the implementation of shorter CS between close cities where people need to commute from home to work. The smaller parts of the network of Cycle Superhighways will be suggested with planning and infrastructure standards to aid future works in this subject.
The network proposed will be created in GIS Software where it will be possible to design, retrieve, manage, display various types of geographic information.
1.2
Methodology
The adopted methodology for this thesis will be described as a list of phases to be performed. These phases are aligned with the objectives of this work and will be presented as follows:
Cycle Superhighway
3
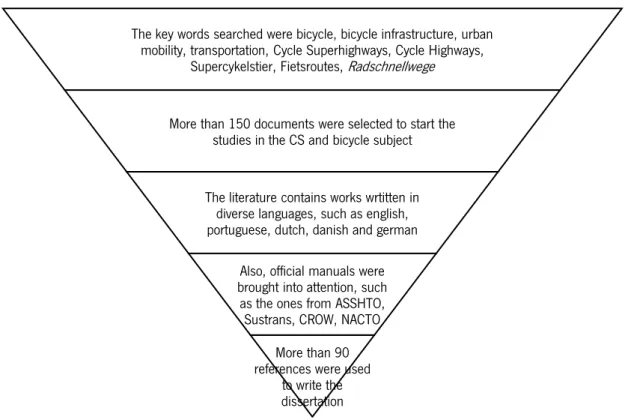
Phase 1 is related to the Literature Review, which in this case is the presentation of the bicycle as a mode of transport that needs to be considered in urban and planning. Also, will be showed the benefits of the bicycle, and the infrastructure needed to accommodate bicyclists when they need to share space with pedestrians, cars or when there is a segregated infrastructure for them. The last part is the presentation of the infrastructure for Cycle Superhighways and the explanation of the concept of this kind of infrastructure. Figure 1 illustrates how the selection of literature review was made.
Figure 1: Method used to select the references used in the dissertation
Phase 2 relates do the models applied in European cities (Benchmarking exercise) where the best practices related to the theme can be found. For this part of the dissertation, some countries were selected as they have already been working on CS for a while, have built infrastructure as well as plan to construct more length in Cycle Superhighway infrastructure.
Phase 3 is about the explanation of the need of space for bicycles on the streets and some space rearrangement examples that can be used to accommodate bicycles according to their necessities. Once bicyclists are more vulnerable in traffic and we seek a sustainable city, the roads need to give priority to accommodate this mode of transport.
The key words searched were bicycle, bicycle infrastructure, urban mobility, transportation, Cycle Superhighways, Cycle Highways,
Supercykelstier, Fietsroutes, Radschnellwege
More than 150 documents were selected to start the studies in the CS and bicycle subject
The literature contains works wrtitten in diverse languages, such as english, portuguese, dutch, danish and german
Also, official manuals were brought into attention, such as the ones from ASSHTO, Sustrans, CROW, NACTO
More than 90 references were used
to write the dissertation
Cycle Superhighway
4
Phase 4 is composed by the introduction of the infrastructure need for a Cycle Superhighway. For this phase two Danish manuals will be used to describe the specificities that make a CS a unique infrastructure to accommodate cyclists. Figure 2 shows how the infrastructure standards will be introduced.
Figure 2: Infrastructure standards discussed in the dissertation
Phase 5 is related to the presentation of a use case of the infrastructure of Cycle Superhighway network to the Minho Region, in Portugal. Through the literature review and examples from the benchmarking
Cycle Superhighway
Infrastructure
Types of paths
Paths in their own routes Paths along roadways Bi-directional paths along roadways Intersections on CS Intersections out of level Signalized crossings Roudabouts CS interaction with light eoad users
Intersection between bicycle paths Passagers at bus stops Road surface Lighting Service features
Cycle Superhighway
5
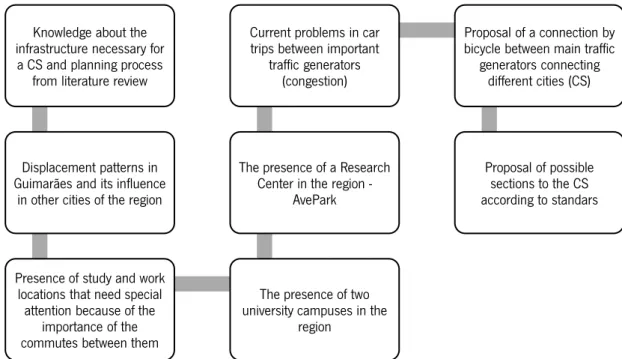
exercises, a connection of CS will be created to connect cities and advocate for a culture of bicycle usage to commute. Figure 3 shows the steps used to perform the use case present in this dissertation.
Figure 3: Steps used to perform the use case of Cycle Superhighways in this dissertation
Phase 6 will be the conclusion of the dissertation with a discussion and analysis of the theme.
1.3
Structure of the Thesis
Chapter 2 will present the Literature Review. Where will be shown how bicycle is used in Europe and particularly in Portugal. Next will be presented the benefits of the bicycle usage regarding the health benefits, social benefits, environmental benefits and economic benefits. Then the difference between conventional bicycle and e-bike will be explored, as it is of great importance for the usage of the CS by older people and for people who want to achieve more distant sites. After will be presented the different types of infrastructure for bicycles in urban areas, from shared paths to bicycle tracks.
Chapter 3 will present the concept and the infrastructure standards for Cycle Superhighways. An analysis of the infrastructure present in some countries in Europe (benchmarking) will be performed as well. In this part, some successful cases were selected to demonstrate how CS are being integrated in the transportation network and the way it affects the traffic.
Knowledge about the infrastructure necessary for
a CS and planning process from literature review
Displacement patterns in Guimarães and its influence
in other cities of the region
Presence of study and work locations that need special
attention because of the importance of the commutes between them
The presence of two university campuses in the
region
The presence of a Research Center in the region
-AvePark Current problems in car trips between important
traffic generators (congestion)
Proposal of a connection by bicycle between main traffic
generators connecting different cities (CS)
Proposal of possible sections to the CS according to standars
Cycle Superhighway
6
After the literature review and benchmarking, a use case around the city of Guimarães will be made in chapter 4 to demonstrate the feasibility of the potential plan of a Cycle Superhighway network to the Minho Region in Portugal.
Cycle Superhighway
7
2 Literature Review
2.1
Bicycle Usage
2.1.1
Europe
Only 8% of the European Union (EU) residents use bicycle as a mode of transportation for daily commute purposes (European Commission, 2014), being the car the prevalent mode, with more than 50% of representativeness in the daily commutes. The Netherlands still has the most prominent number of bicyclists in the EU, since 36% of its commutes are made by bike in a daily basis, what makes the proportion of bikes and cars on the streets almost the same. Denmark is the other country in Europe that has numbers likewise the ones shown in the Netherlands, having 23% of bicycle share in everyday commutes (European Commission, 2014).
Chart 1 shows the percentage of trips by active and motorized modes of transport by country in the European Union, what shows that Netherlands, Hungary and Denmark are countries that use active modes of transportation the most in Europe, while Cyprus, Luxemburg and Malta are the ones where active modes of transportation are least used by the population.
Chart 1: Percentage of trips made by active and motorized modes of transport in the EU27, in 2014 Source: Created with data from (European Commission, 2014)
0% 10% 20% 30% 40% 50% 60% 70% 80% 90% 100% EU27 A u str ia Bel gi u m Bul gari a Cyp ru s Cz ec h R ep u b lic De n mark Es to n ia Fi n lan d Fr an ce G e rman y G re ec e H u n gary Ire lan d Italy La tv ia Li th u an ia Lu xe mb u rg Mal ta N ath erl an d s Po la n d Po rt u gal R o man ia Sl o vakia Sl o ve n ia Sp ain Sw ed en Un ite d Kin gd o m
Cycle Superhighway
8
Unfortunately, in Portugal and Cyprus, only 1% of the population use bicycle as a main mode of transportation on workdays. This can be explained because residents of the European Union look for convenience (61%) and speed (31%) in their daily displacements as the more important features of the transportation mode, not being the price a major concern (12%) (European Commission, 2014). Thus, the population in countries that do not have an extensive and good infrastructure for active modes of transportation (walking and bicycling) disregard the use of bicycle as a daily mode of transportation, since this is not a comfortable way to travel. However, one of the main reasons why the Netherland has a big number of bicycle users daily is because this country supports this ecofriendly mode of transportation. According to data from the European Commission (2014), man and women have the same willing to use a bicycle to commute every day, while young people (15 to 24 years old) are more likely to use bicycle compared to people aged from 25 to 54 years old, who are less likely to use bicycle than people older than 55 years old. The level of education also plays an important role in bicycle use in European countries, since people with higher levels of literacy possess less tendency to use bicycles than the ones who do not, on the other hand people who are still studying are more likely to use bikes. This proves the fact that students have the highest probability of riding bikes than self-employed residents or people who are office workers. Another fact of the bicycle usage in the EU is the likelihood of its usage being higher in small or mid-sized town than larger or rural cities, respectively (European Commission, 2014).
2.1.2
Portugal
The representativeness of the bicycle among Portuguese cities is related to their sizes. Researches show that cities with population between 10,000 to 20,000 habitants tend to have 1.3% of their displacements made by bicycle, followed by cities with less than 10,000 habitants that have 0.7% of representativeness, meanwhile cities with population between 50,000 and 100,000 habitants have only 0.6% of their trips made by bicycle (IMT, 2014).
In cities with less than 10,000 habitants, in general, walking represents 50% or more of the displacements. Bicycles can have a 10% of modal share in some cities or regions in the center and south of the country (Marinha Grande, Oliveira do Bairro, Vendas Novas, Tondela) with a simultaneously very low usage of public transportation (Instituto das Mobilidades e dos Transportes, 2012).
In cities with population between 10,000 and 20,000 inhabitants, trips by foot are around 14% of all displacements. Some cities, like Gafanha, Águeda, Vila Real de Santo António, Almeirim and Peniche
Cycle Superhighway
9
have over 7% of bicycle utilization in their daily displacements (Instituto das Mobilidades e dos Transportes, 2012).
Walking is not a common mode of transportation for population movements in cities with more than 20,000 habitants, the utilization of bicycle is also almost disregarded in these areas (Instituto das Mobilidades e dos Transportes, 2012).
In short, the size of the city and consequently the lengths of displacements have a crucial responsibility in the usage or not of bicycles and the presence of active modes of transportation.
2.2
Benefits of Cycling
Currently, one of the world’s biggest concerns is the air pollution. Once it can cause a series of respiratory diseases especially in humans, increase of the temperature on earth, and consequently associated with some other climate catastrophes, such as hurricanes, droughts, floods, and many more (IPCC, 2014). This is one of the main reasons bicycles must be strongly considered in any mobility plan in major, medium and small cities.
Data from IPCC (2014) shows that the transport sector accounted for 27% of final energy use and 6.7 GtCO2 direct emissions in 2010, and baseline CO2 emissions have approximately doubled by 2015. That’s
why integrated urban planning, with more compact urban forms, transit-oriented development, which supports active modes of transport, such as bicycling and walking, can all lead to modal shifts, contributing to a reduction of the emission of pollutant gases in the atmosphere.
Currently, in a car-based society, it can be difficult to find and state the real benefits of riding a bicycle, as bicycling can be difficult and unsafe.
2.2.1
Health
Armstrong (2008) states that cycling, as a physical activity, can enhance cardiorespiratory endurance, muscular fitness, body composition, and prevent of cognitive decline and falls, as well as reductions in all-cause mortality, cardiovascular disease, and other chronic noncommunicable conditions, including diabetes mellitus, certain types of cancer, hypertension, bone and joint diseases, and mental disorders (e.g., depression).
Cycling can be considered a great form of physical activity, once its versatility in intensity and type is associated to several benefits to health and well-being. This can lead to the need of wider networks of
Cycle Superhighway
10
bicycle infrastructure, not only in cities, but between cities, where cyclists can have the opportunity to spend more time on a bike practicing exercise and improving their body and mental health, instead of being under stress conditions in traffic jams all over the world.
According to Donaire-Gonzales et al. (2015), implementing transportation policies that promote active modes such as cycling has been proposed as a promising method, although cycling rates in most developed countries like Spain are below 5%, cycling rates reach 20% in countries such as Denmark and the Netherlands, which have well-established active transport policies.
2.2.2
Social Benefits
Car-centric streets establish high-volume corridors and high-speed car travel. These car-centric streets come at the price of community disruption, urban sprawl, noise pollution, social isolation, restrictions on independent mobility for children and older adults, reduced opportunities for outdoor play, and fewer social interactions (Edwin, Schmid, Killingsworth, Zlot, & Raudenbush, 2003).
Armstrong (2008) assumes that urban designs supportive of biking increase street activity and “natural surveillance”; meaning that there are more people on the road to witness potential negative behaviors, increasing the social capital of the place. Perception of crime in the neighborhoods is associated with low social capital and can negatively impact participation in physical activity, including walking or biking for transportation. Thus, one major social benefit of biking is a reduction in crime (Cozens, Saville, & Hillier, 2005).
Cycling also provides travel options for those who may be unable to travel via other modes (e.g., underserved, low-income, children, older adults, and individuals with disabilities) by increasing the network of paths available and improving road crossings (Department of Transport and Main Roads, 2016). This improvement in mobility can lead to improved social inclusion. Furthermore, cycling may be a useful mean to reduce/eliminate health disparities and inequalities across different groups of population. As stated by Poucher & Buehler (2012), health is generally better and more equitable distributed across populations in healthy and active supportive environments. Given that disadvantaged populations often experience higher rates of morbidity and mortality when compared to other population.
2.2.3
Environmental Benefits
The environmental benefits of cycling can be separated in three ways: i) the reduction of CO2 emissions,
Cycle Superhighway
11
problems caused by car use that can be very much reduced if vehicles are replaced by bicycles in urban trips (EU Ministers for Transport, 2015).
The use of fossil fuels by cars generates approximately 7.71 kg to 9.97 kg of carbon per gallon (3.89 ℓ) of standard gasoline burnt (Armstrong, 2008). Shifting trips from automobiles to bicycle or walking, even just a small shift, could lead to a decrease in gasoline consumption, impacting fuel demand and prices. Küster & Blondel (2012) state that, a volume of cycling of 94 billion km/year could represent a reduction of 11 million to 24 million tons of CO2 concentration in the atmosphere. The range of the reduction
depends on the conversion rate from car to bicycle trips, and when considering the replacement of all car trips by bicycle trips, the reduction could reach the maximum number of 24 million tons of CO2.
An example of the reduction of air pollution due to bicycle use can be represented by the decrease in black carbon concentration on Brussels car-free day. According to Kuester (2018), after 9h00min (peak hour), the concentration of black carbon decreased to about 1/5 of a normal Sunday. After 19h00min, when cars return, the concentration increased almost immediately to high levels. For NO2, the other main
air pollutant caused by cars, the improvement was also significant as NO2 concentration dropped by 30%
compared to a normal Sunday.
2.2.4
Economic Benefits
In addition to the extensive health, social, and environmental benefits associated with cycling, there are many positive outcomes associated with biking and the combined infrastructure, policies, and programs to support biking. Costs can be calculated considering both direct costs (healthcare savings, time saved, and recreational benefits) and indirect costs (real estate values, spending by bikers, fuel saving, jobs created, and return on infrastructure investment) (Suh, 2015).
According to Armstrong (2008), in Copenhagen, riders travel 1.27 million km daily, and the Municipality has estimated that every kilometer traveled by bicycle results in a net gain of €0.11/km, whereas driving is associated with a loss of € 0.07/km as a result of savings in public sector investment and private economic sector activity.
Researches from Gossling & Choi (2015) show that, when comparing the costs of driving cars and riding bicycles in the city of Copenhagen, the active mode is more helpful for money saving. The average cost for km cycled is 0.08 euro, while a km driven by car costs 0.50 euro, these values are the found result when considering for the calculation: air pollution, climate change, road deterioration, noise, health benefits and prolonged life.
Cycle Superhighway
12
2.3
Conventional Bicycle, e-bikes and Pedelecs
Inventors have been experimenting with variations on two-wheeled, human-powered transportation since the beginning of the 19th century. The earliest bicycle had no mechanical pedaling system and was called velocipede because it relied on the rider pushing with their feet to move (Bopp, Sims, & Piatkowski, 2018). According to the European Commission (2000), technical improvements made bicycles more efficient, non-pollutant, quiet, discrete, economic and accessible to everyone, and overall, it is a more efficient and rapid mode of transportation when compared to cars in up to 5 km commutes in urban areas. The introduction of e-bikes changed the scenario and the number of kilometers cycled can increase even more.
Researches from Kroesen (2017) show that in the Netherlands e-bike owners travel on average 3 km with their e-bikes, which is more than what non e-bike owners travel with their normal bicycle (2.6 km). E-bike users also travel less by car and public transportation, leading to a modal shift from motorized to non-motorized transportation modes.
The advent of e-bikes and pedelecs are also related with higher number of accidents with serious injured cyclists in the Netherlands, associated with the aging of the population (decrease of physical and cognitive functions), increase of vulnerabilities, and the growing exposure because of the increase in the number of trips with a longer distance traveled on e-bikes within the urban area (Kovácsová et al., 2016). As stated by Plazier, Weitkamp, & Van Den Berg (2017) e-bike use is high in countries with traditionally high levels of conventional cycling, such as most northern European countries. In these countries, safety and infrastructural barriers to cycle have largely been overcome, making it possible to use the full benefits of e-bikes.
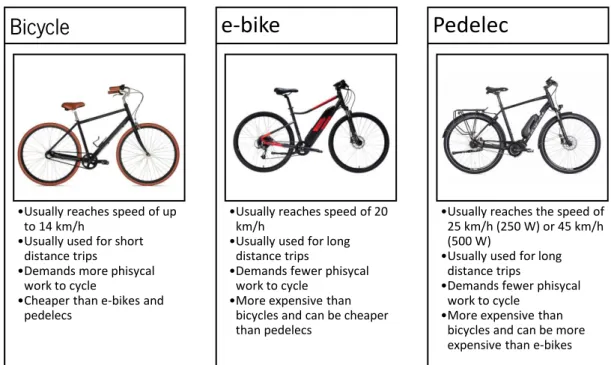
The pedelecs, as opposed to conventional bikes, allow bridging longer travel distances, reduce travel times, mitigate physical effort, overcome geographical or meteorological barriers, and facilitate cycling for elderly or physical impaired individuals, and that is the main reason why these vehicles are more suitable to be used in Cycle Superhighways (Kovácsová et al., 2016). A comparison between bicycles, e-bikes and pedelecs can be seen in Figure 4.
Cycle Superhighway
13
Figure 4: Comparison between bicycles, e-bikes and pedelecs Source: (Schleinitz, Petzoldt, Franke-Bartholdt, Krems, & Gehlert, 2017)
2.4
Infrastructure for Bicycles
According to Austroads (2017), a bicycle path or track is the place where there is a significant cycling volume (and its use is made exclusively by bicycles), there is a limited vehicle access across the path, and it is possible to achieve an alignment that generally allows cyclists to travel in an uninterrupted and safely time and speed.
As people who use bicycle have different infrastructure needs according to their experience or purpose of riding, American Association of State Highway and Transportation Officials - AASHTO (1999) reports three different types of cyclists. The advanced or experienced ones, which are riding for convenience and speed; basic or less confident users that cycle for transportation purposes, e.g., to get to the store or to visit friends, but prefer to avoid roads with fast and busy motor vehicle traffic; and children, riding on their own or with their parents.
Nevertheless, any type of bicycle facility suits every cyclist needs and no designed bicycle facility can overcome the lack of bicycle operator skill. Within any given transportation corridor, bicyclists may be provided with more than one option to meet the travel and access needs of all potential users (American Association of State Highway and Transportation Officials - AASHTO, 1999).
Heydon &Martin (2014) state that bicycle infrastructure should provide three main features that increase the likeability to cycle and improve the comfort of the cyclist:
•Usually reaches speed of up to 14 km/h
•Usually used for short distance trips
•Demands more phisycal work to cycle
•Cheaper than e-bikes and pedelecs
Bicycle
•Usually reaches speed of 20 km/h
•Usually used for long distance trips
•Demands fewer phisycal work to cycle
•More expensive than bicycles and can be cheaper than pedelecs
e-bike
•Usually reaches the speed of 25 km/h (250 W) or 45 km/h (500 W)
•Usually used for long distance trips
•Demands fewer phisycal work to cycle
•More expensive than bicycles and can be more expensive than e-bikes
Cycle Superhighway
14
• Direct cycle routes between housing areas and major destinations make cycling the most pleasant and easy way to travel;
• Convenient cycle infrastructure means avoiding stop-start travel caused by obstructions, lack of priority, and narrow pavements shared with pedestrians;
• Speed of travel on a bicycle can be quicker than by car through an urban area if cycling infrastructure is made integral to newly designed streets.
According to a study performed in six different cities in Europe (Edinburgh, Cambridge, Amsterdam, Rotterdam, The Hauge, and Utrecht), the main barriers to encourage more cycling is the potential/inexperienced cyclist’s perception of the safety, comfort and continuity of the cycling network in their cities. Moreover, the design of the cycle infrastructure can have a big impact on transportation mode choice (Hull & O’holleran, 2014).
2.4.1
Cyclist Operating Space
According to Global Designing Cities Initiative (2007), cycle facilities should be designed for diverse vehicles and riders, for children on small tricycles, and people carrying goods in big cargo bicycles. AASHTO (1999) specifies that a cyclist requires at least 1.0 m of essential operating space based on their profile (Figure 5). An operating space of 1.2 m then should be assumed as the minimum width for any facility designed for exclusive or preferential use by bicyclists. Where motor vehicle traffic is allowed to be shared with bicycles, a 1.5 m operation space or more is desired.
Cycle Superhighway
15
Figure 5: Bicyclist operating space Source: (American Association of State Highway and Transportation Officials - AASHTO, 1999)
2.4.2
Principles of Bicycle Infrastructure
According to AASHTO (1999) and Heydon & Martin (2014), when planning and designing a bicycle facility it is important that some principles must be followed, considering the differences of the cyclists and the site of implementation. Table 1 shows the principles that should be regarded in bicycle facilities planning.
Cycle Superhighway
16
Table 1: Principles of bicycle infrastructure implementation
Principle Description
Simple Direct Routes Maintains momentum, routes are shorter, and wayfinding is easier
Cycling Separated from Walking
Shared-use pavements alongside roads benefit nobody. Such pavements are inconvenient, slow, and misappropriate space from pedestrians
Visibility Cycle infrastructure should be designed to allow people to see each
other regardless of what type of vehicle they are using
No Barriers Provision of facility to overcome barriers caused by topographical
features, e.g., rivers, railroads, freeways.
Accessibility Should be provided convenient bicycle access, especially in residential
areas
Pavement Surface Quality
Bikeways should be free of bumps, holes and other surface
irregularities. Utility covers and drainage grates should be at grade and, if possible, outside the expected path of travel
Source: (American Association of State Highway and Transportation Officials - AASHTO, 1999; Heydon & Martin, 2014)
2.4.3
Main Types of Bicycle Infrastructure
2.4.3.1 Shared PathsA shared path is where pedestrians and cyclists share the same path space. A shared path may be appropriate where demand exists for both a pedestrian path and a bicycle path but where there is a low number of pedestrians or cyclists and the use is not expected sufficiently great enough to provide separate facilities (Austroads, 2017). It is important to emphasize that this type of infrastructure can be used in some countries, but it is forbidden in Portugal.
Shared paths can be used for recreational purposes, and to provide local access by feeding links between high capacity paths, but sometimes this kind of sharing can be problematic, since the inexperience of cyclists can be a harm to pedestrians, narrow widths also play a problematic role in this type of paths. In these cases, it is needed that shared paths provide the connections between pedestrians and the road with proper design so that cyclists can leave and enter the general traffic stream safety and conveniently.
Cycle Superhighway
17
Figure 6: Example of shared path Source: (Austroads, 2017)
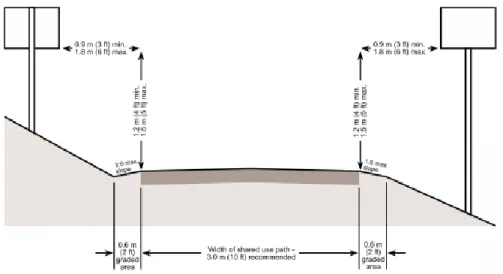
AASHTO (1999) recommends that the paved and operating minimum width required for a bi-directional shared use path should be of 3.0 m (Figure 7). A reduced width of 2.4 m can be adequate only when bicycle traffic is expected to be lower even on peak days, pedestrian usage of the facility is not expected to be more than occasional, and there will be good horizontal and vertical alignment providing safe and frequent passing opportunities.
Figure 7: Cross section of two-way shared use path Source: (American Association of State Highway and Transportation Officials - AASHTO, 1999)
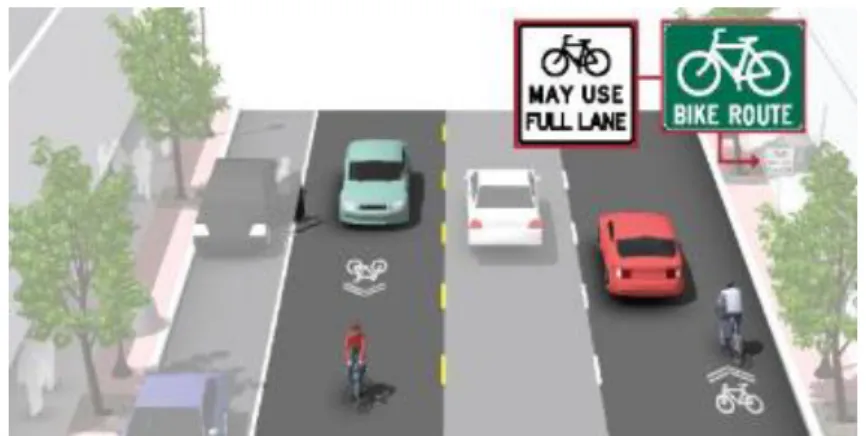
2.4.3.2 Signed Shared Roads
Signed shared roadways are those that have been identified by signing as preferred bike routes (Figure 8). These kind of roads need to be designed for some reasons to provide continuity to other bicycle facilities such as bike lanes and shared paths, the fact that the road is a common route for cyclists through a high demand corridor, the route extends along local neighborhood streets and collectors that lead to an internal neighborhood destination such as park, school or commercial district (AASHTO, 1999).
Cycle Superhighway
18
Figure 8: Signed shared road Source: (Ulster County Trasportation Council, 2018) Signed shared roads need to accomplish the following criteria (AASHTO, 1999):
• The route provides through and direct travel for cyclists in bicycle-demand corridors,
• The route connects discontinuous segments of cycling shared use paths, bike lanes and/or other bike routes,
• An effort must be made to adjust traffic control devices, e.g., stop signs, signals, to give priority to bicycles on the route. This could include also placement of bicycle detectors where bicyclists are expected to stop,
• Street parking is removed or restricted in areas of critical width to improve safety,
• A smooth surface is provided, e.g., adjust utility surface to grade, install bicycle-safe drainage gates, fill potholes, etc.,
• Maintenance of the route to prevent trash accumulation, e.g., regular street sweeping, • Wider curb lanes must be provided especially when compared to parallel roads,
• Shoulder or curb lanes width generally meet or exceed width requirements included under Shared Roadways standards.
2.4.3.3 Bicycle Lane
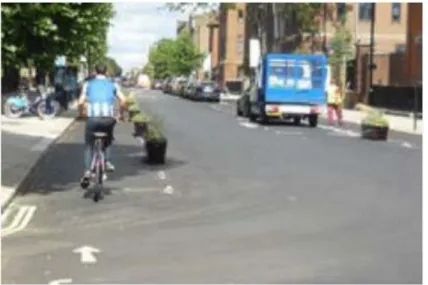
A bicycle lane is a part of carriageway marked with a formal lane-marking and is allocated for the use of cyclists (Transport for London, 2014). Bicycle lanes can also be represented differently according to the type of lane separation. Light segregated lanes are facilities separated and protected by intermittently placed objects, that generally include formal mandatory lane markings (Figure 9). Mandatory cycle lanes are marked lanes for exclusive use of cyclists (Figure 10). Other vehicles are forbidden to enter in the bicycle lane, unless they are exempted. For this kind of facility, separate parking restrictions are needed to be fully effective.
Cycle Superhighway
19
Figure 9: Example of light segregated lane for bicycles Source: (Transport for London, 2014)
Figure 10: Example of mandatory cycle lane for bicycles Source: (Transport for London, 2014)
AASHTO (1999) states that bike lanes are intended to define the right of way assigned to cyclists and motorists and also to provide more predictable movements for them. Bike lanes are also a good way to accommodate cyclists where insufficient space exists for comfortable cycling on existing streets.
A bicycle lane is distinguished from a bicycle path because it hasn’t physical barriers (bollards, medians, raised curbs, etc.) that restricts the encroachment of motorized traffic. Conventional bike lanes run curbside when no parking is present, adjacent to parked cars on the right-hand side of the street or on the left-hand side of the street in specific situations. Bike lanes typically run in the same direction of traffic, though they may be configured in the contra-flow direction on low-traffic corridors when they are necessary
Cycle Superhighway
20
to assure the connectivity of a particular bicycle route (National Association of City Transportation Officials, 2011)
As stated by National Association of City Transportation Officials (2011), the desirable bike lane width is 1.5 m from the face of a curb to the bike lane stripe. The desirable ridable surface adjacent to a street edge or longitudinal joint is 1.2 m, with a minimum width of 0.9 m. Figure 11 shows the typical bike lane cross section for a street with parking on both sides of the road.
Figure 11: Typical bike lane cross section in a street with parking on both sides of the road Source: (AASHTO 1999)
2.4.3.4 Bicycle Track
Bicycle track is a one-way or a two-way off-road facility exclusively for bicycles (Austroads, 2017) (Figure 12). An off-road bicycle path caters for full range of cyclists including inexperienced cyclists or those who want to avoid traveling alongside motor vehicles. Thus, there may be a broad range of cyclists using the off-road path.
Cycle Superhighway
21
Bicycle tracks may be one-way or two-way, and may be at street level, at sidewalk level or at an intermediate level. At sidewalk level, a curb or median separates cyclists from motor traffic, while different pavement color/texture separates the cycle path from the sidewalk. At street level, bicycles can be separated from motor traffic by raised medians, on-street parking, or bollards. The segregation of cyclists and motorized traffic will provide cycle paths with higher levels of security, and are more attractive to a wider spectrum of the public, especially when compared with bicycle lanes (National Association of City Transportation Officials, 2011)
For one-way bicycle tracks, Cycling Embassy of Denmark (2012) suggests the width of 2.2 m in both urban and rural areas with a guideline for a minimum width of 1.7 m. In cases of predicted large number of cyclists, it may be necessary to create space for 3 cyclists to cycle next to each other, with a minimum width of 2.8 m, preferably 3.0 m.
For bi-directional bicycle tracks, the desirable width is 3.5 m, and the minimum width in constrained locations is 2,5 m (NACTO, 2011). But depending on bike volume for the rush hour, the width can change, according to Table 2.
Table 2: Cycle track width depending on the bicycle intensity
Rush hour intensities (two directions,
bikes per hour) Cycle Track Width (m)
0-150 2
150-750 3
>750 4
Source: (National Association of City Transportation Officials, 2011)
2.4.4
Cycle Infrastructure in Roads
According to the Virginia Department of Transportation - VDOT (2014), the functional classification of roads is the process by which streets and highways are grouped into classes, or systems, according to the character of service they are intended to provide. Traditional road system has the task of enabling a certain type of mobility, fulfilling the need for road transportation. This task or function was imposed where possible on the existing road network, even after the marked rise in the number of motorized vehicles (SWOV Institute for Road Safety Research, 1994).
Federal Highway Administration - FHWA (2013) states that the concept of functional classification defines the role that a particular roadway segment plays in serving the flow of traffic through the network.
Cycle Superhighway
22
Roadways are assigned to one of several possible functional classifications within a hierarchy according to the character of travel service that each roadway provides.
The bases of the functional usage of roadway are mobility and accessibility. Travel can be logically related to the roadway’s ability to access land and to provide mobility through an area (VDOT, 2014). FHWA (2013) relates the roadway mobility function to the provision of few opportunities to enter and exit in the surrounding areas, and therefore low travel friction from vehicle access/egress is achieved, while the roadway accessibility function is related to the provision of many opportunities to enter and exit the adjacent lanes, which creates potentially higher friction from vehicle access/egress.
Road traffic system comprises the vehicles, the human input and the road to define how a road or a design will be performed, particularly in terms of safety. In relation to mode of transportation, these can be divided in users of motorized vehicles (trucks, buses, cars and motorcycles), users of non-motorized vehicles (bicycles and powered wheelchairs), and users without vehicles (pedestrians). Users of motorized vehicles influence road design primarily through the characteristics of design vehicles (Austroads, 2015). Since the invention and popularization of the car, cities and streets have been designed to firstly accommodate this mode of transport. Thus, cities that were thought for people turned into cities for cars (Instituto de Politicas de Transporte & Desenvolvimento - ITDP, 2017). This is the main reason for a road classification being associated with a matter to accommodate cars in first place, regarding infrastructure needs and speeds for this mode of transportation.
As the number of cars on the streets only grew since its dissemination, traffic congestion became a huge problem around the world. Instituto de Politicas de Transporte & Desenvolvimento - ITDP (2017) suggests that to lower the effects of traffic jams, journeys need to be managed, without creating more space or streets for cars, but promoting the sustainable modes of transportation. (ITDP, 2017) states that on the streets, the priority needs to be of the most sensitive, starting from pedestrians, to bicyclists, going through public transport, cargo transport, and the least priority should be given to cars and motorcycles. Considering what was stated above, the current road classification will be briefly described in this section, so it can be understood how the Cycle Superhighways can integrate the city’s transportation system and network combined to the existing and planned bicycle infrastructure in cities.
2.4.4.1 Road Classification
FHWA (2013) classifies the roads according travel efficiency (e.g., reaching the destination with minimum delays and short travel time), number of access points, speed limit, route spacing (allocation of traffic
Cycle Superhighway
23
throughout the network), usage (traffic volumes, e.g., Annual Average Daily Traffic - AADT), number of travel lanes, regional and statewide significance (e.g., highly significant roadways connect large activity centers and carry longer-distance journeys between and through regions).
Table 3 presents a functional classification of roads and their relationship with traveling characteristics, while Table 4 shows the main characteristics of the different types of roads according to the Functional Road Classification used in Portugal.
Table 3: Road Classification and its relationship with travel characteristics
Func tion al C las sif ic at ion D is ta nce Serv ed Ac ces s Point s Sp eed Li m it D is ta nce betw een Routes U sage ( AA D T) Sig nifi can ce Number of Tra vel Lanes
Arterial Longest Few Highest Longest Highest Statewide More
Distributors Medium Medium Medium Medium Medium Medium Medium
Local Shortest Many Lowest Shortest Lowest Local Fewer
Source: (Federal Highway Administration - FHWA, 2013) Table 4: Road classification in Portugal
Characteristics Arterial Main
Distributors
Local
Distributors Local Access
Speed Above 80 km/h Up to 50 km/h Up to 30 km/h Up to 20 km/h
Intersections Very few
With traffic lights, or in different
levels
In the same level (with traffic lights
or not)
In the same level
Parking Forbidden Allowed Allowed Allowed
Pedestrian crossing Can be in the same level or not, depending on the street Limited number, with traffic lights
Somewhat free, with a reasonable
formal crossing
Allowed all along
Motorized
Vehicles Only user Have preference
Have a slight preference
Share with other users Source: (Comissão de Coordenação e Desenvolvimento Regional do Norte, 2008)
Cycle Superhighway
24
According to the FHWA (2013), there is a relationship between speed limits and functional classification. Arterials typically have higher speed limits since vehicles must encounter few or any intersections. The absence of cross-traffic and driveway allowing for higher rates of speed, which provides mobility, especially for long-distance travel. Due to their primary role, which is to provide access, local streets are lined with intersecting access points in the form of driveways, intersecting roadways, cross walks and transfer points for buses and other modes. Due to the number of traffic turns, speed limits are kept low to promote safe traffic operations. Speed limits on any non-access-controlled roadways are also influenced by the mix of vehicles and modes that use them.
Regarding the type of road to accommodate the bicycle facilities, Jersey Department of Transportation & Department of Transportation (2008) states that a bike network plan should identify roadways for bike lanes, compatible shoulders or shared lanes, and shared paths. In many cases, the selected roadways will be arterial and collector roadways. Because cyclists prefer to travel on these roadways for the same reason that motorists do, as these provide the most direct route to key destinations, or main traffic generators.
In addition, it is important to implement different types of bicycle facilities according to the classification of the road in order to provide more comfort and safety to cyclists. In local streets, bicycles need to have priority, for distributors with one lane/one direction, bicycle lanes can be used, or even bicycle tracks, physically separated from motorized traffic. Arterial roads should be provided with cycle tracks or even totally detached of cycling infrastructures (California Department of Transportation, 2015).
2.4.4.2 Road Classification for Bikes
According to CROW (2007) bicycle amenities are divided in three different levels of cycle connections: connecting (city level), dividing (district level) and access (neighborhood level). Together, these three levels of connections form a cycle network. These networks can be divided in two basic levels, as described below:
• Basic network: this concerns the access connections at the neighborhood level, corresponding in practice with almost every track and every street that can be used by cyclists.
• Cycle routes: this concerns the connections at district level that provide access to districts and neighborhoods.
Cycle Superhighways could be added in a different level above the cycle routes, since they make connections between districts, consequently having bigger distances to be traveled and need to have a
Cycle Superhighway
25
different approach to its infrastructure implementation. In this case these would be the “backbone” of the entire bicycle network (e.g., representing a similar role of an “arterial” road in road classification). European Commission (2000) states that creating more space for bicycles on the streets is not the only approach to improve cycling in cities. Other ways that contribute to increase bicycle usage could be the good quality of pavement, avoidance of conflicts in traffic crossings, increase of time for cyclists traffic lights to avoid conflicts, support the implementation of small roundabouts to diminish conflicts and reduce loss of time for cyclists.
If the priority is to be given to bicycles as the main mode of transport, DiGioia et al (2017) states some safety treatments to reduce the number or severity of collisions between a motor vehicle and a non-motorized road users, the treatments generally need to address one or more of the following objectives:
• Increasing the separation of bicycles and motor vehicles in time and space; • Increasing the visibility and conspicuity of non-motorized users;
• Improving lines of sight between the modes;
• Reducing the number of interactions between modes (e.g., number of driveways); • Reducing motor-vehicle speeds.
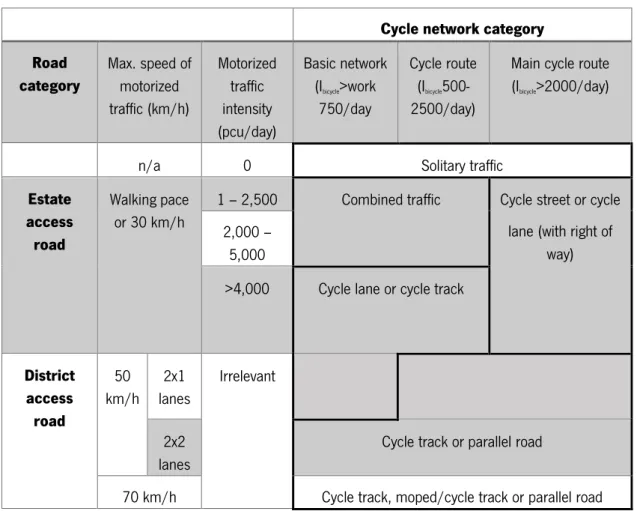
CROW (2007) specifies that for each road section, designers have to ask themselves what traffic facilities are required to guarantee cyclists a safe and pleasant situation. Table 5 shows a diagram that could help to choose the type of bicycle facilities on road sections inside urban areas.
Cycle Superhighway
26
Table 5: Option diagram for road sections inside urban areas
Cycle network category Road category Max. speed of motorized traffic (km/h) Motorized traffic intensity (pcu/day) Basic network (Ibicycle>work 750/day Cycle route (Ibicycle 500-2500/day)
Main cycle route (Ibicycle>2000/day)
n/a 0 Solitary traffic
Estate access road
Walking pace or 30 km/h
1 – 2,500 Combined traffic Cycle street or cycle lane (with right of
way) 2,000 –
5,000
>4,000 Cycle lane or cycle track
District access road 50 km/h 2x1 lanes Irrelevant 2x2 lanes
Cycle track or parallel road
70 km/h Cycle track, moped/cycle track or parallel road Source: (CROW, 2007)
A good perception of the infrastructure and space available to cycle is very important to users and future users. According to Hull & O’holleran (2014) besides the fact that people do not cycle because they have cars, 11% to 17% feel it is too dangerous and 7% to 16% say that the amount of traffic put them off. If these are the main reasons people say not to use bicycles for commuting, the road integration in the city environment needs to change, and this can be achieved by defining a road infrastructure that gives more space and priority to cyclists instead of cars.
This is the main reason why designers should think about function primarily when they design facilities for cyclists. For each road section, polices should indicate what function it is to serve for both bicycle and other traffic. The combination of functions results in the right basic form, within the actual appropriate layout is determined. The intensity of bicycle traffic, speed of the motorized traffic and the volume of the motorized traffic are the three factors that play an important role in the process of designing road sections (CROW, 2007).
Cycle Superhighway
27
As an example, having car-centric streets is the main reason that many cyclists feel insecure especially in heavy traffic streets. This is often due to heavy motor traffic, high speeds and lack of space, all of which are excellent reasons for establishing cycle tracks, and these should always be of such a standard that cyclists never choose to ride on the carriageway instead (Cycling Embassy of Denmark, 2012).
2.4.4.3 Making space for bicycles
The first aspect of a road that needs to be changed in order to give priority for bicycles is the reallocation of its space. A fundamental aspect of the provision of cycling facilities is the reallocation of the carriageway from motor vehicles to cycling. This adjustment makes an important change about relative priority of different transport users, since it not only promotes cycling but can also act as a restraint for motor traffic, which is an important aspect of transport and planning policy in congested urban areas. Typically, this will involve the removal of traffic lanes (Figure 13), narrowing traffic lanes (Figure 14), conversion of traffic lanes to bus lanes, reduction of the width of traffic lanes, reduction of traffic speeds, removal of car parking, or the reallocation of time signals (Sustrans, 2014).
Cycle Superhighway
28
Figure 14: Narrowing of traffic lanes Source: (Sustrans, 2014)
According to Heydon & Martin (2014), giving more space for cyclists means the provision of a good width to enable cycle side-by-side. The space for bicycles should have a distinct color (using colored tarmac, not painted), and need to be suitable for everyone, like the ones who cycle fast or slow, able-bodied or disabled.
In addition to that, the city of London uses the concept of “Civilized Streets” to give more comfort and priority to cyclists. This concept leads to a design that creates cycle-friendly streets through area-wide improvements and as a consequence of traffic calming.
According to Transport for London (2014), every transportation and transit design project should follow some guiding principles in order to ensure the quality of the cycling infrastructure, as described in Table 6.