UNIVERSIDADE FEDERAL DE UBERLÂNDIA INSTITUTO DE GENÉTICA E BIOQUÍMICA
PÓS-GRADUAÇÃO EM GENÉTICA E BIOQUÍMICA
MAPEAMENTO E VALIDAÇÃO DE LOCI DE CARACTERES QUANTITATIVOS
(QTL) PARA RESISTÊNCIA A Cercospora zeae-maydis EM MILHO TROPICAL
(Zea mays L.)
ALUNO: Gilberto Pozar
Orientador: Prof. Dr. Julio Cesar Viglioni Penna
Co-Orientador: Dr. Heyder Diniz Silva
Tese apresentada à Universidade Federal de Uberlândia como parte dos requisitos para obtenção do Título de Doutor em Genética.
Palavras-chave: Loci de Caracteres Quantitativos (QTL em inglês); Linhagens Quase Isogênicas (LQI); Híbridos Quase Isogênicos (HQI); Mapeamento de QTL; Validação de QTL; Epistasia
Dados Internacionais de Catalogação na Publicação (CIP)
P893m Pozar, Gilberto, 1954-
Mapeamento e validação de loci de caracteres quantitativos (QTL) para resistência a Cercospora zeae-maydis em milho tropical (Zea mays L.) / Gilberto Pozar . - 2007.
61 f. : il.
Orientador: Julio César Viglioni Penna. Co-orientador: Heyder Diniz Silva.
Tese (doutorado) - Universidade Federal de Uberlândia, Programa de Pós-Graduação em Genética e Bioquímica.
Inclui bibliografia.
1. Milho – Melhoramento genético - Teses. I. Penna, Julio César Vi- glioni. II. Universidade Federal de Uberlândia. Programa de
Pós-Gra-duação em Genética e Bioquímica. II. Título.
CDU: 633.15:631.52
UNIVERSIDADE FEDERAL DE UBERLÂNDIA INSTITUTO DE GENÉTICA E BIOQUÍMICA PÓS-GRADUAÇÃO EM GENÉTICA E BIOQUÍMICA
MAPEAMENTO E VALIDAÇÃO DE LOCI DE CARACTERES QUANTITATIVOS
(QTL) PARA RESISTÊNCIA A Cercospora zeae-maydis EM MILHO TROPICAL
(Zea mays L.)
ALUNO: Gilberto Pozar
COMISSÃO EXAMINADORA
Presidente: Julio Cesar Viglioni Penna (Orientador)
Examinadores:
___________________________________
___________________________________
___________________________________
___________________________________
Data da Defesa: ______ /_____ /______
As sugestões da Comissão Examinadora e as Normas PGGB para o formato da Dissertação/Tese foram contempladas
Dedicatória
Ao meu neto Lorenzo,
Agradecimentos
A Lourdes – pela paciência sem limites
Ao Dr. David Butruille – meu guru intelectual
Ao Dr. Heyder Diniz Silva – pelos ensinamentos e participação
Ao Dr. Júlio Penna – pelas sugestões, revisão e amizade
Ao Dr. Rogério Alves Andrade – pelas valiosas discussões
Ao Dr. Luíz Ricardo Goulart – por abrir as portas e pela amizade
A Monsanto em nome do Dr. Manuel Oyervides e Eng. Agr. Humberto Gutierrez – pela possibilidade e incentivo
A Eng. Agr. Ivani Pozar Otsuk sugestões nas análises estatísticas.
Ao Dr. John Schoper, Dra. Zoe Mccuddin e Dr. Mike Kerns – pela valiosa colaboração e revisão
Aos docentes do Depto de Genética e Bioquímica – pela compreensão
ÍNDICE
APRESENTAÇÃO ... 1
CAPÍTULO 1 ... 3
1 1.. FUNDAMENTAÇÃO TEÓRICA ... 3
1 1..11.. Mapeamento de QTLs de resistencia a C. zeae-maydis e sua interação com o ambiente ... 3
1 1..22.. Base genética da resistencia a C. zeae-maydis ... 7
1 1..33.. Influência do patógeno na interação QTL x ambiente ... 8
1 1..44.. Validação dos QTLs de resistência por meio do uso de Linhagens Quase Isogênicas ... 10
1 1..55.. Referencias bibliográficas... 12
CAPÍTULO 2 ... 16
2 2.. MAPPING AND VALIDATION OF QUANTITATIVE TRAIT LOCI FOR RESISTANCE TO Cercospora zeae-maydis INFECTION IN TROPICAL MAIZE ... 16
RESUMO ... 17
ABSTRACT ... 18
2 2..11..INTRODUCTION ... 19
2 2..22..MATERIALS & METHODS ... 21
2.2.1. QTL mapping ... 21
2.2.1.1. Generation and evaluation of the segregating population .... 21
2.2.1.2. C. zeae-maydis Severety Evaluation ... 21
2.2.1.3. Genotyping of F2:3 progenies ... 22
2.2.1.4. Construction of linkage groups and QTL mapping ... 22
2.2.1.5. QTL x environment interaction ... 23
2.2.2. Production and evaluation of the NILs ... 23
2.2.2.1. Backcross program. ... 23
2.2.2.2. Evaluation of NILs ... 24
2.2.2.3. Statistical analysis ... 24
2
2..33..RESULTS ... 27
2.3.1. QTL mapping for C. zeae-maydis resistance ... 27
2.3.1.1. Incidence of C. zeae-maydis ... 27
2.3.1.2. Linkage groups ... 27
2.3.1.3. QTL mapping results ... 27
2.3.1.4. Epistatic Interactions ... 28
2.3.1.5. QTL x location interaction ... 28
2.3.2. Evaluation of the NILs ... 28
2.3.2.1. NIL genotypes ... 28
2.3.2.2. Estimate of individual and epistatic QTL effects ... 29
2.3.3. Evaluation of the NIHs ... 30
2.3.3.1. Effect of QTL on C. zeae-maydis incidence ... 30
2.3.3.2. QTL effects on grain moisture ... 30
2.3.3.3. QTL effects on stalk lodging ... 30
2.3.3.4. QTL effects on grain yield ... 30
2 2..44..DISCUSSION ... 32
2 2..55..CONCLUSÕES ... 37
2.5.1. Mapeamento dos QTL de resistência a C. zeae-maydis ... 37
2.5.2. Avaliação das Linhagens Quase Isogênicas (LQIs) ... 37
2.5.3. Avaliação dos Híbridos Quase Isogênicos (HQIs) ... 38
2
2..77..TABELAS E FIGURAS ... 44
TABLE 1 – Cercospora zeae-maydis resistant QTL mapped by the Multiple Interval Mapping method, based on phenotypic evaluation of disease incidence using 1-to-9 score scale at four locations, under natural disease occurrence. 2001/02 growing season. ... 44
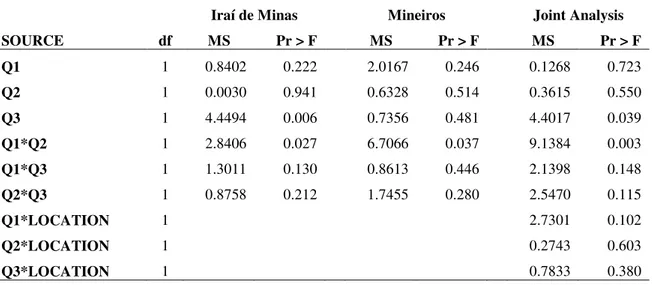
TABLE 2 – ANOVA for the incidence of C. zeae-maydis based on the 1-to-9 scale, evaluated by Near Isogenic Lines. Iraí de Minas and Mineiros – 2002/2003 growing season. ... 45
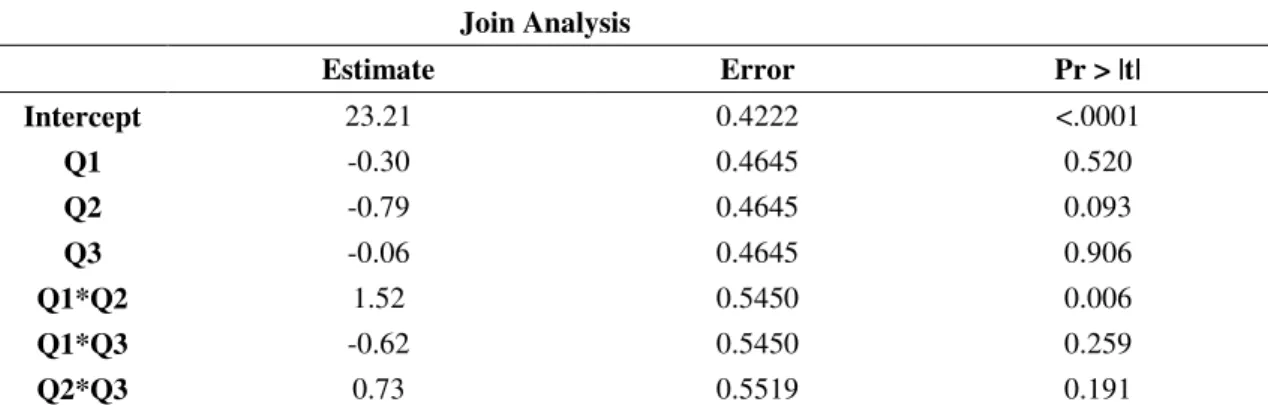
TABLE 3 – Estimates of the effects of the QTL for C. zeae-maydis resistance based on the 1-to-9 scale, obtained by regression analysis through the evaluation of the Near Isogenic Lines. Iraí de Minas and Mineiros – 2002/2003 growing season. ... 46
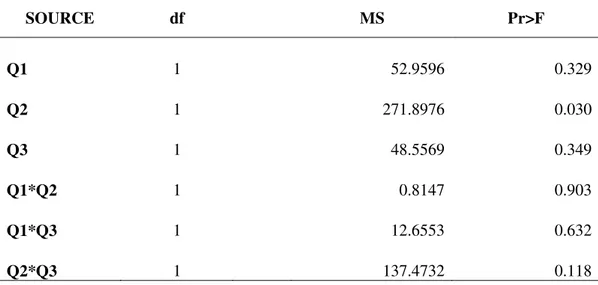
TABLE 4 – ANOVA for the incidence of C. zeae-maydis based on the 1-to-9 scale, evaluated by Near Isogenic Hybrids. Iraí de Minas and Mineiros – 2004/2005 growing season. ... 46
TABLE 5 – ANOVA for Grain Moisture at harvest evaluated by Near Isogenic Hybrids. Iraí de Minas and Mineiros – 2004/2005 growing season. ... 47
TABLE 6 – Estimates of the effects of the QTL for C. zeae-maydis resistance on Grain Moisture, obtained by regression analysis by Near Isogenic Hybrids evaluation. Iraí de Minas and Mineiros – 2004/2005 growing season. ... 47
TABLE 7 – ANOVA for stalk lodging evaluated by Near Isogenic Hybrids. Iraí de Minas and Mineiros – 2004/2005 growing season. ... 48
TABLE 8 – ANOVA for grain yield corrected for 15.5% moisture, evaluated by Near Isogenic Hybrids. Iraí de Minas and Mineiros – 2004/2005 growing season. ... 48
TABLE 9 – ANOVA for grain yield corrected for 15.5% moisture, evaluated by Near Isogenic Hybrids. Iraí de Minas and Mineiros – 2004/2005 growing season. ... 49
FIGURE 1 - Esquema resumido mostrando passo a passo o mapeamento dos QTL de resistência a C. zeae-maydis e o desenvolvimento das Linhagens e Híbridos Quase Isogênicos (LQIs e HQIs) ... 51
FIGURE 2 – Single Marker Analysis Mapping Results showing the markers, Pr(F), distance (cM) and bin for the 10 chromosomes; and genotype of the two progenies selected for the backcrossing program Subject ……….. 52
FIGURE 3 – Near Isogenic Lines (NIL) genotype, genotype code, number of NIL evaluated per genotype and average percentage of recurrent parent recovered in the NIL ... 53
APRESENTAÇÃO
O milho (Zea mays L.) foi cultivado em 13,6 milhões de hectares no Brasil na safra 2006/2007 (CONAB, 2007). A ampla exposição da cultura aos mais variados estresses edafo-climáticos e biológicos, torna improvável que o potencial genético máximo para produtividade de grãos seja atingido por qualquer cultivar híbrida, mesmo que altamente adaptada, qualquer que seja o sistema de produção adotado.
As últimas duas décadas foram marcadas por profundas modificações na tecnologia de produção utilizada no Brasil. Dentre elas, o aumento da área de safrinha e de plantio direto provocaram grande alteração na dinâmica de dispersão das doenças. Se por um lado a safrinha permite o aumento da renda dos agricultores pelo uso mais intensivo do solo e se tornou prática amplamente difundida e incorporada no sistema de produção de várias regiões, por outro tem favorecido o aumento da severidade de doenças que encontram condições favoráveis para se desenvolver durante o ano todo. O plantio direto, uma importante prática de conservação do solo e largamente difundida no país, pode também favorecer o aumento do potencial de inoculo dos patógenos que sobrevivem nos restos da cultura anterior deixados sobre a superfície do solo.
de 80 e do complexo de enfezamento do milho (“corn stunt” e “maize bushy stunt”) na década de 90.
A partir de 2000, a cercosporiose do milho, causada pelo fungo Cercospora zeae-maydis (Cz), de ocorrência endêmica na forma de pequenas e esparsas lesões foliares, começou a assumir proporções epidêmicas em várias regiões do país. Esta doença foi responsável pela descontinuidade de vários híbridos comerciais suscetíveis de alto potencial produtivo, que chegaram a atingir níveis de até 60% de redução na produtividade de grãos. Hoje, a incorporação de resistência genética a Cz está entre os principais objetivos dos programas de desenvolvimento de híbridos para as regiões onde essa doença é prevalente.
CAPÍTULO 1
1. FUNDAMENTAÇÃO TEÓRICA
1.1. Mapeamento de QTL de resistência a Cercospora zeae-maydis e sua interação com o ambiente
A maior parte das pesquisas de mapeamento de QTL de resistência a Cz foram conduzidas em ambiente de clima temperado (EUA – Estados Unidos da América) ou sub-tropical (RAS – República da África do Sul) (Bubeck et al, 1993; Saghai-Maroof et al, 1996; Clements et al, 2000; Gordon et al, 2004; Lehmensiek et al, 2001). Apenas a pesquisa de Pedrosa (2002) foi conduzida em ambiente tropical (Brasil).
No decorrer dessa pesquisa, para a caracterização dos QTL adotou-se como medida da magnitude do seu efeito, a proporção da VFT explicada por ele, a qual corresponde aos valores de R2. Assim, QTL de grande efeito (“major QTL”) são aqueles cujo efeito explica mais de 10% da VFT e os de pequeno efeito (“minor QTL”), menos de 10%. Outra nomenclatura usada para descrever o QTL é a que se refere à sua consistência ou estabilidade através de ambientes. QTL consistentes normalmente são os de grande efeito mapeados em todas ou na maioria dos ambientes de teste. Os inconsistentes normalmente são os de pequeno efeito e são ambientalmente sensíveis (Collard et al, 2005).
Va14, NC250A e ADENT. Bubeck et al (1993) mapeou um QTL em uma região próxima desta no bin 1.03/1.04, mas que não foi consistente através dos ambientes. Um QTL consistente através de três ambientes tropicais também foi mapeado nesse cromossomo (Pedrosa, 2002), mas não se pode inferir sobre a sua localização já que os marcadores utilizados não foram apresentados. Gordon et al (2004) não detectaram QTL nessas regiões em nenhum dos dois ambientes de avaliação, EUA e RAS.
No cromossomo 4, Saghai-Maroof et al (1996) e Gordon et al (2004) mapearam um QTL consistente nos bins 4.05 e 4.08, que representaram 9 a14% e 20 a 24% da VFT, respectivamente. Bubeck et al (1993) também detectou esse QTL no bin entre 4.05 e 4.07, que embora tenha sido considerado inconsistente, apresentou efeito bastante pronunciado em dois dos três ambientes de avaliação, e explicou até 20% da VFT. As pesquisas de Clements et al (2000) Lehmensiek et al (2001) e Pedrosa (2002) não mapearam QTL nessas posições.
No cromossomo 2, Bubeck et al (1993) e Clements et al (2000) mapearam QTL bem próximos, nos bins 2.04 e 2.06, que explicaram 9% e 14% da VFT, respectivamente. Gordon et al (2004) também mapeou um QTL nesse cromossomo entre os bins 2.08 e 2.09, com efeito, bastante pronunciado, que explicou de 20 a 23% da VFT. Esses dados sugerem que as linhagens 061, NC250A e ADENT compartilham essa região genômica (Clements e White, 2000). Um QTL no braço curto do cromossomo 2 também foi mapeado por Saghai-Maroof et al (1996), mas não foi consistente através dos ambientes. Assim, Va14 parece não compartilhar a mesma região genômica do cromossomo 2 das outras linhagens (Clements e White, 2000). Nas pesquisas de Lehmensiek et al (2001) e Pedrosa (2002), essas regiões não foram associadas com QTL.
sua significância no cromossomo 5 provavelmente não é o resultado de um falso positivo. Pedrosa (2002) também mapeou um QTL inconsistente no cromossomo 5, mas não se pode inferir quanto a sua localização.
No cromossomo 7, Clements et al (2000) mapeou um QTL consistente no bin 7.01, que respondeu por 5 a 11% da VFT. Bubeck et al (1993) o detectou na população com a linhagem NC250A, mas não com a ADENT. Clements e White (2000) argumentam que as linhagens 061 e NC250A provavelmente apresentam uma região comum no cromossomo 7, compartilhando genes de resistência que são diferentes dos identificados nas linhagens Va14 e ADENT. Nenhuma outra pesquisa detectou associações significativas nesse cromossomo.
No cromossomo 8, Saghai-Maroof et al (1996) mapearam um QTL consistente localizado no bin 8.06 que contribuiu com 8 a 11% da VFT. Esse mesmo QTL também foi identificado na posição bin 8.05 por Bubeck et al (1993) e Clements et al (2000), mas se mostrou inconsistente nessas pesquisas. Esse QTL foi responsável pela resposta tardia à infecção observada por Clements et al (2000).
Outros QTL inconsistentes foram mapeados nos cromossomos 3 (Bubeck et al, 1993, Clements et al, 2000, e Lehmensiek et al, 2001) nos bins entre 3.04/3.05 e 3.07, e nos cromossomos 6 (Bubeck et al, 1993 e Clements et al, 2000), 9 e 10 (Bubeck et al, 1993) nos bins 6.05/6.08, 9.01 e 10.06/10.07, respectivamente.
utilizado, é plausível assumir que se trata também de germoplasma tropical ou com alta percentagem de germoplasma tropical.
Wisser et al (2006) consolidaram o mapa de consenso para diversas doenças de milho baseados em pesquisas publicadas até julho de 2005. No caso específico de Cz, os resultados foram baseados nas pesquisas de Lehmensiek et al (2001), Saghai-Maroof et al (1996), Bubeck et al (1996), Clements et al (2000) e Gordon et al (2004). Baseados em várias premissas entre as quais a de que todos os QTL declarados nas diversas pesquisas foram considerados sem levar em conta a magnitude dos seus efeitos (proporção da VFT explicada), e de que foram construídos intervalos de confiança de 95% baseados no marcador molecular de maior significância determinaram a ocorrência de QTL nos segmentos entre os bin 1.02 a 1.08, 2.01 a 2.09, 3.04 a 3.09, 4.03 a 4.09, 5.03 a 5.06, 6.01 a 6.05; 7.01 a 7.05, 8.01 a 8.06, 9.01 e 9.03, e 10.03 a 10.06. Considerando que os cromossomos de 1 a 10 tem 12, 10, 10, 11, 9, 8, 6, 9, 8 e 7 bins, respectivamente, e que cada bin mede em média 20 cM, estima-se que essa amplitude representa em média 62,4% do genoma. Para os autores, a larga distribuição dos QTL dentro do genoma pode refletir tanto a baixa precisão e exatidão no mapeamento, como o grande número de genes envolvidos na interação patógeno x hospedeiro, uma vez que genes de resistência podem ser condicionados por genes que afetam o crescimento e desenvolvimento da planta.
1.2. Base genética da resistência a C. zeae-maydis
(1993), Clements et al (2000) e Lehmensiek et al (2001), para os QTL mapeados nos cromossomo 1 e 2 por Shagai Maroof et al (1996) e no cromossomo 4 por Gordon et al (2004). Ação gênica recessiva foi observada por Shagai Maroof et al (1996) para o QTL mapeado no cromossomo 8 e para o do cromossomo 4 mapeado por Gordon et al (2004). Ação gênica dominante foi observada por Shagai Maroof et al (1996) para o alelo do QTL mapeado no cromossomo 4 originado do parental suscetível B73. Esse QTL é o mesmo mapeado por Gordon et al (2004) ocupando exatamente a mesma posição no cromossomo, bin 4.08, com ação gênica dominante, porém nesse caso, se originou do parental resistente VO613Y. Em resumo, a ação gênica aditiva prevaleceu em todas as pesquisas realizadas.
Com relação a avaliação de efeitos epistáticos entre QTL, Clements et al (2000) detectaram epistasia entre os QTL mapeados no cromossomo 1 e 4. Shagai-Maroof et al (1996) verificaram que o QTL mapeado no cromossomo 4 da linhagem B73 tinha pouco ou nenhum efeito quando o QTL no cromossomo 1 era homozigoto para o alelo da linhagem Va14. Calborg & Haley (2004) discutem sobre a pouca ênfase dada pelas pesquisas em geral, na detecção de epistasia entre QTL. Segundo esses autores, o nível de estringência usado nas pesquisas de mapeamento de QTL para se evitar o erro tipo I, ou seja, evitar falsos positivos, é muito alto. Assim, somente QTL de grande efeito são considerados, aumentando-se o risco de que os locos individuais de menor efeito não sejam detectados, ou que efeito dos QTL mapeados seja severamente viesado.
1.3. Influência do patógeno na interação QTL x ambiente
idênticos produzidos pelos dois grupos (Dunkle e Carson, 1999), e de 35% no Brasil, avaliada pelo coeficiente de Dice (Brunelli, 2004). O grupo II se caracteriza por apresentar taxa de crescimento mais lenta e por não produzir cercosporina em meio de cultura quando comparada ao grupo I (Dunkle & Levy, 2000; Brunelli, 2004). Existe ainda predominância de um grupo sobre o outro de acordo com a geografia considerada. O grupo I é o mais prevalente nos EUA (Dunkle & Levy, 2000) e no Brasil (Brunelli, 2004). Comparações entre isolados dos EUA e África mostraram a ocorrência do grupo II naquele continente (Dunkle & Levy, 2000), e no Brasil esse grupo parece ser predominante no estado de Goiás (Brunelli, 2004).
Apesar das diferenças genéticas observadas entre os grupos I e II e da existência de uma amplitude de agressividade dentro de cada grupo, nenhum estudo encontrou diferenças que pudessem separá-los como duas raças fisiológicas diferentes, baseados na ausência de resposta diferencial de hospedeiros a esses grupos (Dunkle e Carson, 1999 e Gordon et al, 2004).
Thompson et al (1987) comentam sobre a estabilidade da resistência de linhagens antigas através dos anos. Apesar disso, a avaliação de híbridos através de ambientes normalmente tem indicado interação genótipo x ambiente significativa. No entanto, grande parte da interação parece ser devida ao aumento de magnitude nas diferenças entre os genótipos (interação simples) mais do que mudança na sua ordem relativa, principalmente para aqueles genótipos de resistência intermediária nos locais onde os níveis de doenças são mais altos (Carson et al, 2002). A não mudança no sinal dos efeitos aditivos através dos ambientes é uma indicação de que nas interações QTL x ambiente, estão associadas mudanças na magnitude e não na classificação relativa dos QTL (Clements et al, 2000). Brunelli (2004) hipotiza também a possibilidade de variação na expressividade dos fatores de resistência nos diversos ambientes.
experimental. Para genótipos de reação intermediária, a influência de parcelas adjacentes ainda é maior, o que pode contribuir grandemente para a interação QTL x ambiente. Uma característica do patógeno que pode estar relacionada com a influência de parcelas pareadas é o fenômeno da conidiação microcíclica, que é a formação de esporos secundários sem a fase vegetativa intermediária, a partir da germinação de um conídio, normalmente após um estresse ambiental (Lapaire & Dunkle, 2003). Esses conídios são facilmente dispersos dentro de um campo de milho por pequenas turbulências de ar (Meredith, 1973). Vinte e seis por cento dos isolados pertencentes ao grupo I de Cz estudados por Brunetti (2004) apresentaram conidiação microcíclica. Isolados do grupo II não apresentaram essa característica.
A época de avaliação da doença é outra variável a ser considerada no mapeamento de QTL. Bubeck et al (1993) constatou que o aumento no número de dias entre duas avaliações para Cz diminuiu a correlação entre elas, indicando que genes diferentes podem agir no início e final do processo da doença. Clements et al (2000) mapeou QTL associados à resistência em uma avaliação duas semanas após o florescimento, nos cromossomos 3 (marcador asg10, bin = 3.07), 6 (npi373, bin = 6.05) e 7 (umc113, bin = 7.02), e quatro a cinco semanas após o florescimento, nos cromossomos 3 (umc102, bin = 3.05), 4 (agrr321, bin = 4.06) e 8 (umc89, bin = 8.05). Essa diferença poderia ser explicada pela associação entre severidade da doença e a maturidade do genótipo. Nessa mesma pesquisa, seis QTL de resistência foram associados com a maturidade, associação que já havia sido detectada por Bubeck et al (1993), Coates & White (1998) e Saghai Maroof et al (1996).
1.4. Validação dos QTL de resistência por meio do uso de Linhagens Quase Isogênicas (LQI)
detectaram epistasia entre dois QTL quando baseados em estimativas a partir de populações F2, mas por meio de teste específico delineado para essa finalidade,
concluíram que os efeitos epistáticos foram superiores aos efeitos individuais de cada QTL.
A determinação da função do QTL é fundamental para maximizar o ganho genético e a otimização de recursos disponíveis. Várias regiões do genoma do milho são duplicadas e portanto, QTL podem estar duplicados. Os bins 1.06/1.07 são duplicações da região próxima aos bins 9.04/9.05 (McMullen & Simcox, 1995). Embora QTL para resistência a Sethosphaeria turcica tenham sido mapeados nessas duas regiões, não foram detectados nas três populações avaliadas por Welz & Geiger (2000), sugerindo que não se trata do mesmo QTL. Também a região cromossômica bin 8.05/8.06 é homoeóloga das regiões 3.06/3.07 e 5.06/5.07 (McMullen & Simcox, 1995). Muitos probes de DNA da região bin 8.05/8.06 se hibridizaram nas regiões 3.06/3.07 e 5.06/5.07 nas três populações estudadas por Welz & Geiger (2000), e como os QTL mapeados nessas regiões apresentaram a mesma magnitude de efeitos, os autores concluíram que esses resultados sugerem a origem comum desses QTL, e portanto, a mesma função (Welz & Geiger, 2000). Duplicação de QTL também foi observado em soja (Lee et al, 1999).
2000). McMullen & Simcox (1995) especulam sobre a existência de um significado funcional no agrupamento de genes de resistência a doenças, ou se é uma conseqüência da organização do genoma. Esses genes poderiam representar famílias envolvidas em um sinal de transdução ou outros passos que levam a uma interação incompatível entre patógenos e hospedeiro, ou ainda poderiam representar arranjamentos ancestrais de genes de resistência que foram selecionados durante a evolução. Os autores ainda chamam a atenção para o fato de que os grupamentos (“clusters”) nos cromossomos 1 e 3 estão próximos da região do centrômero, enquanto que do cromossomo 6, está próximo da região organizadora do nucléolo. Essas regiões são supressoras de recombinação e portanto com potencial reduzido de recombinação, podendo formar blocos de ligação. Como nos programas de melhoramento em regiões tropicais a obtenção de resistência múltipla é fundamental, a combinação não só de diferentes QTL’s de resistência para a mesma doença, como também para doenças diferentes deve ser considerada.
1.5. Referências bibliograficas
Bernacchi, D., T. Beck-Bunn, Y. Eshed, J. Lopes, V. Petiard, J. Uhlig, D. Zamir &S. Tanksley. 1998. Advanced backcross QTL analysis in tomato. I.Identification of QTL for traits of agronomic importance from Lycopersicon hirsutum. Theor. Appl. Genet. 97:381-397.
Bruneli, K.R. Cercospora zeae-maydis: Esporulação, diversidade morfo-genética e reação de linhagens de milho. Piracicaba, 2004. 105 p. Tese de doutorado. Escola Superior de Agricultura “Luíz de Queiróz”.
Bubeck, D.M., M.M. Goodman, W.D. Beavis & D. Grant. 1993. Quantitative trait loci controlling resistance do gray leaf spot in maize. Crop Sci. 33:838-847. Carlborg, O & C.S. Haley. 2004. Epistasis: too often neglected in complex trait
studies? Nature. 5: 618-625.
Carson, M.L., M.M. Goodman & S.M. Willianson. 2002. Variation in aggressiveness among isolates of Cercospora from maize as a potential cause of genotype-environment interaction in gray leaf spot trials. Plant Disease. 86:1089-1096.
Clements, M.J., J.W. Dudley & D.G. White. 2000. Quantitative trait loci associated with resistance to gray leaf spot of corn. Phytopathology. 90(9):1018-1025. Clements, M.J. & D.G. White. 2000. Genetics of gray leaf spot resistance. In:
Illinois Crop Protection Technology Conference 2000 Proceedings. p. 120-123.
Coates, S.T. & D.G. White. 1998. Sources of resistance to gray leaf spot of corn. Plant disease. 78(12): 1153-1155.
Collard, B.C.Y., M.Z.Z. Jahufer, J.B. Brouwer & E.C.K. Pang. 2005. An introduction to markers, quantitative trait loci (QTL) mapping and marker-assisted selection for crop improvement: The basic concepts. Euphytica. 142:169-196.
Donahue, P.J., E.L. Stromberg & S.L. Myers. 1991. Inheritance of reaction to gray leaf spot in a diallel cross of 14 maize inbreds. Crop Sci. 31:926-931.
Dunkle, L.D. & Carson, M.L. 1999. Genetic variation in Cercospora zeae-maydis and the potential impact on selecting for resistance to gray leaf spot of corn. Proc. 53rd Corn Sorghum Res. Conf. 53:334-346.
Dunkle, L.D. & M. Levy. 2000. Genetic relatedness of african and United States populations of Cercospora zeae-maydis. Phytopathology. 90(5):486-490. Elwinger, G.F., M.W. Johnson, R.R. Hill & J.E. Ayers. 1990. Inheritance of
resistance to gray leaf spot of corn. Crop Sci. 30:350-358.
Eshed, Y. & D. Zamir. 1996. Less-than-additive epistatic interactions of quantitative trait loci in tomato. Genetics. 143:1807-1817.
Gevers, H.O. & J.K. Lake. 1994. Diallel cross analysis of resistance to gray leaf spot in maize. Plant Disease. 78(4): 379-383.
Gordon, G.S., M. Bartsch, I. Matties, H.O. Gevers, P.E. Lipps & R.C. Pratt. 2004. Linkage of molecular markers to Cercospora zeae-maydis resistance in maize. Crop Sci. 44:628-636.
Lee, J.M., A.L. Bush, J.E. Specht & R.C. Shoemaker. 1999. Mapping of duplicate genes in soybean. Genome. 42:829-836.
Lehmensiek, A., A.M. Esterhuizen & C. van Staden. 2001. Genetic mapping of gray leaf spot (GLS) resistance genes in maize. Theor. Appl. Genet. 103:797-803.
McMullen, M.D & K.D. Simcox. 1995. Clustering of disease resistance loci in the maize genome. Maize Genetics Cooperation Newsletter. 69:52-53.
Melchinger, A.E.; H.F. Utz & C.C. Schön. 1998. Quantitative trait locus (QTL) mapping using different testers and independent populations samples in maize revels low power of QTL detection and large bias in estivates of QTL effects. Genetics 149: 383-403.
Menkir, A. & M. Ayodele. 2005. Genetic analysis of resistance to gray leaf spot of midaltitude maize inbred lines. Crop Sci. 45: 163-170.
Meredith, D.S. 1973. Significance of spore release and dispersal mechanisms in plant disease epidemiology. Annual Review of Phytopathology. 11:313-343. Pedrosa, M.G. Mapeamento genético para resistência à Cercosporiose, mancha
Saghai Maroof, M.A., Y.G. Yue, Z.X. Xiang, E.L. Stromberg & G.K. Rufener. 1996. Identification of quantitative trait loci controlling resistance to gray leaf spot disease in maize. Theor. Appl. Genet. 93(4):539-546.
Thompson, D.L., R.R. Bergquist, G.A. Payne, D.T. Bowman & M.M. Goodman. 1987. Inheritance of resistance to gray leaf spot in maize. Crop Sci. 27:243-246.
Ulrich, J.F., J.A. Hawk & R.B. Carroll. 1990. Diallel analysis of maize inbreds for resistance to gray leaf spot. Crop Sci. 30:1198-1200.
Van Berloo, R., H. Aalbers, A. Werkman & R. E. Niks. 2001. Resistance QTL confirmed through development of QTL-NILs for barley leaf rust resistance. Molecular Breeding 8:187-195.
Verma, B.N. 2001. Gray Leaf Spot Disease fo maize – Loss assessment, genetic studies and breeding for resistance in Zambia. In: Seventh Eastern and Southern Africa Regional Maize Conference. Pp. 60-65.
Welz, H.G. & H.H. Geiger. 2000. Genes for resistance to northern corn leaf blight in diverse maize populations. Plant Breeding. 119(1): 1-14.
Wisser, R.J.; P.J. Balint-Kurti & R.J. Nelson. 2006. The Genetic architecture of disease resistance in maize: A synthesis of published studies. Phytopathology. 96: 120-129.
CAPÍTULO 2
2. MAPPING AND VALIDATION OF QUANTITATIVE TRAIT LOCI FOR
RESISTANCE TO Cercospora zeae-maydis INFECTION IN TROPICAL
RESUMO
Resistência à infecção por C. zeae-maydis (Cz) está entre os objetivos mais importantes dos programas de melhoramento no Brasil. Os objetivos da presente pesquisa foram mapear e caracterizar Quantitative Trati Loci (QTL) relacionados com a resistência a Cz, validar as estimativas dos seus efeitos na severidade de Cz com uso de linhagens quase isogênicas (LQIs), e estimar os seus efeitos sobre três caracteres agronômicos importantes usando os seus respectivos híbridos quase isogênicos (HQIs), obtidos pelo cruzamento das LQIs com uma linhagem de um grupo heterótico complementar. Foram mapeados quatro QTL com LOD>2.5 dos quais três foram avaliados em LQIs. Foram avaliados dois QTL mapeados no cromossomo 1 em fase de repulsão, Q1 localizado no bin 1.05 e Q2 no bin 1.07, e um no cromossomo 3, Q3 localizado no bin 3.07. A avaliação das LQIs mostraram efeitos individuais altamente significativos para os três QTL na redução da severidade de Cz. Uma interação epistática desfavorável para a reação a Cz foi detectada entre Q1 e Q2, na qual o efeito de um dos alelos foi efetivamente anulado pelo outro. Alternativamente, a interação entre Q2 e Q3 foi positiva, promovendo a redução na severidade de Cz a um nível maior do que a soma de seus efeitos individuais. A avaliação das HQIs revelou efeitos individuais significativos para Q1 e Q3 na redução da severidade de Cz, de Q2 sobre a porcentagem de plantas quebradas e produtividade de grãos, e de Q3 sobre a porcentagem de umidade dos grãos na colheita e porcentagem de plantas quebradas. Interações epistáticas significativas foram detectadas entre Q1 e Q2 para umidade dos grãos na colheita e entre Q1 e Q3 para porcentagem de plantas quebradas. A combinação de QTL impacta na efetividade de procedimentos de seleção monitorados por marcadores em programas de melhoramento para o desenvolvimento de produtos comerciais.
ABSTRACT
Resistance to infection by Cercospora zeae-maydis (Cz) ranks among the most important objectives of breeding programs in Brazil. The objectives of this research were to map and characterize Quantitative Trait Loci (QTL) related to resistance to Cz, to validate the estimates of their effects on disease severity using Near-Isogenic Lines (NILs), and to estimate their effects on three major agronomic traits using their respective Near Isogenic Hybrids (NIHs) obtained by crossing the NILs with an inbred of complementary heterotic pool. Four QTL with LOD values > 2.5 were mapped using the Multiple Interval Mapping approach. Three of them were evaluated in this study. NILs genotype included the two QTL allele located in chromosome 1 in repulsion phase, Q1 in bin 1.05 and Q2 in bin 1.07, and one in chromosome 3, Q3 in bin 3.07. NIL evaluation showed that individually, the three QTL significantly reduced the severity of Cz. An unfavorable epistatic interaction for the reaction to Cz was detected between Q1 and Q2, in which one QTL allele effectively nullified the effect of the other. Alternatively, the interaction between Q2 and Q3 was positive, promoting the reduction of the severity to a greater extent than the sum of their individual effects. NIH evaluation revealed significant individual effects for Q1 and Q3 on Cz severity, for Q2 on stalk lodging and grain yield, and for Q3 on grain moisture and stalk lodging. Significant epistatic interactions were also detected between Q1 and Q2 for grain moisture and between Q1 and Q3 for stalk lodging. The combination of QTL impacts the effectiveness of marker-assisted selection procedures in commercial product development programs.
2.1. INTRODUCTION
Approximately 8.5 million hectares are cultivated with hybrid maize (Zea mays L.) in Brazil (http://www.conab.gov.br/). The maize growing area is located between 10 and 30 degrees south. Environmental conditions vary from tropical to sub-tropical where the required level of defensiveness to produce profitable grain yields is much higher than in temperate growing areas. An important component of the needed defensiveness is adequate resistance to diseases. For commercial companies, an important reason for removing commercial hybrids from the seed market is the outbreak of new diseases or the presence of preexisting physiological races. This disease pressure is caused by alterations in the pathogen dispersion dynamic, which can be due to the utilization of susceptible hybrids, to changes in the cropping system or both.
The pathogenic fungus Cercospora zeae-maydis Tehon & E. W. Daniels (Ward et al 1999) (Cz) began to assume epidemic proportions in various regions of Brazil starting in 2000, with predominance in highlands, altitude above 700 m, located at Mato Grosso, Goiás and Minas Gerais states. It was responsible for the discontinuance of several high-yielding but susceptible hybrids. Currently, the incorporation of resistance to infection by Cz ranks among the most important objectives of hybrid development programs and the utilization of molecular markers has led to the mapping and characterization of several Quantitative Trait Loci (QTL) related to its resistance.
resistance to Cz used in this analysis were those reported by Bubeck et al (1996), Saghai-Maroof et al (1996), Clements et al (2000), Lehmensiek et al (2001) and Gordon et al (2004). Based on those results, it can be estimated that these QTL covered about 60% of the maize genome. According to Wisser et al (2006), this high level of coverage of the maize genome to a certain extent reflects both the low precision and accuracy of QTL mapping, as well as the large number of loci involved in the genotype x host interaction. The genotype x host interaction includes genes related to the plant development that can impact resistance. Moreover, epistatic interactions among QTL have not been effectively exploited either in basic mapping research or in MAB. When one utilizes a very high degree of stringency for QTL detection, it is unlikely that epistatic interactions among minor effect QTL can be detected (Carlborg & Haley, 2004) or even considered for MAB. Thus, the validation of QTL becomes necessary to maximize genetic gains and to make feasible the use of available resources in MAB.
2.2. MATERIALS & METHODS
2.2.1. QTL mapping
2.2.1.1. Generation and evaluation of the segregating population.
During the 2001 growing season, 187 testcrosses of F2:3 progenies derived from a
cross of two Monsanto inbred lines contrasting for reaction to Cz, MON323 (37.5% Tropical Dent, 62.5% Stiff Stalk) and MON402 (100% Tropical Flint), were evaluated at 4 locations: Iraí de Minas–MG (951m altitude, 19o00’S and 47o05’W) as summer (s) and winter crops (w), (IR_s and IR_w, respectively), Montividiu–GO (821m altitude, 17o04’S and 51o02’W) (MV_s), and Jataí–GO (708m altitude; 17o52’S and 51o42’W) (JT_s), the last two locations as summer crops. The tester was a Full Tropical Flint inbred line, but unrelated to MON402. The experimental design utilized consisted of a completely randomized block with two replications. The plots were comprised of two 5 m long rows. Both sowing and harvesting were mechanical. Soil fertilization was attained with 45 kg ha-1 N, 80 kg ha-1 P2O5 and
100 kg ha-1 K
2O, and side dressing of 138 kg ha-1 N applied 30 days after sowing
(DAS). Weed control was accomplished with the spraying of 3 L ha-1 of a mixture
of the herbicides atrazine (200 g L-1) and metalachlor (300 g L-1).
2.2.1.3. Genotyping of F2:3 progenies. Genotyping involved the removal of leaf tissue samples from 10 plants for each F2:3 progeny within the
isolated detasseled corn plots used for synthesis of the top-crosses. DNA extraction followed the methodology presented by Dellaporta & Hicks (1983).
DNA was quantified by diluting 20 µL of DNA solution in 980 µL of TE 0.1x in a spectrophotometer. The material was then prepared for PCR amplification for either SSR or SNP markers. SSR markers were individually amplified using PCR and marker genotype was visualized using electrophoresis in 2.8% agarose gel (3:1 Metaphor® agarose (Cambrex Corporation): UltraPureTM Agarose 1000 (Invitrogen), with 2 L EtBr (ethidium bromide), TBE 1x buffer, at 160-170V for 3 to 3.5 h. An extra amount of EtBr (8 L) was added to the TBE in the electrophoresis bowl at the positive pole for contrasting. SNP markers were genotyped using the ABI Prism 7700 Sequence DetectionSystem (TaqMan®), available from Applied Biosystems, Foster City, California, per manufacturer’s specifications. A total of 138 markers were used: 68 SSR (Single Sequence Repeats) and 70 SNP (Single Nucleotide Polymorphisms) distributed in numbers of 30, 12, 16, 15, 12, 10, 13, 11, 13 and 6 markers amongst chromosomes 1 through 10, respectively.
QTL mapped within a distance of 20 cM whose additive effects had the same signal, were declared as same locus (Melchinger et al, 1998).
2.2.1.5. QTL x environment interaction. The interaction between QTL and environment was evaluated adapting the linear regression model proposed by Eberhart & Russel (1966) to evaluate the stability of genotypes, using the additive effects of the markers associated with the QTL.
2.2.2. Production and evaluation of the NILs
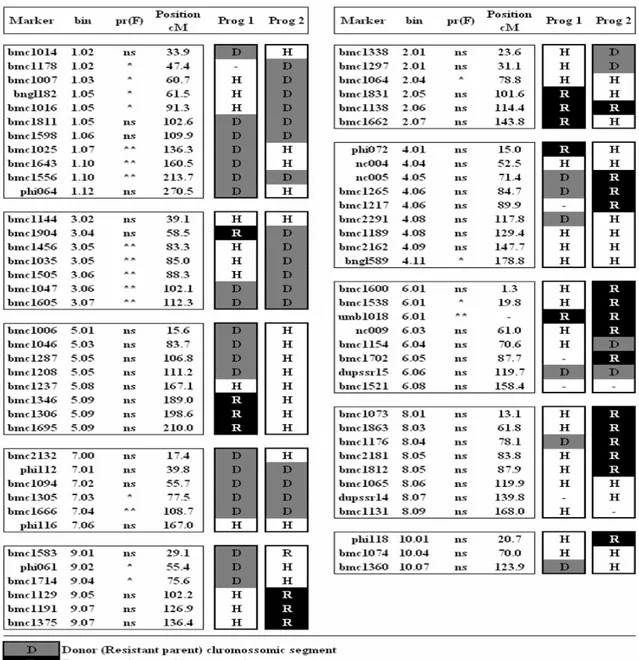
2.2.2.1. Backcross program. Production of the NILs began with a preliminary mapping through Single Marker Analysis (SMA) and using only SSR markers (Figure 2). Markers presenting the lowest p-value were located in chromosome 1, bmc1007 (bin 1.03) and bmc1643 (bin 1.10); chromosome 2, bmc1064 (bin 2.04); chromosome 3, bmc1456 and bmc1035, both in bin 3.05, and bmc1505 and bmc1047, both in bin 3.06; chromosome 4, bnlg589 (bin 4.11); chromosome 6, umc1018 (bin 6.01); chromosome 7, bmc1666 (bin 7.04); and in chromosome 9, bmc1714 (bin 9.04). The region of resistance associated to marker bmc1007 in chromosome 1 originated from the susceptible parent. All the others originated from the resistant parent. Of the 187 F2:3 progenies evaluated, two were
selected as the most promising to initiate the BC program (Figure 2). In the summer of 2001, the F3BC1 generation was synthesized by backcrossing the
selected progeny to the susceptible (recurrent) parent. The chromosomal regions selected were the two from chromosome 1 and those located on chromosomes 2, 3 and 7, which were confirmed as linked to Cz resistance by Multiple Interval Mapping approach.
In the winter of 2002, the F3BC1 generation was planted in a nursery and
genotyped. The segregating plants were selected for the genotype of the donor parent (resistant) in the chromosomal regions encompassed by the mapped QTL, while for the other regions, the selection of markers was for the recurrent parent (susceptible). In the end of the process, the F3BC2 plants were selfed and 1417
purposes at the chromosomal regions recovered by BC with 5, 2, 3 and 2 SNP (Single Nucleotide Polymorphism) markers in chromosomes 1, 2, 3 and 7, respectively. The QTL regions in chromosomes 2 and 7 were not considered in the NILs selection because they did not present segregates with QTL combinations suitable for the objectives of this research.
2.2.2.2. Evaluation of NILs. In the summer of 2002, 18 NILs, carrying all QTL combinations (000 to 111 for Q1,Q2, and Q3) (Figure 3), were evaluated per se for Cz reaction in Mineiros–GO and Iraí de Minas–MG. The experimental design used was a complete randomized block (CRD) with three replications in a 3x2 factorial scheme (three QTL, presence and absence). Planting was done mechanically and the plots comprised of one 3m-long row. Spacing among rows was 0.8 m and planting density was 90,000 plants ha-1. The same amount of nutrients was applied as for the top-crosses. At every two plots, a row of a highly susceptible inbred was intercalated for ease of disease dissemination, so that each experimental plot was paired with the disseminating inbred line. This inbred was also used as a border row, at both sides of the experiment. The severity of Cz was evaluated at 99 DAS in Mineiros and at 95 DAS in Iraí, both based on the 1-to-9 scale. Each genotype was represented by two to three NILs. Due to the high natural incidence of the pathogen, artificial inoculation was not required at any locality.
2.2.2.3. Statistical analysis. SAS 9.1 proc GLM was used to run the statistical analysis.The model used for the analysis was:
ij i i i
i i
i i
i i
j
ij b Q Q Q Q xQ Q xQ Q xQ e
y =µ+ +β1 1 +β2 2 +β3 3 +β4( 1 2 )+β5( 1 3 )+β6( 2 3)+
in which:
yij is the value observed in the j-th repetition (j=1,2,3) of the NIL i (i=1,2...18);
bj is the effect of the repetition j;
βk are the individual effects of the QTL and of the epistatic interactions between
them;
Qki are the “dummy” variables indicating the presence or absence of the QTL k
(k=1,2,3) in the NIL i (i=1,2..18); and
eij is the random error associated to the observation yij, eij ~N(0,σ2). All the other
parameters were considered as fixed.
For the joint analysis of the data, the following fixed model was used:
ija a i i a i i a i i a i a i a i i i i i i i i i i a j a ija e xl xQ Q xl xQ Q xl xQ Q xl Q xl Q xl Q xQ Q xQ Q xQ Q Q Q Q l b l y + + + + + + + + + + + + + + + = ) ( ) ( ) ( ) ( ) ( ) ( ) ( 3 2 12 3 1 11 2 1 10 3 9 2 8 1 7 3 2 6 3 1 5 2 1 4 3 3 2 2 1 1 β β β β β β β β β β β β µ in which:
yija is the value observed in the j-th repetition (j=1,2,3) of the NIL i (i=1,2...18), at
location a (a=1,2);
la is the effect of location a;
bj(la) is the effect of repetition j in location a;
µ is a constant inherent to all the observations;
βk are the effects of the individual QTL and of the epistatic interactions between
them;
Qki are the “dummy” variables indicating the presence or absence of the QTL k
(k=1,2,3) in the NIL i (i=1,2..18); and
eija is the random error associated to the observation yija, eij ~ N(0,σ2).
2.2.3. Production and evaluation of the NIHs
Cz per se, displays a neutral behavior in hybrid combinations, with the reaction of the hybrids depending on the level of susceptibility of the other parental line. It is also resistant to Phaeosphaeria maydis (Henn.) Rane, Payak, & Renfro (anamorph = Phoma maydis, synonym = Leptosphaeria zeae-maydis Saccas; Metasphaeria maydis (Henn.) Höhnel) (PLS) which is crucial to prevent premature loss of foliar area due to this disease, which would impair the Cz evaluation since the two diseases occur simultaneously in these environments. The experiments were conducted in Mineiros-GO and Iraí de Minas-MG, using CRDs with three replications. The plots consisted of two 5m-long rows spaced apart 0.8 m and were planted and harvested mechanically. At both locations, the final plant population average was 80,000 plants ha-1. Fertilizers were applied at the rate of 40 kg ha-1 of N and 100 kg ha-1 P2O5 and K20, with a complementary side-dressing of 90 kg
ha-1 N at 30 DAS. In addition to the GY, GM and SL variables, the reaction to Cz infection was assessed based on the 1-to-9 scale at 95 DAS. The data was analyzed using the same models as those described for the NILs.
2.3. RESULTS
2.3.1. QTL mapping for Cz infection resistance
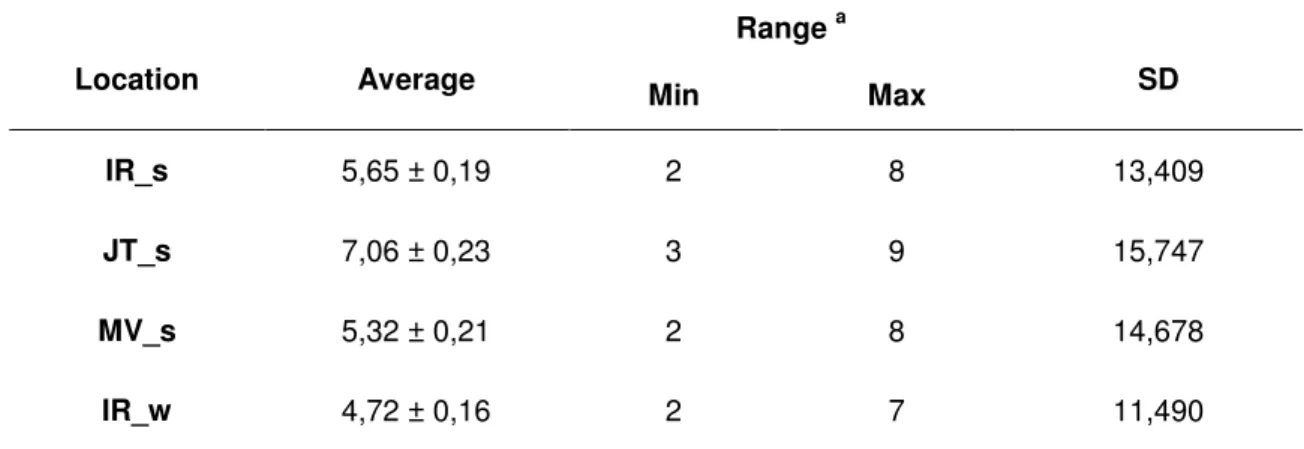
2.3.1.1. Severity of Cz. The highest severity of Cz occurred in JT_s with average of 7.1 ± 0.2 evaluated on a 1-to-9 scale. The lowest occurred in IR_s with average of 4.7 ± 0.2 (Table 1). No artificial inoculation was needed in any location. The frequency distribution of Cz severity based on a 1-to-9 scale for the average of the four locations is presented in Figure 3.
2.3.1.2. Linkage groups. Of the 138 markers used for mapping the QTL, 117 were grouped and associated with the 10 maize chromosomes (85%), encompassing a total length of 1576 cM or 89% coverage of the genome, with an average of 11.7 markers per chromosome and standard deviation (SD) = 7.3. The average and SD for intermarker distance were 14.7 cM and 13 cM, respectively. Chromosomes 5, 6, 8 and 10 had the fewest associated markers, with an average coverage of 58.5% of the total used for these chromosomes. The other chromosomes showed an average of 95.8% of marker coverage.
LOD value = 1.9 for the dominance effect, which explained 7% of the PV. At this same location, this QTL presented LOD value = 6.3 in the Composite Interval Mapping (CIM) analysis, explaining 24% of the PV (data not shown). The fourth QTL allele (Q4) originated from resistant parental line was mapped in IR_s and in the combined analysis of locations in bin 7.03, with LOD value = 2.6 and 3.5, respectively, and each one with additive effects explaining 8% of the PV. In JT_s and in the combined analysis of the four environments, a fifth QTL allele (Q5) originated from the susceptible parent, inconsistent and of minor effect, was mapped in chromosome 9 in bin 9.04. The LOD values were 1.5 and 2.2 and the additive effects explained 6% and 7% of the PV, respectively. This QTL is presented in Table 2 because of its epistatic interaction with Q3, as will be discussed later.
2.3.1.4. Epistatic Interactions. Several epistatic interactions of minor effects were detected in the MIM (Multiple Interval Mapping) analysis at IR_s, MV_s and in the combined analysis of the locations. In IR_s, the LOD values varied from 0.6 to 0.9 and explained from 2% to 4% of the PV. In MV_s, only one additive x additive interaction between Q3 and Q5 with LOD = 1.7 explained 5% of the PV. In the combined analysis of the four environments, the LOD values varied from 0.9 to 1.7, explaining from 1 to 3% of the PV.
2.3.1.5. QTL x location interaction. No significant QTL versus environment interactions were detected for any of the QTL mapped. The results of this analysis are therefore not presented.
2.3.2. Evaluation of the NILs
the chromosomal regions containing the QTL were recovered almost entirely in the backcrossing process. Even Q1 and Q2 occurring in the repulsion phase, both alleles were recovered in the same NIL.
2.3.3. Evaluation of the NIHs
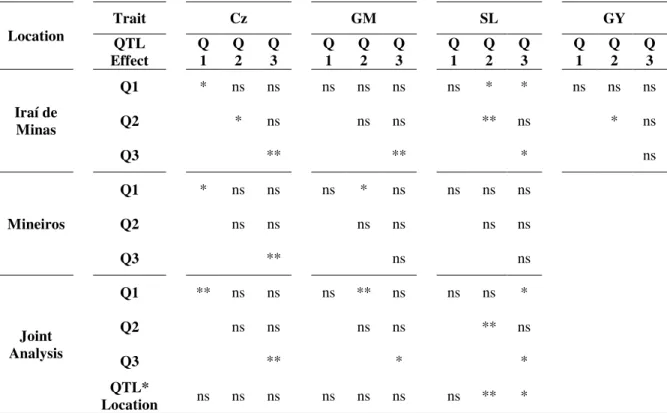
2.3.3.1. Effect of QTL on severity of Cz. Highly significant effects of Q1 and Q3 were found on the severity of Cz evaluated by means of NIHs for Q1 and Q3 (Table 5). Q1 promoted a reduction in score of 0.5 units in Iraí and 0.8 in Mineiros, with average scores of 4.6 and 5.3. Q3 reduced 0.6 and 1 units, with average scores of 4.5 and 5.1 in Iraí and Mineiros, respectively. The effect of Q2 was significant only in Iraí. Significant epistatic or QTL x location interactions were not detected. The regression analysis did not indicate significance for any effect evaluated (data not shown).
2.3.3.2. QTL effects on grain moisture. A significant effect was detected of Q3 on grain moisture (Table 6), although it was not detected by the regression analysis (Table 7). The average increase of GM on the NIHs containing Q3 was 0.6%. The epistatic interaction Q1*Q2 was highly significant (Table 7). The joint occurrence of these QTL led to an increase of 1.5% in the GM. No QTL x location interaction was significant for this trait.
2.3.3.3. QTL effects on stalk lodging. Q2 and Q3 presented significant effects on stalk lodging (Table 8). These results are similar to those of Iraí, since the effects of none of these QTL was significant in Mineiros. The average SL in this location was 1.6%, while in Iraí it was 6%. On average, there was a 4.3% reduction in SL in the NIHs containing Q2. The reduction promoted by Q3 was 2.6%. A significant epistatic Q1*Q3 interaction was detected in the joint analysis of locations. Significance was also detected in Iraí for the Q1*Q2 interaction. Q1 and Q2 both interacted significantly with locations, so reflecting their dissimilar performance in such locations.
2.4. DISCUSSION
The average recovery percentage of the recurrent genotype after two BC cycles was 81.5%. This value would have been higher if Single Mapping Analysis (SMA) had more precision and more precision would have allowed for the selection of a smaller chromosome segment for backcrossing. For the introduction of Q1, Q2, Q3, Q4 and Q5, chromosome segments measuring about 45.3 , 219.2, 95.2 95.2, and 99 cM, respectively, were selected from the recurrent parental line, segments big enough to carry other genes than ones under selection. Regions in chromosome 2 were also selected, but their QTL detected by SMA were not confirmed by MIM. Therefore, no significant differences are expected among NILs as a function of differences in genetic background, and hence, among NIHs for the regions in Chromosome 2.
Considering the values of the proportions of phenotypic variance (PV) explained by the additive effects of the QTL estimated by MIM (Table 2), Q3 is the only QTL that can be classified as exerting a strong effect. It explained 27% of the PV in the combined analysis of the locations and was the only one mapped in 3 out of the 4 locations. This QTL can therefore be classified as consistent (Collard et al, 2005). Q1 and Q2 can be considered as exerting only minor effects and as inconsistent. These QTL were mapped in only one out of the four localities and each one explained less than 10% of the PV.
The stability analysis detected no significance for the three QTL x environment interactions. The fact that a QTL was mapped at some environments but not at others may be related to factors such as the low detection power of the analysis, as well as the QTL x environment interaction. A MAB program based solely on MIM results might fail to consider Q1 and Q2 for selection, since the premises for their efficacy are the magnitude of the effects and the stability of the QTL over environments (Hittalmani et al, 2002).
which presented the highest effect in MIM, obtained a lower value through the use of NILs. In addition to the effect of years, the differences between the results of MIM and NILs may be attributed to the difference in genetic background of the top-crosses versus the NILs.
Epistatic interactions among QTL have not been effectively explored in either basic mapping research or in MAB programs. The degree of stringency utilized for the detection of QTL is normally very high, increasing the risk that loci of minor effects presenting epistatic interactions are not detectable (Carlborg & Haley, 2004) or even considered for selection in a MAB program. In our research the MIM estimates of epistatic interactions presented low LOD values and minor effects. The interaction of highest effect was detected between Q3 and Q5, with a LOD value = 2.2 and an additive x additive effect explaining 5% of the PV. Simulation studies have indicated that the power of detection of epistatic interactions in F2 populations, with effects varying from 1 to 5% of the PV, varies
from 50 to 80% in populations with sizes of 200 to 400 individuals (Verona et al, 2001 apud Carlborg, 2004). Alternatively, the analyses of NILs detected significant epistatic interactions for the severity of Cz (Tables 2 and 3). Individually, Q1 and Q2 reduced 2.9 and 2.0 units in the 1-to-9 scale, respectively (Table 4). The simultaneous occurrence of Q1 and Q2, however, increased the score by 2.4 units.
on chromosome 1 was homozygous for the allele derived from the inbred Va14. Knowledge of the epistatic effects is crucial in a MAB program, for it enables one to maximize not only the genetic gain but also the available resources to obtain inbred lines with the best QTL combination. Thus, the best cost-effective choice would be the combination of either Q2 and Q3 or Q1 and Q3.
These results also appear to indicate the greater efficiency of NILs in detecting epistatic interactions when compared to MIM. NILs have been applied to validate QTL in several crops (Glover et al, 2004; Van Berloo et al, 2001; Bernacchi et al, 1998), allowing for direct comparisons not only of the effects of individual QTL but also of their combinations, thus facilitating the estimation of epistatic interactions. Li et al (1997), working with rice, and Eshed & Zamir (1996) with tomatoes, demonstrated that epistatic interactions among loci apparently presenting no individual main effects can influence important quantitative traits. The latter authors worked with NILs, which have allowed for more frequent detection of epistatic interactions.
Ignoring epistatic interactions may lead to biased estimates of detected QTL effects and to increase the risk of individual locus going undetected (Carlborg & Haley, 2004). Also according to these authors, traditional protocols have focused on estimating the average genetic effect of the genotype of the QTL, ignoring the influence of the genetic background. Doebley et al (1995) have detected a strong influence of the genetic background on the expression of various QTL even affecting the degree of dominance at some loci.
In this research, the mapping and estimation of the QTL effects by MIM were based on the evaluation of top-crosses of F2:3 progenies rather than on the
The discrepancy between these results can be attributed both to the effect of years and to the tester used in the production of the NIHs. Distinct responses among testers in experiments involving mapping and estimation of QTL effects have been reported by Melchinger et al (1998) and Austin et al (2000). Even the use of NILs per se for estimating QTL effects may be influenced by the genetic background of the recurrent inbred. The development of NILs is based on the substitution of the chromosomal regions of a susceptible inbred by corresponding segments containing the QTL for resistance of a resistant parental line. In this research, Q1, originating from the susceptible (recurrent) parental inbred, interacted significantly with Q2 (Tables 2 and 3), which originated from the resistant (donor) parental line. The interaction QTL x genetic background is crucial in programs aimed at the development of hybrids, for selected inbreds are crossed with different testers of distinct genetic backgrounds.
Wisser et al (2006) found a low but significant correlation between date of inflorescence, a measure of plant maturity, and disease-resistant QTL. The association between resistance to infection to Cz and maturity has been described in various studies (Bubeck et al 1993; Coates & White, 1998; Saghai-Maroof et al 1996; Clements et al 2000). The strong link of Q3 with some QTL related to maturity or a possible pleiotropic effect of this allele must be considered. Some QTL related with increased plant maturity are mapped close to the position occupied by Q3. Three QTL that increase the number of days for pollination were mapped in bin 3.05 (92.4 cM, 90.4 cM and 81.9 cM) (CIMMYT- http://www.maizegdb.org/cgibin /qtllocisummarytable.cgi?sortby=8). One of them was associated to grain moisture (Melchinger et al, 1998), and the others to the number of days to flowering at bin 3.06 (Khairallah et al, 1998) and bin 3.08 (Abler et al, 1991). The highly significant epistatic interaction between Q1 and Q2 alleles (Tables 5 and 6) indicate the need for choosing the best combination of QTL in a program that also selects for earliness. The simultaneous occurrence of these QTL alleles increased the grain moisture by 1.5%, although their individual effects were not significant.
reduce the plant photosynthetic rate, as in the case of Cz, by reducing the plant leaf area through necrosis of leaf tissues, therefore interfering in the source-sink relations (Dodd, 1980). Because grains monopolize the consumption of photosynthesized products after flowering, the reduction in the post-flowering photosynthetic rate causes redistribution of the sugars from the stalk to the grains. The result is accelerated senescence of the stalk tissues, rendering them more susceptible to infection by rot-inducing pathogens and predisposing the plant to early death and stalk breaking. Thus, the reduction of leaf tissue loss promoted by Q2 and Q3 was probably reflected in a higher photosynthetic rate for the plant, with a positive response on stalk lodging. This combination of QTL was the one that also promoted the greatest reduction in the severity of the disease (Table 4). In Iraí and in the joint analysis of the locations, a significant epistatic interaction was detected between Q1 and Q3 for stalk lodging (Table 8), although the regression analysis failed to detect it (data not shown).
The ultimate objective of any genetic improvement program for resistance to diseases infection in maize is to attain increases in grain yield. Although the evaluation of the NIHs revealed that Q1 and Q3 had highly significant effects on the reduction of the severity of Cz (Table 5), their effects on grain yield were not significant (Table 9). Conversely, Q2 had a significant effect on the reduction of severity in Iraí (Table 5) and a significant, positive effect on grain yield (Table 9). However, it should be stressed that the observed results, which were obtained mainly for the agronomic traits, can be associated with the residual genotypic differences between NIHs, 18% on average (Figure 3), than the Cz resistant QTL.
2.5. CONCLUSÕES
2.5.1. Mapeamento dos QTL de resistência a C. zeae-maydis
Como rotina para programas de melhoramento assistidos por marcadores moleculares, a Análise de Marcas Simples (AMS) se mostrou eficiente quando comparado ao Mapeamento por Intervalo Múltiplo (MIM).
Nenhum QTL interagiu significativamente com o ambiente, mesmo Q1 e Q2 que foram mapeados com valores LOD<2.5 apenas em uma das quatro localidades (Montividiu safra de verão).
2.5.2. Avaliação das Linhagens Quase Isogênicas (LQIs)
A porcentagem média de recuperação do genótipo recorrente após dois ciclos de retrocruzamentos foi de 81.5 ± 2.5%. O valor teórico esperado com seleção via marcador para apenas um QTL é de aproximadamente 90-95% (Collard et al, 2005). Vários fatores podem ter contribuído para essa discrepância: a) Baixa precisão do mapeamento. Os tamanhos dos segmentos cromossômicos transferidos principalmente no primeiro ciclo de retrocruzamento foram grandes (45.3 cM, 219.2 cM, 95.2 cM, 95.2 cM e 95.0 cM para Q1, Q2, Q3, Q4 e Q5, respectivamente); b) O QTL mapeado pela AMS no cromossomo 2 e recuperado nos retrocruzamentos, não foi confirmado posteriormente pelo MIM (tabela 2); c) Foram manipulados cinco segmentos cromossômicos ao mesmo tempo. O recomendado é se trabalhar no máximo com três QTL por vez, mesmo assim, com a seleção dos marcadores baseada em mapas de alta densidade (Collard et al, 2005).
O background genético do parental recorrente das LQIs pode interagir com o QTL e afetar o valor de sua estimativa. É o caso da interação epistática observado entre Q1*Q2 (tabelas 3 e 4). O alelo Q1 se originou do parental recorrente, enquanto que o Q2, do parental doador.
parte pelo efeito do background genético do testador usado na produção dos testcrosses, uma vez que o testador pode conter QTL interagindo epistáticamente com os QTL em estudo.
O uso de LQIs foi mais eficiente do que o Mapeamento por Intervalo Múltiplo para a estimativa de interações epistáticas entre QTL.
O conhecimento das interações epistáticas entre os QTL permite estabelecer estratégias mais eficientes e econômicas para programas de melhoramento assistidos por marcadores. As combinações Q1*Q2 ou Q2*Q3 foram as que representariam a maior eficiência e o menor custo efetivo. A combinação Q1*Q2 não apresentou vantagem na redução da severidade da doença (tabelas 3 e 4), e aumentou a maturidade das HQIs avaliada pela % de umidade dos grãos em 2.8% (tabela 7).
A validação dos QTL é fundamental na implantação de um programa de melhoramento genético assistido por marcadores. Além de permitir a estimação mais acurada do efeito dos QTL, também permite obter estimativas diretas de interações epistáticas, o que possibilita maximizar os recursos disponíveis ao programa.
2.5.3. Avaliação dos Híbridos Quase Isogênicos (HQIs)
As diferenças observadas entre os resultados obtidos para as estimativas dos QTL e das interações epistáticas entre eles para a severidade da C. zeae- maydis avaliadas nas LQIs e HQIs, podem em parte ser explicadas pelo pequeno número de ambientes de avaliação, efeito de anos e de possíveis efeitos de dominância e interações epistáticas entre os QTL avaliados e os do testador.
Somente Q2 teve efeito significativo na produtividade (tabela 9), promovendo acréscimo de 444 kg/ha. Q3 e a interação Q1*Q2 teve efeitos significativos no aumento na umidade dos grãos (tabelas 6 e 7) e à menor severidade da doença (tabelas 5), o que promove menor índice de morte prematura e conseqüentemente quebramento do colmo, todas características correlacionadas com o aumento da produtividade.
entre os HQIs (18% em média) e não aos efeitos dos QTL de resistência a C. zeae-maydis.
2.6. REFERENCES
Abler, B.S., M. Edwards & C.W. Stuber. 1991. Isoenzymatic identification of quantitative trait loci in crosses of elite maize inbreds. Crop Science 31(2):267-274.
Austin, D.F., M. Lee, L.R. Veldboom & A.R. Hallauer. 2000. Genetic Mapping in Maize with Hybrid Progeny Across Testers and Generations: Grain Yield and Grain Moisture. Crop Science 40:30-39.
Bernacchi, D., T. Beck-Bunn, Y. Eshed, J. Lopes, V. Petiard, J. Uhlig, D. Zamir & S. Tanksley. 1998. Advanced backcross QTL analysis in tomato. I. Identification of QTL for traits of agronomic importance from Lycopersicon hirsutum. Theor. Appl. Genet. 97:381-397.
Bubeck, D.M., M.M. Goodman, W.D. Beavis & D. Grant. 1993. Quantitative Trait Loci Controlling Resistance do Gray Leaf Spot in Maize. Crop Science 33:838-847.
Carlborg, O & C.S. Haley. 2004. Epistasis: too often neglected in complex trait studies? Nature 5: 618-625.
CIMMYT- http://www.maizegdb.org/cgi-bin/qtl_loci_summary_table.cgi?sortby=8 Clements, M.J., J.W. Dudley, and D.G. White. 2000. Quantitative trait loci associated with resistance to gray leaf spot of corn. Phytopathology 90:1018-1025.
Collard, B.C.Y., M.Z.Z. Jahufer, J.B. Brouwer & E.C.K. Pang. 2005. An Introduction to markers, quantitative trait loci (QTL) mapping and marker-assisted selection for crop improvement: The basic concepts. Euphytica 142:169-196.
CONAB – Companhia Nacional de Abastecimento (http://www.conab.gov.br/ ) Dellaporta, S.L.W., J.; Hicks, J.B. 1983. A plant DNA mini preparation: version II.
Plant Mol. Biol. Rep. 1, 19-21.
Doebley, J., A. Stec & C. Gustus. 1995. teosinte branched1 and the Origin of Maize: Evidence for Epistasis and the Evolution of Dominance. Genetics 141: 333-346.
Eberhart, S. A. & W. A. Russell. 1966. Stability Parameters for Comparing Varieties. Crop Science 6:36-40.
Eshed, Y. & D. Zamir. 1996. Less-Than-Additive Epistatic Interactions of Quantitative Trait Loci in Tomato. Genetics 143:1807-1817.
Gardiner, J.M., E.H. Coe, S. Melia-Hancock, D.A. Hoisington & S. Chao. 1993. Development of a Core RFLP Map in Maize Using an Immortalized F2
Population. Genetics 134:917-930.
Glover, K.D., D. Wang, P.R. Arelli, S.R. Carlson, S.R. Cianzio & B.W. Diers. 2004. Near Isogenic Lines Confirm a Soybean Cyst Nematode Resistance Gene from PI 88788 on Linkage Group J. Crop Science 44:936-941.
Gordon, G.S., M. Bartsch, I. Matties, H.O. Gevers, P.E. Lipps & R.C. Pratt. 2004. Linkage of Molecular Markers to Cercospora zeae-maydis Resistance in Maize. Crop Science 44:628-636.
Hittalmani, S., H.E. Shashidhar, P.G. Bagali, N. Huang, J.S. Sidhu, V.P. Singh & G.S. Khush. 2002. Molecular mapping of quantitative trait loci for plant growth, yield and yield related traits across three diverse locations in a doubled haploid rice population. Euphytica 125:207-214.
Jensen, R.C. 1992. A general mixture model for mapping quantitative trait loci by using molecular markers. Theor. and Appl.Genet. 85:252-260.
Jensen, R.C. 1993. Interval mapping of multiple quantitative trait loci. Genetics 135:205-211.
Kao, C., Z. Zeng & R.D. Teasdale. 1999. Multiple Interval Mapping for Quantitative Trait Loci. Genetics 152:1203-1216.