http://www.uem.br/acta ISSN printed: 1679-9275 ISSN on-line: 1807-8621
Doi: 10.4025/actasciagron.v38i3.28268
Image analysis of coffee seeds submitted to the LERCAFE test
Bárbara Gomes Ribeiro1, Christovão Pereira Abraão2, Marcela Carlota Nery2, Rodrigo Marques Nacimento1, Juliana Costa Rezende3 and Cíntia Maria Teixeira Fialho2*
1
Universidade Federal de Lavras, Lavras, Minas Gerais, Brazil. 2Universidade Federal dos Vales do Jequitinhonha e Mucuri, Rua do Cruzeiro, 1, 39803-371, Jardim São Paulo, Teófilo Otoni, Minas Gerais, Brazil, 3Empresa de Pesquisa Agropecuária de Minas Gerais, Belo Horizonte, Minas Gerais, Brazil. *Author for correspondence. E-mail: [email protected]
ABSTRACT. The aim of this experiment was to quantify the stained areas of coffee seeds submitted to the LERCAFE test using image analysis. The seeds used were of the Catuaí Vermelho IAC 99 and Paradise cultivars. The physiological quality of the lots was assessed using germination tests, moisture content and a germination speed index. The LERCAFE test was conducted using seeds without parchment immersed in a solution of 3% sodium hypochlorite for 3 hours. Color photographs (RGB) with a resolution of 5 MPx were taken of each seed. The seeds were visually evaluated, and the functions generated from the analyses of the stained and non-stained regions were quantified by the Matlab R2009b program. Classification models were developed based on the Fisher Linear Discriminant Function and the evaluation of the adequacy of the models confusion matrix between the visual references and the classification generated by the linear functions. The image analysis for the creation of Fisher’s linear discriminant function in the development of classifiers for the coffee seeds submitted to the LERCAFE test is potentially efficient; however, it remains necessary to test other discriminant functions and quantification methodologies.
Keywords: determinants functions, sodium hypochlorite, pixels.
Análise de imagens de sementes de café submetidas ao Teste LERCAFÉ
RESUMO. Objetivou-se com essa pesquisa quantificar as áreas coradas de sementes de café submetidas ao teste LERCAFÉ por meio da análise de imagens. Foram utilizadas sementes das cultivares Catuaí Vermelho IAC 99 e Paraíso. Foi realizada a caracterização da qualidade fisiológica dos lotes com os testes de germinação, umidade e índice de velocidade de germinação. O teste LERCAFÉ foi conduzido utilizando semente sem o pergaminho com solução de hipoclorito de sódio 3% pelo período de 3 horas. Foram feitas fotografias coloridas (RGB) com resolução de 5 MPx de cada semente. As sementes foram avaliadas visualmente e por funções geradas a partir da análise de regiões coradas e não coradas quantificadas pelo programa Matlab R2009b. Foram desenvolvidos modelos de classificação com base na Função Linear de Fisher e avaliação da adequação dos modelos pela Matriz de Confusão entre as referências visuais e classificação gerada pelas funções lineares. A análise de imagem para criação da função discriminante linear de Fisher no desenvolvimento de classificadores para sementes de café submetidas ao teste LERCAFÉ é potencialmente eficiente sendo necessário testar outras funções discriminantes e metodologias para quantificação.
Palavras-chave: funções determinantes, hipoclorito de sódio, pixels.
Introduction
Brazil is the world’s biggest coffee producer. In 2012, Brazil produced approximately 51 million bags of coffee, which corresponds to 35% of the total coffee produced in the world (Organização Internacional do Café [OIC], 2013). Minas Gerais State alone is responsible for approximately 50% of the total production of coffee in Brazil (Companhia Nacional de Abastecimento [CONAB], 2013).
Coffee is cultured through the use of seedlings, which requires the utilization of high quality seeds. In addition, the evaluation of physiological quality, which involves germination and vigor tests, is essential
This test, however, still depends on visual evaluation to determine the viability of the coffee seeds. Thus, the utilization of computational images is an alternative for analysis because it eliminates the possibilities of human error; thus, the results are consistent (Marcos Filho, Kikuti, & Lima, 2009).
According to Hoffmaster, Fujimura, Mcdonald, and Bennett (2003), the quality evaluation of seeds through image analyses is a technique that is used by many cultures; it has shown promise for the evaluation of viability and vigor and has the potential to reduce the time required to generate results. The analysis of digital images consists of the recognition of context for the generation of the dimensional characteristics such as the length of the area or object and attributes such as patterns of color and texture, along with their measurement through count methods or the determination of the frequency of the elements that form the images, named pixels (Teixeira, Cicero, & Dourado Neto, 2006).
Several studies have been conducted to improve the results obtained through image analyses to assess the viability and vigor of seeds. Teixeira, Dorado Neto, Cícero, and Martin (2005) evaluated the uniformity of corn seeds using digital images obtained by a professional surface scanner and obtained satisfactory results. Amaral, Martins, Forti, & Cícero, Marcos-Filho (2011) used X-ray images to evaluate the physiological potential of ipê-roxo
(Tabebuia impetiginosa) and concluded that this
method is efficient. X-ray analysis of images has also been used to evaluate mechanical damage, for example, in soybean (Flor, Cicero, França Neto, & Krzyzanowski, 2004; Ferreira Pinto, Vaz Mondo, Gomes Júnior, & Cicero, 2012), bean (Forti, Cicero, & Pinto, 2008) and corn (Vaz Mondo & Cícero 2005). Another application of image analyses was studied by Moreira et al. (2002), where the authors used lasers to identify, analogous to the tetrazolium test, areas of bean seeds with different levels of metabolic activity. The images were collected by camera CCD (“charge-couple device”) and analyzed in a program of image treatment based on the seeds’ luminescence.
The development of a technique that confers a higher level of accuracy to the evaluation of the LERCAFE test can provide benefits to future research, giving the test higher reliability and reproducibility. Thus, the objective of this work was to use image analysis to quantify the stained areas of the coffee seeds submitted to the LERCAFE test.
Material and methods
The work was realized at the Seeds Laboratory and Wood Technology Laboratory at the Universidade Federal dos Vales do Jequitinhonha e Mucuri (UFVJM), in Diamantina, Minas Gerais. Two cultivars of coffee seeds (Coffea arabica L.) were used — Red Catuaí IAC 99 and Paradise; these were obtained from the 2011/2012 crop, provided by the Empresa de Pesquisa Agropecuária de Minas Gerais.
For the characterization of the lot profiles, the following determinations and tests were defined, as follows:
A germination test was realized using seeds without parchment, which was manually removed. The seeds were placed in a paper substrate to germinate, which was moistened with water in a quantity of 2,5 times their weight. The roller papers were transferred to a germination chamber at 30ºC with constant light. The results of the germination test were expressed as the percentage of normal seedlings, computed at 15 days (First count) and at 30 days (Final count) (MAPA, 2009).
The germination speed index (GSI) was determined according to Maguire (1962), and the moisture content was determined by the air oven method at 105 ± 3°C for 24 hours.
The seeds were submitted to the LERCAFE test, following the methodology proposed by Reis et al. (2010). Coffee seeds without parchment (manually removed) were used and were immersed in sodium hypochlorite with 3% active chloride for 3 hours.
After the realization of the LERCAFE test, the seeds were placed on a laboratory bench and were duly cleaned and disinfected to realize the image register. For separating the seeds, a checkered and numbered A4 paper (Figure 1) was used. The image register was performed using a support exclusively developed to collect images, which only illuminates the seeds using LEDs and standardizes the distance from the camera to the seed (Figure 2).
Figure 1. A4 paper used to mark coffee seeds (a- circles used to mark the seeds, b- coffee seeds submitted to LERCAFE test).
Figure 2. Support used for lighting coffee seeds and for image collection.
The classifiers were developed from the selection of twenty positive points (which were colored due to the application of the test) and twenty negative points (not colored) for each seed, totaling 200 points. The classification models were adjusted based on the Fisher Linear Function (Discriminant Analysis) with variables for the average of the values of the green and blue
bands (GB – x1) and the average of the values of
the red and blue bands (RB – x2).
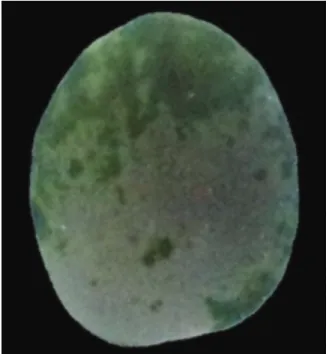
Figure 3. Coffee seed submitted to LERCAFE test after editing for the seed isolation.
The Fisher Linear Function is a multivariate analysis technique used to differentiate or discriminate populations and classify individuals in pre-defined populations. For the discrimination, functions are constructed from observed variables that are responsible or that can explain the differences between the populations. For the allocation or classification, functions that separate the populations and also place or classify a new individual in just one population are determined (Ferreira, 2011; Hair Júnior, Black, Babin, Anderson, & Tatham, 2009). The function to discriminate between pixel populations that are positive (regions of seeds that react with the active chloride present in the solution of sodium hypochlorite) and negative (unreacted regions) is given by:
D X = L . X = x − x . S . X,
where,
L = discriminant vector
X = xx = vector of characteristics of the points to be classified
x = average between the brightness values of the bands G and B;
x = averages between the brightness values of the bands R and B;
a
x = x x = vector containing the averages of the variables x1 and x2, in the positive reaction points;
x = x x = vector containing the averages of the
variables x1 and x2, in the negative reaction points;
x = average of the variable x1 in the positive
reaction points;
x = average of the variable x2 in the positive
reaction points;
x = average of the variable x1 in the negative
reaction points;
x = average of the variable x2 in the negative
reaction points;
S = Common covariance matrix of the populations xP and xN.
The median point between two population averages x and x is:
m =12 D x + D x
The rule of classification based on the Fischer discriminant function is:
Allocate Xin if D X ≥ m; Allocate Xin N if D X < .
The accuracy of the classifiers for each cultivar, and for both combined cultivars, was determined by the confusion matrix. This statistical tool was constructed through the true information of the test samples, which means it is assumed to be true that all of the pixels of the test samples belong to the class to which they were assigned.
The exclusion and inclusion of errors for each matrix were determined; exclusion or omission errors occur when a pixel is not attributed to the class to which it belongs, and an inclusion error occurs when a pixel is attributed to a class to which it does not belong. Each error represents one correct class omission, and one inclusion represents one incorrect class.
In the evaluation of the classification using the confusion matrix, a proportion of the samples were correctly classified, denominated global exactness (E_G), which corresponds to the region between the sum of the diagonal confusion matrix (samples correctly classified) and the sum of all elements of this matrix (number total of samples). The kappa coefficient was also calculated, which is based on the difference between the observed agreement and the chance of agreement between the reference dates and one aleatory classification (product between the marginal totals of the matrix).
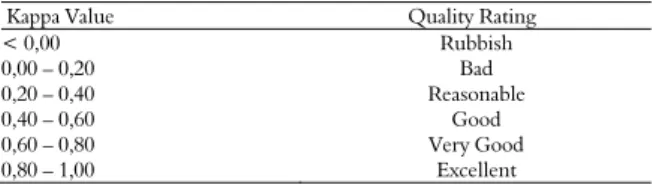
Landis and Kock (1977) proposed a rating evaluation of classification quality based on the K value (Table 1).
Table 1. Quality of classification according to the intervals of agreement of the Kappa coefficient.
Kappa Value Quality Rating < 0,00 Rubbish 0,00 – 0,20 Bad 0,20 – 0,40 Reasonable 0,40 – 0,60 Good 0,60 – 0,80 Very Good 0,80 – 1,00 Excellent
A visual evaluation was also realized with the images of the two cultivars of coffee seeds submitted to the LERCAFE test using the three classifiers.
Results and discussion
The moisture contents of the coffee seeds of the Red Catuai cultivar and the Paradise cultivar were 19 and 20%, respectively. For the germination test, the results showed that the Red Catuai cultivar presented 91% germination compared to 81% for the Paradise cultivar. For the first count, Red Catuai presented 76% germination, and Paradise presented 61%. The GSI result was 5,3 for Red Catuai and 4,2 for Paradise.
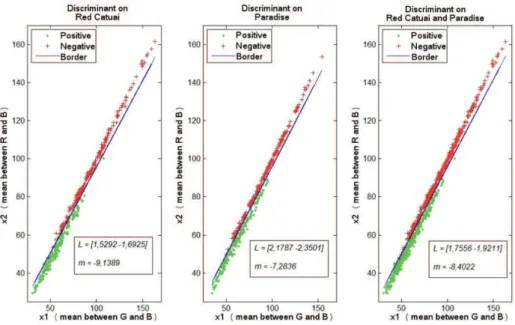
A determination of the seed lot profiles was realized to detect the physiological differences between the lots. The estimated values for the discriminant vector L and the midpoints between the population averages m of the Fischer discriminant linear function applied to the samples, which reacted positively or negatively with the active chloride present in the sodium hypochlorite, are presented in Figure 4.
Note that the values for the discriminant vectors and for the midpoints between the population averages, when the discriminant function on the total conjunct of dates is applied (Red Catuai and Paradise cultivars), are found in an intermediate position relative to those obtained when the function is applied to the cultivars individually. The distribution of the points around the line that represents the limit between the two populations (positive and negative) is also shown in this figure.
Figure 4. Distribution of variable values descriptors around the limit between the populations (positive and negative). L = discriminant vector; m = midpoint between populations.
Table 2. Confusion matrices between the visual references and the classification generated by the Fisher’s linear discrimination function.
Classifier Catuai Classifier Paraiso Classifier conjunction
P N Utter e_i. P N Utter e_i P N Utter e_i.
C.
P 391 25 416 6,01 388 28 416 6,73 391 25 416 6,01 N 3 442 445 0,67 1 444 445 0,22 1 444 445 0,22 Utter 394 467 861 389 472 861 392 469 861
e_e. 0,76 5,35 0,26 5,93 0,26 5,33
K=0,93 E_G = 96,75 K=0,93 E_G = 96,63 K=0,94 E_G = 96,98
Pa.
P 451 2 453 0,44 443 10 453 2,21 449 4 453 0,88 N 38 367 405 9,38 11 394 405 2,72 27 378 405 6,67 Utter 489 369 858 454 404 858 476 382 858
e_e. 7,77 0,54 2,42 2,48 5,67 1,05 K=0,91 E_G = 95,34 K=0,95 E_G = 97,55 K=0,93 E_G = 96,39
C.Pa.
P 842 27 869 3,11 831 38 869 4,37 840 29 869 3,34 N 41 809 850 4,82 12 838 850 4,47 28 822 850 3,41 Utter 883 836 1719 843 876 1719 868 851 1719
e_e. 4,64 3,23 4,51 4,34 3,34 3,41 K=0,92 E_G = 96,04 K=0,94 E_G = 97,09 K=0,93 E_G = 96,68 Note: C = Red Catuai Cultivar; Pa = Paraiso cultivar; C.Pa. = Catuai and Paraiso Cultivars; P = Positive; N= Negative; K = Kappa Coefficient; E_G = Global accuracy; e_i = Inclusion error; e_e = Exclusion error.
Still analyzing Table 2, note that for the Red Catuai cultivar the inclusion errors for the positive population were higher than for the negative population; this makes it more difficult to identify by the LERCAFE test what is stained green and what is the natural color of the seed. For the Paradise cultivar, the inclusion errors were higher for the negative population, which means that points were included in the negative class that actually belonged to the positive class. This made it difficult to detect what was not stained green, and the same result was observed when the two cultivars were analyzed together.
Exclusion errors are used to analyze the efficiency of classifiers. For the Red Catuai cultivar, the classifier Catuai erroneously classified 25 points, which were actually negative but were classified as
The kappa agreement coefficient for the three classifiers applied to the validation sample groups was considered excellent by the quality scale defined by Lands and Koch (1977).
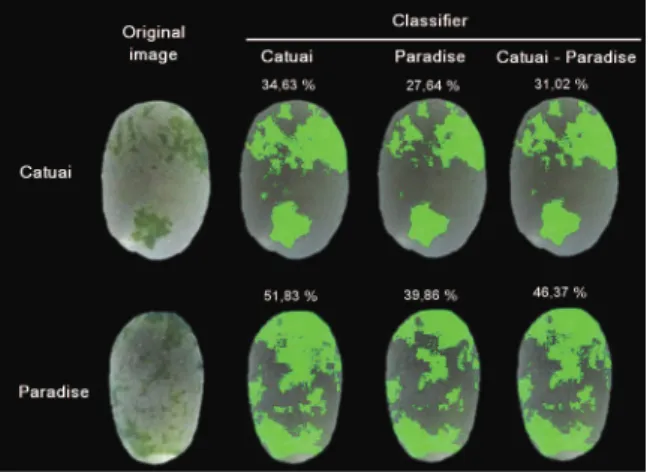
Figure 5 presents the results of the image classification of the coffee seeds of the Catuai and Paradise cultivars, submitted to the LERCAFE test, applying the three classifiers. The immediate visual analyses suggest that the paradise classifier better identified the stained areas. However, the seed staining is subtle enough that the human eye cannot detect what the classifiers detect mathematically.
Thus, only through the repetitive collection of samples for use in validating the classifiers would it be possible to statistically compare the accuracies obtained for each cultivar-classifier combination. To achieve an ideal methodology for the development of classifiers for the evaluation of coffee seeds submitted to the LERCAFE test, the discriminant function and the experimental instructions must be refined. These refinements should address the variations in the intensity and spectral quality of the light; the use of hyperspectral cameras, including the range of work performed outside the visible spectrum; and adjustments to the concentrations of the sodium hypochlorite solution.
Figure 1. Original images of coffee seeds submitted to the LERCAFE test of Red Catuaí and Paradise cultivars and the images resulting from the application of the three classifiers.
Conclusion
The Fisher linear discriminant function for use in the development of classifiers for coffee seeds submitted to the LERCAFE test is efficient; however, additional tests are still required with other discriminant functions and other methods for quantification.
Acknowledgements
The authors thank the Agricultural Research Company of Minas Gerais (EPAMIG) for supplying the coffee seeds used in this research.
References
Amaral, J. B., Martins, L., Forti, V. A., Cícero, S. M., & Marcos-Filho, J. (2011). Teste de raios x para avaliação do potencial fisiológico de sementes de ipê-roxo.
Revista Brasileira de Sementes, 33(4), 601-607.
Companhia Nacional de Abastecimento [CONAB]. 2013.
Acompanhamento de safra brasileira: grãos, décimo primeiro levantamento. Retrieved on May 25, 2014, from. www.conab.gov.br/conteudos.php?a=1253&t=2 Ferreira, D. F. (2011). Estatística multivariada (2a ed.).
Lavras, MG: UFLA.
Ferreira Pinto, T. L., Vaz Mondo, V. H., Gomes Júnior, F. G., & Cicero, S. M. (2012). Análise de imagens na avaliação de danos mecânicos em sementes de soja.
Pesquisa Agropecuária Tropical, 42(3), 310-316. doi: 10.1590/S1983-40632012000300010
Flor, E. P. O. F., Cicero, S. M., França Neto, J. B., & Krzyzanowski, F. C. (2004). Avaliação de danos mecânicos em sementes de soja por meio da análise de imagens. Revista Brasileira de Sementes, 26(1), 68-76. doi: 10.1590/S0101-31222004000100011
Forti, V. A., Cicero, S. M., & Pinto, T. L. F. (2008). Análise de imagens na avaliação de danos mecânicos e causados por percevejos em sementes de feijão. Revista Brasileira de Sementes, 30(1), 121-130. doi: 10.1590/S0101-31222008000100016
Guimarães, G. C., Rosa, S. D. V. F., Coelho, L. F. S., Veiga, A. D., & Clemente, A. C. S. (2013). Período mínimo para avaliar o potencial germinativo de sementes de café. Journal of Seed Science, 35(3), 347-352. doi: 10.1590/S2317-15372013000300011
Hair Júnior, J. F., Black, W. C., Babin, B. J., Anderson, R. E., & Tatham, R. L. (2009) Análise multivariada de dados (6a ed.). Porto Alegre, RS: Bookman.
Hoffmaster, A. L., Fujimura, K., McDonald, M. B., & Bennett, M. A. (2003). An automated system for vigor testing three-day-old soybean seedlings. Seed Science and Technology, 31(3), 701-713. doi: 10.15258/sst.2003.31.3.19
Landis, J. R., & Koch, G. G. (1977). The measurement of observer agreement for categorical data. Biometrics,
33(1), 159-174.
Maguire, J. B. (1962). Speed of germination-aid in selection and evaluation for seedling emergence vigor.
Crop Science, 2(1), 176-177.
Marcos Filho, J., Kikuti, A. L. P., & Lima, L. B. (2009). Métodos para avaliação do vigor de sementes de soja, incluindo a análise computadorizada de imagens.
Revista Brasileira de sementes, 31(1), 102-112. doi: 10.1590/S0101-31222009000100012
Ministério da Agricultura, Pecuária e Abastecimento [MAPA]. 2009. Regras para análise de sementes. Brasília, DF: MAPA/ACS.
Organização Internacional do Café [OIC]. 2013. Produção total dos países exportadores. Retrieved on May 25, 2014 from www.ico.org/ trade_statistics.asp?section =Statistics
Reis, L. S., Araújo E. F., Dias, D. C. F. S., Sediyamam C. S., & Meireles, R. C. (2010). LERCAFÉ: Novo teste para estimar o potencial germinativo de sementes de cafeeiro (Coffea arabica L.). Revista Brasileira de Sementes, 32(1), 9-16. doi: 10.1590/S0101-31222010000100001 Teixeira, E. F., Dorado Neto, D., Cícero, S. M., & Martin,
T. N. (2005). Análise da uniformidade de sementes de milho via processamento de imagens digitais. Revista da Faculdade de Zootecnia, Veterinária e Agronomia, 14(1), 14-24.
Teixeira, E. F., Cicero, S. M., & Dourado Neto, D. (2006). Análise de imagens digitais de plântulas para avaliação do vigor de sementes de milho. Revista Brasileira de Sementes,
28(2), 159-167. doi: 10.1590/S0101-31222006000200022
Vaz Mondo, V. H., & Cicero, S. M. (2005). Análise de imagens na avaliação da qualidade de sementes de milho localizadas em diferentes posições na espiga.
Revista Brasileira de Sementes, 27(1), 9-18. doi: 10.1590/S0101-31222005000100002
Zonta, J. B., Araújo, E. F., Araújo, R. F., Reis, M. S., & Zonta, F. M. G. (2010). Teste LERCAFÉ para sementes de cafeeiro com diferentes teores de água.
Revista Brasileira de Sementes, 32(1), 17-23. doi: 10.1590/S0101-31222010000100002
Received on June 22, 2014. Accepted on October 28, 2015.