L.A. Marcelino, M. Galvin
1,2,
G.M. Martins, M.J. Proença,
E. Mayrand
1, J.A. Rueff and
C.J. Monteiro
Faculty of Medical Sciences
UNL, Lisbon, Portugal,
1PE
Biosystems, Foster City and
2Axys Pharmaceuticals, La
Jolla, CA, USA
ABSTRACT
Human tumor samples were screened for point mutations by adapting a mobility-shift assay to automated DNA sizing. This screen identifies the type of point mutation and relative amount of mutated DNA se-quences present in a sample. Test samples having known hypoxanthine-guanine phos-phoribosyl transferase (hprt)/exon-3 se-quence mutations were characterized by: (i) PCR amplification, (ii) fluorescent dye-primer extension with 36-atom linker de-rived deoxycytosine or deoxyuridine tri-phosphate and the remaining three natural nucleotides and (iii) sizing of the resulting fluorescently labeled modified strands, us-ing an automated DNA sequencer. Routine-ly, a range of sizes is observed among the sequence variants of a single DNA target sequence. This is because nucleotide analogs are incorporated into DNA strands in a sequence-dependent manner, resulting in composition-dependent electrophoretic mobility. Thus, point mutations are identi-fied as shifts in mobility between the fluo-rescently labeled modified strands of the control and test samples. The twenty differ-ent hprt/exon-3 single-base substitution mu-tations tested were easily identified, even at fourfold dilution with control DNA.
INTRODUCTION
The mobility-shift assay coupled with polymerase chain reaction (PCR) amplification reported by Kornher and Livak (10) and Livak et al. (13) has shown to be a simple and efficient method in detecting point mutations and polymorphisms in different genes, such as in the human insulin receptor gene (10), in the β-hexosaminidase α gene, in the human cytochrome P450 debriso-quine 4-hydroxylase gene and in the hu-man Apopolipoprotein E gene (13).
Here, we describe the use of multi-ple-color, fluorescence-based detection combined with the mobility-shift assay, designated by us as the multiple fluo-rescence-based long linker arms assay (mf-LLA). Multiple color fluores-cence-based detection, using the Model 373A DNA Sequencer and GENE-SCAN™ 672 computer software, al-lows for the simultaneous screening of many samples, because DNA frag-ments with different sizes and labeled with different colored fluorescent tags can be run in the same gel lane (18). We tested if the mf-LLA assay could be a fast, sensitive and reliable method for the routine detection of mutations.
MATERIALS AND METHODS Samples
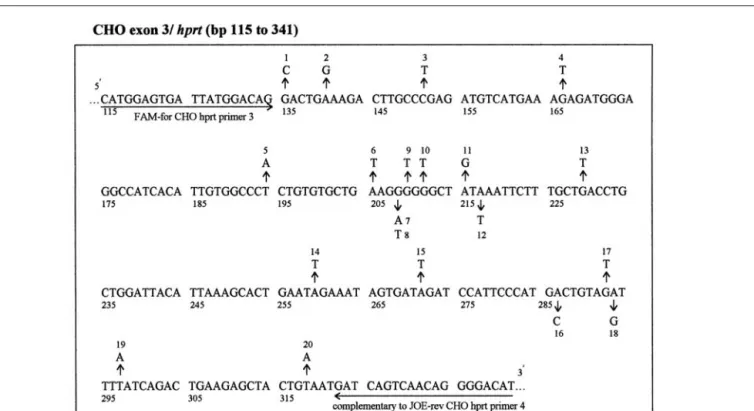
Twenty different Chinese hamster ovary (CHO) point mutants were previ-ously identified as differing from the wild-type by single-base substitutions in exon 3 of the hypoxanthine-guanine phosphoribosyl transferase (hprt) gene
(12,14,15) (Figure 1).
Surgical discard samples of gastric and lung tumors, and the matching non-tumorous tissues, were generously pro-vided by the pathology units of the Hospitals Pulido Valente, São José and Santa Cruz in Lisbon. All patients vol-untarily gave informed consent. Sam-ples were immediately fixed in 10% formalin and embedded in paraffin.
Materials
Nucleotide analogs of cytosine 36-dCTP) and uracil (biotin-36-dUTP) containing a biotin molecule at the end of a 36 atom chain, which is linked to the carbon 5 of the purine ring (nucleotide analogs with long linker arms), were synthesized as de-scribed (13).
Oligonucleotides used in this experi-ment were synthesized as previously described (5). After synthesis, each primer was labeled at the 5′ end with a fluorescent dye (FAM, JOE or TAM-RA, which are blue, green or yellow color dyes, respectively) (PE Biosys-tems, Foster City, CA, USA) or left un-labeled and HPLC purified (5). Table 1 gives the sequence of the primers used in PCR amplification and the mf-LLA assay for mutation detection in differ-ent DNA target sequences.
DNA Extraction from Human Tumor Biopsies
DNA isolation was performed by an adaptation of the method described by Impraim et al. (8). Briefly, DNA was isolated from scalpel-minced tissues by
1134 BioTechniques Vol. 26, No. 6 (1999)
Fast and Reliable Screening of Mutations in
Human Tumors: Use of Multiple
Fluorescence-Based Long Linker Arm Nucleotides Assay
(mf-LLA)
BioTechniques 26:1134-1148 (June 1999)
lysis with proteinase K (500 mg/mL) in 1% sodium dodecyl sulfate (SDS) and TEN buffer (100 mM Tris-HCl, 40 mM EDTA, 10 M NaCl, pH 8.0) for 16–40
h at 50°C, followed by phenol/chloro-form/isoamyl-alcohol extractions and ethanol-precipitation. The DNA pellet was resuspended in deionized water.
Amplification Conditions
All PCR amplifications contained 200 µM of each deoxynucleotide
Vol. 26, No. 6 (1999) BioTechniques 1135
DNA Base Pair
Fluorescent-Sequence Primers Primers Sequence Position Dye Label Reference
CHO hprt hprt 1 (Forward) 5′ ACCTCACCGCTTTCTCGTGC 3′ -88 – -69 not labeled 16a hprt 2 (Reverse) 5′ TTCGTCTACCGACGTCTTGA 3′ 731 – 750
CHO hprt hprt 3 (Forward) 5′ CAT GGA GTG ATT ATG GAC AG 3′ 115 – 134 blue (FAM) 16a (exon-3) hprt 4 (Reverse) 5′ ATG TCC CCT GTT GAC TGA TC 3′ 322 – 341 green (JOE)
Human HRAS hHras1 (Forward) 5′ GGA GAC CCT GTA GGA GGA CC 3′ 1619 – 1638 blue (FAM) this workb (intron-1 and hHras2 (Reverse) 5′ AGC TGC TGG CAC CTG GAC 3′ 1792 – 1809 yellow
exon-1) (TAMRA)
Human KRAS hKras1 (Forward) 5′ GAC TGA ATA TAA ACT TGT GG 3′ 98 – 117 blue (FAM) 20c (exon-1) hKras2 (Reverse) 5′ CTA TTG TTG GAT CAT ATT CG 3′ 185 – 204 green (JOE)
aThe base pair positions given are from the CHO hprt cDNA (16).
bPrimers were designed using the PRIMER®software (PREMIER Biosoft International, Palo Alto, CA, USA) on the HSRAS1 sequence, GenBank®Accession No. V00574.
cThe base pair positions are from the HSRASK22 sequence, GenBank Accession No. L00045 (20).
Table 1. Sequence of Oligonucleotides Used as Primers in PCR Amplification of a mf-LLA Assay for Mutation Analysis in Different DNA Target Sequences
Figure 1. hprt/exon-3 sequence (bp 115–341; Reference 9) of CHO cells used as target sequence for studies of mutation detection efficiency. Shown are
the previously identified type and position of each mutant carrying one single-base substitution (12,14,15). Sequences recognized by DNA primers used for the mf-LLA assay are underlined.
triphosphate (dNTP) and were per-formed in a final volume of 50 µL in a Model 480 or 9600 DNA Thermal Cy-cler (Perkin-Elmer, Norwalk, CT, USA). Table 2 shows the PCR amplifi-cation conditions specific of each target DNA sequence. Before cycling, reac-tion mixtures containing either Ampli-Taq® DNA Polymerase or AmpliTaq Gold™ Polymerase (both from Perkin-Elmer) were incubated for 5 or 10 min at 94°C, respectively.
mf-LLA Assay
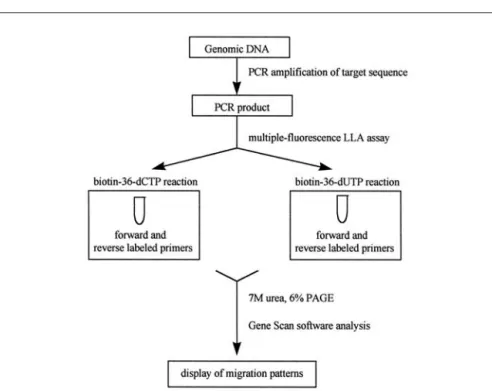
Figure 2 shows an overview of the mf-LLA assay. After amplification of the desired sequence from genomic DNA, PCR products were purified in MicroSpin S-300HR Columns® (Am-ersham Pharmacia Biotech, Piscataway, NJ, USA) to remove excess dNTPs and residual unlabeled primer carried over from amplification. Purified PCR target sequences were used as templates for the mf-LLA assay in a 2-tubes reaction in the presence of either 1 mM biotin-36-dCTP or biotin-36-dUTP, 500 µM of the remaining three dNTPs, 10% di-methyl sulfoxide (DMSO), 0.2 U of
Figure 2. Flow diagram of the mf-LLA assay. Genomic DNA is amplified using target
sequence-spe-cific primers. PCR-amplified DNA fragments are used as templates for the mf-LLA assay using either biotin-36-dCTP or biotin-36-dUTP along with the remaining three natural nucleotides and both forward and reverse primers. mf-LLA products are electrophoresed on a 7 M urea, 6% polyacrylamide gel elec-trophoresis (PAGE), and GENESCAN 672 software determines the size of the DNA fragments based on the use of a DNA size marker, which is co-migrated with each sample.
Reaction Mixtures DNA Thermal Cycler Conditions
DNA Primersa Enzyme DNA Denaturation Annealing Extension Cycle
Sequences (µµM) Buffer (U) (µµg) Step Step Step No. Reference
Chinese 0.15 1× Taqb 1.25 0.1–0.5 94°C, 60°C, 72°C, 30 16
hamster ovary hprt 1 and Taq pol cDNA 1 min 2 min 3 min
hprt hprt 2
Chinese 0.6 1× Taqb 2 0.05 94°C, 55°C, 72°C, 30 16
hamster ovary hprt 3 and Taq pol PCR 1 min 30 s 1 min
hprt/exon-3 hprt 4 producte
Human HRAS 0.2 1× Taqc 1.25 1 95°C, 64°C, 72°C, 37
hHras1 and Gold Taq pold genomic 30 s 30 s 1 min this work
hHras2 Gold DNA
Human KRAS 0.2 1× Taqc 1.25 1 95°C, 55°C, 72°C, 37
hKras1 and Gold Taq pold genomic 20 s 20 s 30 s this work
hKras2 Gold DNA
aSee Table 1 for information on primer sequence and position.
b1× AmpliTaq buffer [10 mM Tris-HCl, pH 9.0, 50 mM KCl, 1.5 mM MgCl
2and 0.01% (wt/vol) gelatin (Perkin-Elmer)]. c1× AmpliTaq Gold buffer [10 mM Tris-HCl, pH 8.3, 50 mM KCl, 1.5 mM MgCl
2and 0.01% (wt/vol) gelatin (Perkin-Elmer)]. dThe use of AmpliTaq Gold DNA polymerase (Taq pol Gold) instead of AmpliTaq DNA polymerase (Taq pol) helped to
signifi-cantly reduce nonspecific PCR products for specific sequences only.
eA PCR product of 833 bp amplified from total CHO cDNA (16) was used as a template for PCR amplification with the nested primers hprt 1 and hprt 2.
Table 2. PCR Amplification of Different DNA Target Sequences
Vent®R DNA Polymerase without the 3′→5′ exonuclease activity (exo-) (New
England Biolabs, Beverly, MA, USA), VentRPolymerase buffer [20 mM
Tris-HCl, pH 8.8, 10 mM KCl, 2 mM MgSO4, 10 mM (NH4)2SO4, 0.1% Tri-ton® X-100] (13) and primers labeled with different colored fluorescent tags
(see Table 1). The reactions were sub-jected to 1 cycle of the following regi-men: 95°C for 3 min; 55°C for 45 s and 75°C for 3 min. Each sample was then
Research Report
FAM-Labeled Forward LLA Strand JOE-Labeled Reverse LLA Strand
hprt Mutant Type
of Mutation Biotin-36-dCTP Biotin-36-dUTP Biotin-36-dCTP Biotin-36-dUTP
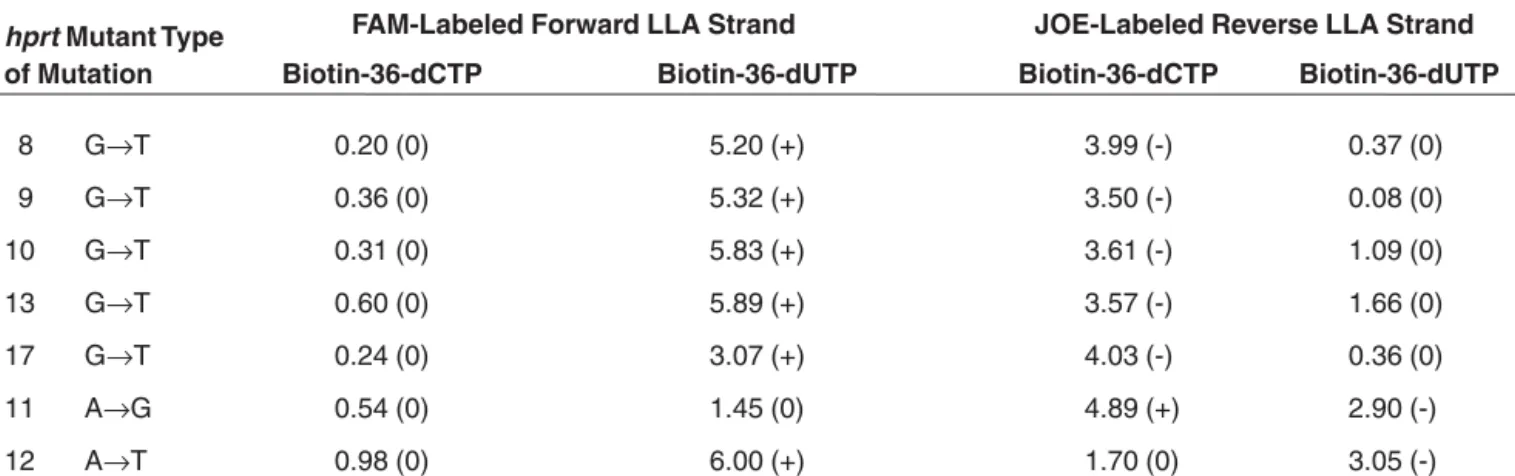
8 G→T 0.20 (0) 5.20 (+) 3.99 (-) 0.37 (0) 9 G→T 0.36 (0) 5.32 (+) 3.50 (-) 0.08 (0) 10 G→T 0.31 (0) 5.83 (+) 3.61 (-) 1.09 (0) 13 G→T 0.60 (0) 5.89 (+) 3.57 (-) 1.66 (0) 17 G→T 0.24 (0) 3.07 (+) 4.03 (-) 0.36 (0) 11 A→G 0.54 (0) 1.45 (0) 4.89 (+) 2.90 (-) 12 A→T 0.98 (0) 6.00 (+) 1.70 (0) 3.05 (-)
Mobility shifts displayed by different hprt/exon-3 CHO mutants after mf-LLA analysis. Mobility shifts (labeled as 0, + or -) cor-respond to the difference between the size of mutant- and wild-type-modified DNA strands, given in base pairs. The position of each mutant in the sequence is indicated in Figure 1.
Table 3. Effect of Sequence Context
Figure 3. Detection of single-base substitutions using the mf-LLA assay. The differences in mobility between mutant- and wild-type (WT)-modified single
strands can be used to predict the type of single-base substitution based on which analog was incorporated opposite the mutation (dCTP or biotin-36-dUTP), and on which primer was extended (forward or reverse). Each single-base substitution has a characteristic migration pattern, labeled as (0, + or -). A mu-tant-modified strand with a: (i) equal size, (ii) smaller size or (iii) bigger size than the wild-type-modified strand migrates: (i) the same, 0, (ii) faster, + or (iii) slower, -, than the wild-type, respectively.
lyophilized, resuspended in 4 µL of loading solution (95% deionized for-mamide, 12.5 mM EDTA, 0.05% blue dextran) and mixed with a commercial DNA size marker comprising AluI di-gestion fragments of pBR322 labeled with the red color dye ROX (GENES-CAN 2500-ROX) (PE Biosystems). Each sample was denatured (95°C for 3 min) and kept on ice before loading. LLA reaction products were subjected to electrophoresis in a 7 M urea/6% polyacrylamide gel (acrylamide/bis-acrylamide 19:1) containing 1× MTB (0.14 M Tris-HCl, pH 9.5, 0.045 M boric acid, 2.3 mM EDTA) in both the gel and the running buffer (13). Elec-trophoresis was performed using a Model 373A Automated DNA Se-quencer (PE Biosystems) at 45 V/cm for 7–12 h (depending on the expected size range of the fragments). Fluores-cently labeled LLA products were de-tected as laser-excited fluorescence as they migrated through the fluorescence detection system. The sizes of the elec-trophoresed LLA products were then determined by GENESCAN 672 soft-ware (PE Biosystems), which uses the method of second-order regression to establish a curve of best fit generated from the DNA size marker in each lane. Electrophoresis of a size marker mixed with every sample reduces the errors in size estimation caused by lane-to-lane variability in migration rates. This al-lows comparison of shifts in mobility that mutant-modified strands show when compared to the corresponding wild-type-modified strands. Each of the twelve possible single-base substitu-tions has a characteristic set of mobili-ty shifts (labeled as 0, + or -) depending on which nucleotide analog (biotin-36-dUTP or biotin-36-dCTP) was incorpo-rated and on which primer (forward or reverse) was extended by VentRDNA
polymerase (Figure 3).
RESULTS
Efficiency of the mf-LLA Assay in Detecting Single-Base Substitutions
Effect of mutation type. To test the
efficiency of the mf-LLA assay for de-tecting point mutations, we performed a blind analysis on twenty CHO hprt
mutants (arbitrarily numbered 1–20) that had been identified by sequencing in an independent study (Figure 1).
All different mutations were easily detected by comparing the relative mi-gration of both mutant and wild-type fluorescently labeled LLA products shown in Figure 4 with the predicted pattern of mobility shifts for any given
point mutation, shown in Figure 3. Furthermore, two different mutations at the same nucleotide position were studied; mutants hprt 7 (G:C to A:T) and hprt 8 (G:C to T:A) at bp 208. The mobility shifts observed for each mutant were different and dependent on the mu-tation type (Figure 4).
Effect of sequence context. To
Research Report
Figure 4. mf-LLA detection of different hprt-base substitutions. Electropherograms display
FAM-la-beled forward (FAM-for) and JOE-laFAM-la-beled reverse (JOE-rev) modified DNA strands with either biotin-36-dCTP or biotin-36-dUTP analogs incorporated. The type of mutation is determined based on a com-parison of the relative mobility among mutant LLA products and the corresponding wild-type LLA products. Each type of mutation has a characteristic pattern of mobility shifts, labeled as (0, + or -). See Figure 1 for position of the mutant in the hprt target sequence.
Color Photo - For position only
evaluate the effect of sequence context in the sensitivity of mutation detection by mf-LLA, mutants carrying the same type of mutation (G:T to T:A) but in different positions in the sequence were analyzed by mf-LLA (Table 3). Of in-terest is the fact that three of the G:C to T:A mutants (hprt 8, 9 and 10) were present in a run of 6 guanines. This re-quired VentR (exo-) DNA polymerase
to incorporate six biotin-36-dCTP resi-dues in a row, with no prematurely ter-minated strands due to the fall off of the enzyme (Table 3 and Figure 4). Fur-thermore, hprt mutants 11 (A:T to G:C, bp 215) and 12 (A:T to T:A, bp 217), present in a run of 7 adenines and thymines, show that bio-36-dUTP residues are also well accepted by VentRDNA polymerase (Table 3).
Limit of Detection of mf-LLA Assay
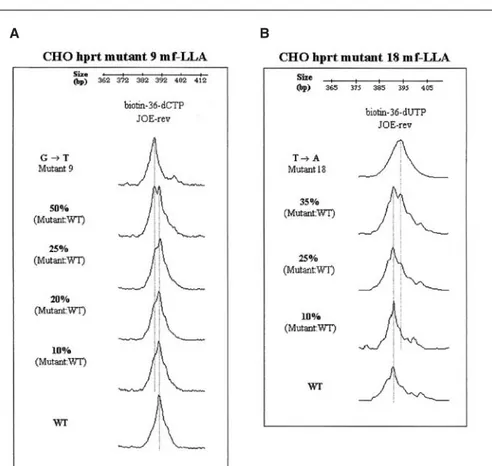
The limit of detection of mf-LLA was determined by reconstruction
ex-periments, in which two different PCR-amplified mutants were independently mixed with wild-type in different pro-portions and analyzed by mf-LLA (Fig-ure 5). Both mutants tested were readi-ly detectable by mf-LLA when present in 25% of the total DNA target se-quences in the mixture. When the mu-tants were present in 20% of the mix-ture, their detection became ambiguous, and if any of the mutants were present in 10% of the mixture, it was no longer detectable. Therefore, by using mf-LLA, analysis of a mixed population of cells is feasible, provided that the mu-tant sequences represent at least 25% of the template mixture.
Use of the mf-LLA Assay to Detect Mutations in the HRAS and KRAS Genes of Human Tumor Biopsies
Thirty gastric tumor biopsies, along with corresponding non-tumorous biop-sies, were screened by mf-LLA to
assess point mutations in exon 1 of
HRAS gene. Figure 6A shows a sample
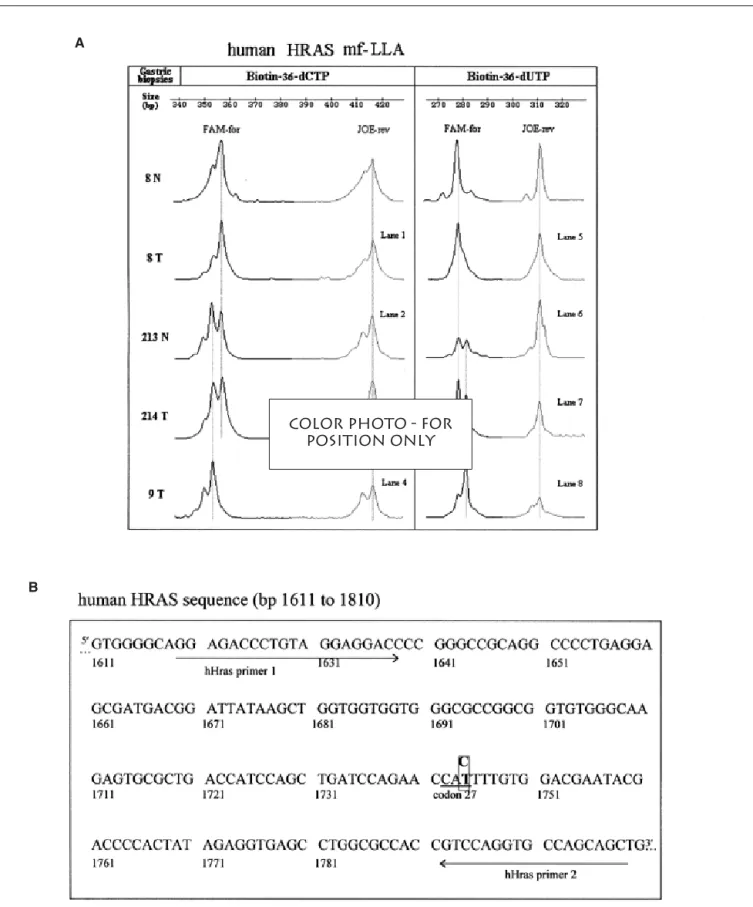
result. mf-LLA analysis identified the mutation as a C:G to T:A transition, and individuals were found heterozygous and homozygous for the mutation. Both normal and tumorous tissues of the same individual showed the same mi-gration pattern, suggesting that the de-tected transition was not associated with stomach cancer. Sequencing of DNA samples revealed a C:G to T:A transi-tion at bp 1744 (codon 27) of the HRAS gene (Figure 6B). A C:G to T:A transi-tion was previously described as a se-quencing variant (19) and later as a DNA polymorphism (1,6).
Twenty-one squamous cell carcino-ma specimens and six adenocarcinocarcino-ma specimens were then screened by the mf-LLA assay for mutations in a KRAS sequence containing part of exon 1. Fig-ure 7 shows a sample result. A mobility shift was observed for the tumor tissue (sample 138 T) and not for the corre-sponding normal tissue (138 N) for only one individual. mf-LLA identified the mutation as a G:C to T:A transition, and it was confirmed by sequencing. Be-cause the mutant DNA sequence was found in approximately 20%–30% of the tumor sample, to facilitate identifi-cation of the mutation by sequencing, single-strand conformation polymor-phism (SSCP) was used as a preparative method to isolate the mutant bands. One of the two bands, observed only in sam-ple 138 T (and not in its corresponding normal tissue sample), was excised from the SSCP gel, purified and sub-jected to mf-LLA to be used as a posi-tive control (Figure 7A, band 3). Se-quencing confirmed the G:C to A:T transition at the first base of codon 12 (bp 129). Randomly chosen samples, which had unaltered mobility patterns, were sequenced and shown to be the same as the wild-type in every case.
DISCUSSION
In this study, we present a modifica-tion of mobility-shift analysis by com-bining this method with multiple fluo-rescence-based detection, or mf-LLA. The efficiency of the mf-LLA assay in detecting mutations was evaluated by subjecting previously known mutants to
Figure 5. mf-LLA limit of detection. Reconstruction experiments were performed in which (A) hprt 9
or (B) hprt 18 mutant sequences were independently mixed with wild-type (WT) sequences in different proportions and subjected to mf-LLA analysis. Electropherograms display JOE-labeled reverse (JOE-rev) modified DNA strands with either biotin-36-dCTP or biotin-36-dUTP analogs incorporated.
Research Report
Figure 6. HRAS mutation polymorphism detection in human gastric cancer specimens. (A) Depicted is a sample result from tumor (T) and corresponding
normal (N) gastric biopsies of three individuals. Electropherograms display FAM-labeled forward (FAM-for) and JOE-labeled reverse (JOE-rev) modified DNA strands with either biotin-36-dCTP or biotin-36-dUTP analogs incorporated. (B) Human HRAS sequence (bp 1611–1810) used as target sequence in this study. The polymorphism C to T in codon 27 (bp 1744) is indicated. Sequences recognized by DNA primers used for mf-LLA assay are underlined.
Color Photo - For position only
A
Research Report
Figure 7. KRAS mutation detection in human lung cancer specimens. (A) A representative sample of tumor (T) and normal (N) lung biopsies of four
indi-viduals is shown. Band 3, used as a positive control, results from 138 T purified DNA, excised from a SSCP gel and subjected to mf-LLA. Electropherograms display FAM-labeled forward (FAM-for) and JOE-labeled reverse (JOE-rev) modified DNA strands with either biot36-dCTP or biot36-dUTP analogs in-corporated. (B) Human KRAS sequence (bp 92–211) used as target sequence in this studies. The G:C to T:A transversion at codon 12 (bp 129) is indicated. Se-quences recognized by DNA primers used for mf-LLA assay are underlined.
Color Photo - For position only
A
mf-LLA analysis. The sensitivity of the mf-LLA assay in detecting mutations in an excess of wild-type sequences was evaluated by performing reconstruction experiments. A prospective study of the utility of this technique to detect HRAS and KRAS mutations in human cancer specimens was also performed.
Efficiency of the mf-LLA Assay in Detecting Single-Base Substitutions
Twenty out of twenty previously known single-base substitutions (100%) were detected regardless of the type and position of the mutation in the se-quence. The type of mutation was easily identified by comparing the characteris-tic set of mobility shifts of both mutant and wild-type DNA strands modified in the presence of either the cytosine or uracil analogs.
A given mutant-modified strand that shifted from the wild-type-modified strand due to the differences in the num-ber of nucleotide analogs, was found to generate an average mobility shift of ap-proximately 4.27 ± 0.33 [mean ±2 stan-dard deviations (SD); sample of 38 mo-bility shifts; range of values (1.79– 5.68); mode 4.06]. However, if a given mutant-modified strand did not differ in the number of nucleotide analogs from the wild-typemodified strand, the aver-age mobility shift generated was 0.60 ± 0.21 [sample of 38 with no mobility shifts; range of values (0.05–2.16); mode 0.12]. The difference between the two means was found to be significant (P <0.002, Student’s t-test). Thus, the easy detection of mobility shifts makes the identification of base substitutions by the mf-LLA assay a quick and sim-ple procedure.
The mf-LLA assay was able to de-tect point mutations even at a fourfold dilution with control DNA (i.e., muta-tions present in at least 25% of the total template population). This level of sen-sitivity is similar to the 20% level shown for other methods, such as PCR-SSCP and direct sequencing (2), al-though detection of a mutant allele by SSCP present in 5% of the total DNA target sequences was reported (22). This level of sensitivity is sufficient for polymorphism detection and inherited-disease causing mutations and some mutations in tumors.
Use of the mf-LLA Assay to Detect Mutations in the KRAS and HRAS Genes of Human Tumor Biopsies
We further evaluated the use of the mf-LLA assay as a method for rapid screening of mutations in human tumor biopsies. We found no mutations in the
HRAS gene for any of the gastric tumor
biopsies, which is in agreement with previous reports showing that mutations in the HRAS, KRAS or NRAS oncogenes are infrequent in gastric cancer (4,11). However, a C:G to T:A transition, previ-ously identified as a polymorphism (1,6), was easily identified even in indi-viduals heterozygous for the mutation. Among 30 individuals studied, 19 (63%) were found heterozygous for both alleles, 2 (6.7%) were found ho-mozygous for the C allele, and 9 (30%) were found homozygous for the T allele. These observations are in agreement with the results described by Hoban et al. (6), in which an observed heterozy-gote frequency of 46% was reported for a population of 60 unrelated individuals. Analysis of twenty human lung car-cinomas by mf-LLA showed one tumor biopsy (5%) to contain a KRAS gene with a G:C to T:A transversion, con-firmed by sequencing to be in codon 12 (bp 129). These results are within the range of 5%–30% reported in indepen-dent studies that used SSCP coupled with PCR or direct sequencing after PCR amplification of the samples (3,7,20,21). Different studies (3,17) have shown that KRAS mutations, espe-cially at codon 12, seem to be associat-ed with a poor prognosis in patients with non-small cell lung carcinomas. The patients whose tumors had a muta-tion were less responsive to therapy and appeared to have a more aggressive dis-ease and shortened survival. An assay such as mf-LLA analysis for popula-tion-based detection of mutations in the
KRAS gene could be useful in
predict-ing tumor behavior. However, because the limit of detection of the mf-LLA as-say is approximately 25%, an assess-ment of the level of sensitivity required to detect KRAS mutations that might correlate with poor prognosis would have to be carried out.
The mf-LLA assay requires the use of an automated DNA sequencer, which is an expensive machine.
How-ever, when a large number of samples are analyzed, the running costs of the assay are considerably lower than when using radioisotopes. The number of samples screened in the same gel can be further increased, for example, by choosing target sequences with differ-ent sizes or with differdiffer-ent colored fluo-rescent tags. Furthermore, the automat-ed entry of data into a computer, which allows for the creation of databases, and immediate processing for analysis is much easier and less error-prone than manual reading of autoradiographs. Therefore, the use of the mf-LLA assay could facilitate the routine analysis of a large number of samples as a part of ge-netic diagnostics.
ACKNOWLEDGMENTS
We are grateful to Dr. Kenneth Livak (PE Applied Biosystems, Foster City, CA) for providing the nucleotide ana-logs with long linker arms and for help-ful discussions and also to Dr. Robert H. Heflich (National Center for Toxico-logical Research, Jefferson, AR) for providing the twenty different hprt/ exon-3 CHO mutants. We are also grateful to Drs. Madalena Ramos (Puli-do Valente Hospital), Manuela Mafra (São José Hospital) and to Drs. Sancia Ramos and Ana Paula Martins (Santa Cruz Hospital) for providing all the sur-gical discards for this study. We are also grateful to Pablo Herrero-Jimenez, at the Center for Environmental Health Sciences in the Massachusetts Institute of Technology, for invaluable insights in the statistical analysis of the data and to Donald McGaffigan for tremendous help in editing the pictures. The authors would also like to acknowledge the “Centro de Malária e Outras Doenças Tropicais/UNL” for use of laboratory equipment. This work was supported by European Community Grant No. EV5V-920197, CIÊNCIA/JNICT Grant No. BD/3890/94 and a grant from Fun-dação Luso-Americana para o Desen-volvimento.
REFERENCES
1.Carneiro, F., R. Seruca, A.C. Ribeiro and
M. Sobrinho-Simões. 1994. An
immunohis-tochemical study of Ras oncoprotein
sion in gastric carcinoma. Cancer 73:2010-2011.
2.Cheng, J. and M. Haas. 1992. Sensitivity of detection of heterozygous point mutations in p53 cDNAs by direct PCR sequencing. PCR Methods Appl. 1:199-201.
3.Cho, J.Y., J.H. Kim, Y.H. Lee, K.Y. Chung,
S.K. Kim, S.J. Gong, N.C. You, H.C. Chung, J.K. Roh and B.S. Kim. 1997.
Cor-relation between KRAS gene mutation and prognosis of patients with non-small cell lung carcinoma. Cancer 79:462-467.
4.Craanen, M.E., P. Blok, B. Top, L.
Boer-rigter, W. Dekker, G.J. Offerhaus, G.N. Tytgat and S. Rodenhuis. 1995. Absence of
RAS gene mutations in early gastric carcino-mas. Gut 37:758-762.
5.Gibbs, R.A., P.-N. Nguyen, L.J. McBride
and S.M. Koepf. 1989. Identification of
mu-tations leading to the Lesch-Nyhan syndrome by automated direct DNA sequencing of in vitro amplified cDNA. Proc. Natl. Acad. Sci. USA 86:1919-1923.
6.Hoban, P.R., M.F. Santibanez-Koref and
A.M. Kelsey. 1991. Polymorphism in exon 1
of the c-Ha-ras gene (HRAS). Nucleic Acids Res. 19:6979.
7.Hsu, N.Y., C.Y. Chen, C.H. Wu, T.J. Liu,
P.C. Kwan, C.P. Hsu, J.Y. Hsia and W.T. Chang. 1996. Detection of KRAS point
muta-tions in codons 12 and 13 in non-small cell lung cancers. J. Formos. Med. Assoc. 95:741-745.
8.Impraim, C.C., R.K. Saiki, H.A. Erlich and
R.L. Teplitz. 1987. Analysis of DNA
extract-ed from formalin-fixextract-ed, paraffin-embextract-eddextract-ed tissues by enzymatic amplification and hy-bridization with sequence-specific oligonu-cleotides. Biochem. Biophys. Res. Commun. 142:710-716.
9.Konecki, D.S., J. Brennand, J.C. Fuscoe,
C.T. Caskey and A.C. Chinault. 1982.
Hy-poxanthine-guanine phosphoribosyltransfer-ase genes of mouse and Chinese hamster: con-struction and sequence analysis of cDNA recombinants. Nucleic Acids Res. 10:6763-6775.
10.Kornher, J.S. and K.J. Livak. 1989. Muta-tion detecMuta-tion using nucleotide analogs that al-ter electrophoretic mobility. Nucleic Acids Res. 17:7779-7784.
11.Koshiba, M., O. Ogawas, T. Habuchi, S.
Hamazaki, T. Shimada, R. Takahashi and T. Sugiyama. 1993. Infrequent ras mutations
in human cancers. Jpn. J. Cancer Res. 84:163-167.
12.Li, E.E., R.H. Heflich and K.B. Delclose. 1993. Trans-1,2-dihydro-1,2-dihydroxy-6-aminochrysene is metabolized to form a major adduct with deoxyguanosine and produces mutations in the hprt gene of Chinese hamster ovary cells at G:C base pairs. Carcinogenesis 10:2109-2114.
13.Livak, K.J., F.W. Hobbs and R.J. Zagursky. 1992. Detection of single base differences us-ing biotinylated nucleotides with very long linker arms. Nucleic Acids Res. 20:4831-4837.
14.Manjanatha, M.G., L.A. Lindsey, R.A.
Mit-tlestaedt and R.H. Heflich. 1994. Low hprt
mRNA levels and multiple hprt mRNA species in 6-thioguanine-resistant Chinese
hamster cell mutants possessing nonsense mu-tations. Mutat. Res. 308:65-75.
15.Manjanatha, M.G., R.K. Newton, R.A.
Mit-telstaedt, R.D. Villani, K.B. Declos and R.H. Heflich. 1993. Molecular analysis of
DNA adducts and hprt mutations produced by 6-nitrosochrysene in Chinese hamster ovary cells. Carcinogenesis 9:1863-1870.
16.Newton, R.K., R.A. Mittelstaedt and R.H.
Heflich. 1992. Analysis of solvent control and
1-nitrosopyrene-induced Chinese hamster ovary cell mutants by Southern and Northern blots and the polymerase chain reaction. Envi-ron. Mol. Mutagen. 19:147-155.
17.Slebos, R.J.C., R.E. Kibbelaar, O. Dalesio,
A. Kooistra, J. Stam, C.J. Meijer, S.S. Wa-genaar, R.G. Vanderschueren et al. 1990.
KRAS oncogene activation as a prognostic marker in adenocarcinoma of the lung. N. Engl. J. Med. 323:561-565.
18.Sullivan, K.M., K.M. Sullivan, S. Pope, P.
Gill and J.M. Robertson. 1992. Automated
DNA profiling by fluorescent labeling of PCR products. PCR Methods Appl. 2:34-40. 19.Taparowsky, E., S. Yolande, F. Ottavio, K.
Shimizu, M. Goldfarb and M. Wigler. 1982.
Activation of the T24 bladder carcinoma transforming gene is linked to a single amino acid. Nature 300:762-765.
20.Victor, T., R. Du Toit, A.M. Jordaan, A.J.
Bester and P.D. van Helden. 1990. No
evi-dence for point mutations in codons 12, 13, and 61 of the RAS gene in a high-incidence are for esophageal and gastric cancers. Cancer Res. 50:4911-4914.
21.Visscher, D.W., S. Yadrandji, P. Tabaczka,
M. Kraut and F.H. Sarkar. 1997.
Clinico-pathologic analysis of KRAS, p53, and ERBB-2 gene alterations in pulmonary adeno-carcinoma. Diagn. Mol. Pathol. 6:64-69. 22.Wu, J.K., Z. Ye and B.T. Darras. 1993.
Sen-sitivity of single-strand conformation poly-morphism (SSCP) analysis in detecting p53 point mutations in tumors with mixed cell pop-ulations. Am. J. Hum. Genet. 52:1273-1275.
Received 20 July 1998; accepted 24 February 1999.
Address correspondence to:
Dr. Luisa A. Marcelino
Center for Environmental Health Sciences Room 16-771
Massachusetts Institute of Technology 25 Ames Street
Cambridge, MA 02139, USA Internet: [email protected]