www.ambi-agua.net E-mail: ambi.agua@gmail.com
This is an Open Access article distributed under the terms of the Creative Commons Attribution License, which permits unrestricted use, distribution, and reproduction in any medium, provided the original work is properly cited.
Future scenarios of thermal bioclimatic conditions in a humid tropical
city under urban development
ARTICLES doi:10.4136/ambi-agua.2092
Received: 07 Feb. 2017; Accepted: 08 Jul. 2018
Vicente de Paulo Rodrigues da Silva1*; Joel Silva Santos2;
Eduardo Rodrigues Viana de Lima2; Romildo Morant de Holanda3;
Enio Pereira de Sousa1; Lincoln Eloi de Araújo2
1Universidade Federal de Campina Grande (UFCG), Campina Grande, PB, Brasil
Departamento de Ciências Atmosféricas (DCA). E-mail: vicente.paulo@ufcg.edu.br, enio.souza@ufcg.edu.br 2Universidade Federal da Paraíba (UFPB), João Pessoa, PB, Brasil
Departamento de Engenharia e Meio Ambiente (DEMA). E-mail: joelgrafia.santos@gmail.com, eduvianalima@gmail.com, lincolneloi@yahoo.com.br
3Universidade Federal Rural de Pernambuco (UFRPE), Recife, PB, Brasil Departamento de Tecnologia Rural (DTR). E-mail: romildomorant@gmail.com
*Corresponding author
ABSTRACT
Urbanization modifies the heat balance in urban areas and has negative effects on landscape, aesthetics, energy efficiency, human health and the inhabitants’ quality of life. This work evaluated future scenarios of bioclimatic conditions for João Pessoa, a humid tropical city in Northeast Brazil. The scenarios were determined based on trends in air temperature, relative humidity and wind speed for the time period from 1968 to 2015. The study was performed for two distinct periods of three months each (dry and wet seasons) using data from weather stations equipped with thermo-hygrometers and cup anemometers located in nine representative areas of the city. Trends in air temperature, relative humidity, wind speed, and effective temperature index (ET index) time series were evaluated using the Mann-Kendall test. Results indicated that the air temperature showed an increasing trend of 0.34°C/decade, whereas the relative humidity showed a decreasing trend of 0.49%/decade and the wind speed values ranged from 1.3 ms-1 to 3.80 ms-1. These trends are statistically significant according to the Mann-Kendall test (p<0.05). The air temperature increased between the 1980s and 2010s, which corresponds to a period of rapid urbanization of the city. Future environmental conditions in João Pessoa will be determined in accordance with the urbanization processes.
Keywords: Mann-Kendall test, thermal comfort, urban climate.
Cenários futuros das condições bioclimáticas térmicas de uma cidade
tropical úmida sob o aspecto de desenvolvimento urbano
RESUMO
Rev. Ambient. Água vol. 13 n. 5, e2092 - Taubaté 2018
do Brasil. Os cenários foram determinados com base nas tendências da temperatura do ar, velocidade do vento e da umidade relativa para o período de 1966 a 2015. Este estudo foi realizado durante dois períodos distintos de três meses cada (estação seca e estação úmida) usando dados da estação meteorológica equipada com um sistema termo-higrômetro e anemômetro de concha localizados em 9 áreas representativas da cidade. A tendência nas séries temporais de temperatura do ar, umidade relativa, velocidade do vento e do índice de temperatura efetiva (ET índice) foi avaliada usando o teste de Mann-Kendall. Os resultados indicaram que a temperatura do ar mostra uma tendência crescente de 0,34°C /década, enquanto a umidade relativa apresenta uma tendência decrescente de 0,49% /década e os valores da velocidade do vento variam de 1,3 ms-1 a 3,80 ms-1. Essas tendências são estatisticamente significativas de acordo com o teste de Mann-Kendall (p <0,05). A temperatura do ar aumentou entre os anos de 1980 e 2010, o que corresponde a um período de rápida urbanização da cidade. As futuras condições ambientais em João Pessoa serão determinadas de acordo com o processo de urbanização.
Palavras-chave: clima urbano, conforto térmico, teste de Mann-Kendall.
1. INTRODUCTION
Since microclimatic conditions have a major influence on people’s comfort, the issue of outdoor thermal comfort has attracted wide attention in recent years. An estimated three billion people living in urban areas throughout the world are directly exposed to problems related to urban heat island intensity (UHI), which are expected to increase significantly in the near future (Tong et al., 2005; Memon et al., 2008). Several studies have addressed this theme in several different urban climates due to the worldwide severity of the problem, and a wide range of literature is available on the subject (Silva et al., 2010; Salvati et al., 2017; Lobaccaro et al., 2017; Rafael et al., 2017).
Rev. Ambient. Água vol. 13 n. 5, e2092- Taubaté 2018
The basic hypothesis of this study is that changes in land from green areas to impervious surfaces in a city affect the absorption of solar energy, and changes in wind speed patterns due to buildings results in changes in air temperature and, consequently, changes in human discomfort perception. Since over 50% of the world’s population live in urban areas, it is important to be able to project future bioclimatic conditions in outdoor spaces. Our study predicts future thermal comfort scenarios for the studied region based on changes in air temperature and relative humidity. This analysis is broadly divided into trend and regression analyses for obtaining the spatial configuration of thermal comfort during dry and rainy seasons. This work provides residents, city planners and governments with a methodology that supports the development of a more comfortable city area.
2. MATERIALS AND METHODS
2.1. Study area
The city of João Pessoa is located at latitude -7º14’29” and longitude -34º47’36” in the tropical humid climate of Brazil. The predominant vegetation type is Atlantic Forest fragments. The city is bounded by the Atlantic Ocean to the east and experiences the influence of several important large-scale precipitation mechanisms due to its location, such as the Atlantic intertropical convergence zone, upper air cyclonic vortex and cold fronts (Kolotroni and Giridharan, 2008). João Pessoa lies on a relatively flat coastal plain and has an average elevation of 33 m. The annual average temperature ranges between 21°C and 31°C, and the normal annual rainfall is approximately 1800 mm (Silva et al., 2006). The dry season generally occurs between January and June, and the rainy season occurs between July and December. The meteorological data for trend analysis in wind speed, air temperature and relative humidity were provided by the Brazilian National Institute of Meteorology (Inmet, in Portuguese). Before conducting the analysis, the quality and adequacy of data were assessed. The data at each measurement site were acquired at hourly intervals.
2.2. Measurements
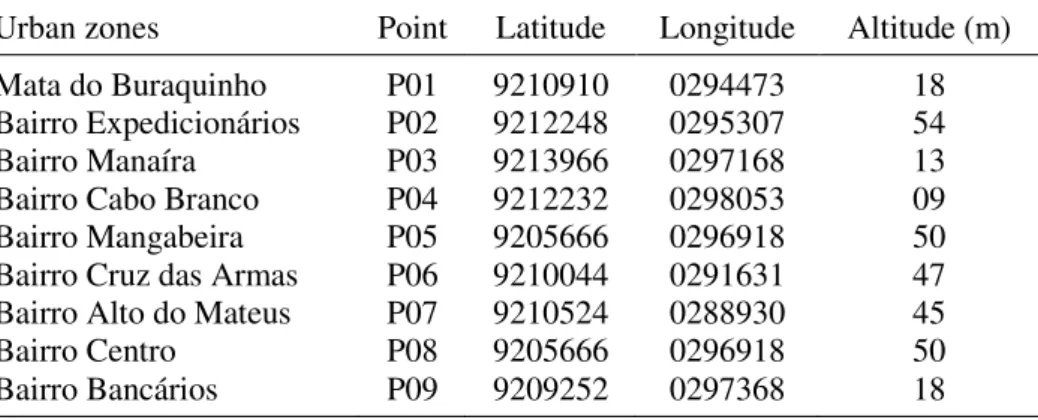
Measurements of air temperature, relative humidity and wind speed were performed in nine zones that were chosen to represent the most densely populated areas and various types of land cover in the urban spaces and rural areas surrounding the city (Table 1). Mata do Buraquinho (P01) was adopted as the reference area in this study due to its high-density Atlantic forest vegetation. This vegetation type clearly distinguishes that site from the other observational areas, whose locations are surrounded by high and low buildings that shade them during certain periods of the day.
Table 1. Measurement points within the city of João Pessoa, Brazil. The latitudes and longitudes are shown using the Universal Transverse Mercator (UTM) geographic coordinate system. Altitudes are shown in meters.
Urban zones Point Latitude Longitude Altitude (m)
Mata do Buraquinho P01 9210910 0294473 18
Bairro Expedicionários P02 9212248 0295307 54
Bairro Manaíra P03 9213966 0297168 13
Bairro Cabo Branco P04 9212232 0298053 09
Bairro Mangabeira P05 9205666 0296918 50
Bairro Cruz das Armas P06 9210044 0291631 47
Bairro Alto do Mateus P07 9210524 0288930 45
Bairro Centro P08 9205666 0296918 50
Rev. Ambient. Água vol. 13 n. 5, e2092 - Taubaté 2018
Davis Weather Stations were installed at nine points throughout the city and were supplied with anemometers and thermo-hygrometers for measurements of wind speed, air temperature and relative humidity (Figure 1). The data at each measurement site were recorded hourly. The
field measurements were performed at the urban and rural areas from January 5th to March 12th, 2015 (representing the dry season) and from June 5th to August 24th, 2015 (representing the rainy season). In addition, daily data of air temperature, relative humidity and rainfall from a typical meteorological observation station during the period of 1968-2015 were used to conduct a comprehensive temporal analysis. An analysis was performed to investigate the influence of various land use types that cause an increase in urban temperature. The percentage of land cover was obtained according to the methodology presented by Katzschner et al. (2006) for the following land cover types: (i) ceramic roof tile; (ii) asbestos roof tiles; (iii) aluminum roof tiles; (iv) body of water 1 (swimming pool); (v) body of water 2 (rivers and sea); (vi) asphalt pavement; (vii) concrete pavement; (viii) bare soil; (ix) bare soil + low vegetation; and (x) vegetation.
Figure 1. Locations of the measurement points and the meteorological station (INMET) within the study area. The latitudes and longitudes are shown using the Universal Transverse Mercator (UTM) geographic coordinate system. Altitudes are shown in meters.
2.3. Comfort index
Rev. Ambient. Água vol. 13 n. 5, e2092- Taubaté 2018
𝐸𝐸𝐸𝐸= 37− 37−𝑇𝑇
0.68−0.0014𝑅𝑅𝑅𝑅+ 1
1.7+1.4𝜗𝜗0.75
−0.29𝐸𝐸(1−0.01𝑅𝑅𝑅𝑅) (1)
where υ is wind speed (m s-1) at 1.2 m above the ground, Tis air temperature (°C) and RH
is relative humidity (%). The ET index is suitable for open spaces and describes the extent of thermal loading under several meteorological conditions.
2.4. Mann-Kendal test
The World Meteorological Organization (WMO) recommends using the Mann‐Kendall
nonparametric test (Mann, 1945; Kendall, 1975) for assessing trends in environmental time series data. This test consists of comparing each value of a time series with the remaining values in sequential order. The number of instances for which the remaining terms are greater than that being analyzed is counted. This test is based on the statistic S, which is defined as (Equation 2):
𝑆𝑆= ∑𝑛𝑛𝑖𝑖=1∑ 𝑠𝑠𝑠𝑠𝑠𝑠𝑠𝑠 (𝑥𝑥𝑖𝑖 − 𝑥𝑥𝑗𝑗) (2)
where xi to xj are the sequential data values, n is the length of the time series and the sign of (𝑥𝑥𝑖𝑖− 𝑥𝑥𝑗𝑗) is -1 for (𝑥𝑥𝑖𝑖 − 𝑥𝑥𝑗𝑗) < 0, 0 for (𝑥𝑥𝑖𝑖 − 𝑥𝑥𝑗𝑗) = 0, and 1 for (𝑥𝑥𝑖𝑖− 𝑥𝑥𝑗𝑗) > 0. The mean E[S]
and variance V[S] of statistic S are given as (Equations 3 and 4):
𝐸𝐸[𝑆𝑆] = 0 (3)
𝑉𝑉𝑉𝑉𝑉𝑉[𝑆𝑆] = 𝑛𝑛(𝑛𝑛−1)(2𝑛𝑛+5)−∑ 𝑡𝑡𝑝𝑝(𝑡𝑡𝑝𝑝−1)(2𝑡𝑡𝑝𝑝+5) 𝑞𝑞
𝑝𝑝=1
18 (4)
where tp is the number of equal occurrences for the pth value, and q is the number of equal values. The second term represents an adjustment for equal or censored data. The standardized test statistic (ZMK) is computed as Equation 5.
𝑍𝑍𝑀𝑀𝑀𝑀 =
⎩ ⎪ ⎨ ⎪
⎧�𝑉𝑉𝑉𝑉𝑉𝑉𝑆𝑆−1 (𝑆𝑆)𝑠𝑠𝑖𝑖𝑆𝑆> 0 0 𝑠𝑠𝑖𝑖𝑆𝑆= 0
𝑆𝑆+1
�𝑉𝑉𝑉𝑉𝑉𝑉 (𝑆𝑆)𝑠𝑠𝑖𝑖𝑆𝑆< 0
(5)
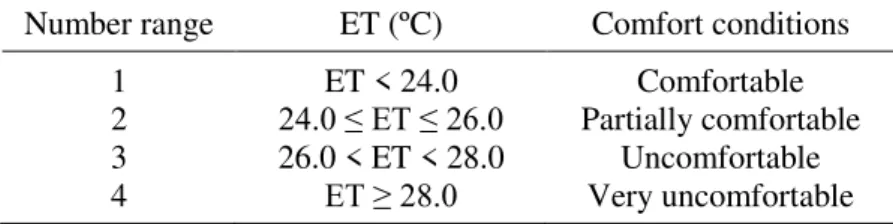
Comfort condition was established using the ET index with the objective of proposing the comfort limits valid for the study area. A thermal sensation assessment test based on responses from structured questionnaires was used for obtaining the rating scales ranging from uncomfortable to comfortable (Table 2). A similar methodology was applied by Krüger and Drach (2017) to define ranges and performance of UTCI (Universal Thermal Climate Index) in downtown Rio de Janeiro.
Rev. Ambient. Água vol. 13 n. 5, e2092 - Taubaté 2018
Table 2. Effective temperature index (ET) classification range adjusted to the climatic conditions of the city of João Pessoa.
Number range ET (ºC) Comfort conditions
1 ET < 24.0 Comfortable
2 24.0 ≤ ET ≤ 26.0 Partially comfortable
3 26.0 < ET < 28.0 Uncomfortable
4 ET ≥ 28.0 Very uncomfortable
3. RESULTS AND DISCUSSION
The occurrence of maximum and minimum values of the ET index and the thermal variations during both the dry and rainy seasons are summarized in Table 3. The maximum and the minimum air temperature are not substantially different in both seasons. The thermal amplitude varies from 9.6 to 10.8°C during the dry season and from 9.5to 11.5°Cduring the rainy season. During the rainy season, a temperature maximum occurs at point P08, and a minimum occurs at points P04 and P05. The air temperature increases rapidly in the mornings and reaches a maximum at approximately 14:00 LT (local time). The relative humidity shows an inverse relationship with temperature: the relative humidity decreases quickly from the early morning hours, and the lowest values are observed concurrent with the highest temperatures. The variability in these parameters corresponds to minimum ET values during the first hour of the day; this effect is most pronounced on January 24th during the dry season and on August 16th during the rainy season. The thermal perception commonly indicates a greater level of discomfort during the daytime in tropical regions with a maximum level of discomfort between 11:00 to 15:00 LT. Accordingly, heat stress increases until approximately 14:00 LT, although local differences occur between the seasons. Similar results were obtained by Gulyás et al. (2006), who assessed the microclimatic and human comfort conditions of the urban environment of a small city in Hungary.
The reference point (P01) has the highest density of vegetation and lowest ET during both seasons (Mata do Buraquinho). Although point P03 (Manaíra) is located near the beach, this site has the highest ET value (Table 4) due to a low percentage of type IX land cover (vegetation) and a high percentage of concrete pavement and ceramic roofing tiles (Table 5). This result does not agree with the observations of Xu et al. (2010), who found that a water body can effectively improve the human comfort level in the littoral zone during the high-temperature period of a hot summer day. This difference can be attributed to multiple factors, including the amount of impermeable areas with asphalt and concrete pavement, the number of high buildings and the lack of vegetation.
Rev. Ambient. Água vol. 13 n. 5, e2092- Taubaté 2018 Table 3. Time of occurrence of the maximum and minimum Effective Temperature index (ET) values and the thermal amplitude during the dry and rainy seasons for the study area in 2015.
Points Effective temperature index (ET) (°C) Thermal amplitude (°C) Maximum value Minimum value
Date Hour Date Hour
Dry season
P01 March 10 11:00:00 February 28 05:00:00 09.9
P02 February 2 13:00:00 February 13 09:00:00 09.7 P03 February 25 14:00:00 January 24 06:00:00 10.6
P04 March 10 14:00:00 January 24 05:00:00 10.2
P05 February 25 11:00:00 January 24 05:00:00 09.8 P06 February 19 13:00:00 January 24 05:00:00 10.7 P07 February 25 13:00:00 January 24 05:00:00 10.8 P08 February 25 14:00:00 January 24 05:00:00 09.9 P09 February 25 13:00:00 January 24 05:00:00 10.6
Rainy season
P01 June 23 11:00:00 August 16 06:00:00 10.6
P02 June 23 12:00:00 August 16 06:00:00 09.8
P03 August 4 14:00:00 August 16 06:00:00 09.9
P04 June 23 13:00:00 August 16 06:00:00 09.5
P05 June 23 10:00:00 August 16 06:00:00 09.5
P06 June 7 15:00:00 August 16 06:00:00 10.2
P07 June 23 13:00:00 August 16 05:00:00 10.9
P08 August 4 13:00:00 August 16 06:00:00 11.5
P09 June 21 13:00:00 August 16 06:00:00 10.4
Table 4. Average, maximum (Max) and minimum (Min) values of air temperature, relative humidity and Effective Temperature index (ET) during the dry and rainy seasons for the study area.
Points Air temperature (
oC) Relative humidity (%) ET (oC)
Average Max Min Average Max Min Average Max Min Dry season
P01 27.2 28.6 24.1 81.5 100.0 70.7 25.7 26.6 24.2
P02 27.7 28.9 24.3 76.6 97.7 68.4 25.9 26.9 24.2
P03 28.8 30.1 24.9 77.1 98.2 68.2 26.9 27.9 24.8
P04 28.4 29.6 24.8 75.6 95.8 67.2 26.4 27.4 24.5
P05 27.7 28.8 24.5 78.7 97.6 70.8 26.1 27.0 24.3
P06 27.7 29.1 24.2 78.4 99.3 68.8 26.0 26.9 24.2
P07 27.7 29.0 24.4 79.1 98.4 69.3 26.0 27.0 24.3
P08 27.7 29.1 24.4 79.0 99.1 70.1 26.1 27.1 24.4
P09 28.2 29.4 24.6 75.3 95.6 65.5 26.2 27.1 24.4
Average 27.9 29.2 24.4 77.9 98.0 68.7 26.1 27.1 24.3 Rainy season
P01 24.3 25.2 23.0 89.8 100.0 77.9 23.4 24.2 22.8
P02 24.9 26.1 22.7 86.0 99.6 74.7 24.0 25.5 22.7
P03 25.4 27.6 22.9 81.7 96.9 68.6 24.2 25.8 22.7
P04 25.2 26.8 22.9 83.5 97.5 69.5 24.1 25.6 22.8
P05 24.9 27.0 22.5 85.9 100.0 73.2 24.0 25.7 22.5
P06 25.1 26.7 22.7 85.0 99.2 72.5 24.0 25.6 22.7
P07 25.1 27.0 22.7 84.0 99.3 72.6 24.0 25.7 22.7
P08 25.2 27.3 22.7 83.9 98.9 72.8 24.1 25.5 22.8
P09 25.4 28.0 22.7 86.3 100.0 73.0 24.4 26.2 22.8
Rev. Ambient. Água vol. 13 n. 5, e2092 - Taubaté 2018
Table 5. Percentages of land cover for each observation point.
Land cover P01 P02 P03 P04 P05 P06 P07 P08 P09
Type I 1.23 44.06 34.21 16.90 51.12 74.97 26.19 18.38 60.48
Type II 0.08 1.40 5.13 4.57 0.77 0.34 2.46 7.52 0.00
Type III 0.00 1.51 2.37 0.91 1.79 0.11 0.58 2.89 0.29
Type IV 1.04 0.34 0.29 0.56 0.01 0.00 0.00 0.07 0.02
Type V 0.00 0.00 0.00 0.00 0.00 0.00 0.00 0.00 0.00
Type VI 1.72 4.27 5.34 8.66 3.83 0.00 2.28 11.28 9.59
Type VII 0.00 24.25 40.00 29.97 22.12 0.14 21.23 39.66 6.26
Type VIII 11.9 4.49 4.20 8.14 8.81 5.87 36.50 6.37 7.74
Type IX 84.84 19.69 8.46 30.28 11.55 18.78 10.74 13.83 15.61
Type V land cover is absent, whereas type IV cover is rare within the study area. Therefore, bodies of water do not produce positive effects on an individual’s thermal perception. The quality and quantity of land cover affects the balance of energy of humans, and thus has strong implications for thermal comfort. In addition, different types of land cover have complex surface structures that determine the specific microclimatic qualities of an environment. The effect of vegetation on microclimates during the daytime results from the reduced penetration of solar radiation to the ground and through the walls due to partial shading (Hassaan and Mahmoud, 2011).
Asphalt (Type VI) and concrete (Type VII) pavement produced microclimate effects, and therefore contributed to an increase in the ET at points P03, P04 and P05. These pavement materials absorb solar and infrared radiation and dissipate a portion of the accumulated heat to the atmosphere via convective and radiative processes, thereby increasing the ambient temperature (Akbari et al., 2001). João Pessoa is a coastal city with a warm and humid climate, and therefore building–system interactions play a significant role in thermal comfort. This study demonstrated that areas with a high density of ceramic roofing tiles and asphalt pavement have the highest temperatures and ET values, which are related to the thermal properties of these structures. In contrast, the most comfortable areas in the city were closest to vegetated areas, which had comfort levels similar to those of the rural area (Mata do Buraquinho). According to Table 4, the average air temperature, the relative humidity and the ET index at each analyzed point for both seasons throughout 2015 showed thermal perception ratios that were clearly outside the comfort zone, according to the adjusted ET range. The exception to this trend was the reference point (rural area) during the rainy season. The minimum values of the ET index in the mornings were in the comfortable and partially comfortable ranges during the rainy and dry seasons, respectively. However, in the afternoons, the maximum ET values were uncomfortable during the dry season and varied from partially comfortable to uncomfortable during the rainy season.
Rev. Ambient. Água vol. 13 n. 5, e2092- Taubaté 2018
Complex urban environments can result in very different and often extreme comfort sensations even within short distances (Gulyás et al., 2006). These differences are statistically significant according to the Mann-Kendall test (p<0.05). The air temperature increased between the 1980s and the 2010s, which corresponds to a period of rapid urbanization in this city. These trends were used to determine future scenarios of thermal comfort conditions and to compare these predictions to the comfort limits specified by current standards. These findings are particularly important because specific meteorological conditions, including high temperatures, low cloud cover, and low average wind speeds, tend to intensify the heat island effect. To quantify the bioclimatic conditions throughout the study area, air temperature and relative humidity trends from meteorological stations close to an urban area were used to assess the impact of urban development on thermal stress. Figure 2 shows the trends in air temperature and relative humidity in the study area for the period 1968-2015. Air temperature shows an
increasing trend of 0.34°C/decade, whereas relative humidity shows a decreasing trend of 0.49%/decade, as calculated using annual mean data.
Figure 2. Trends in air temperature and relative humidity in the study area for the period of 1968-20115.
Trend in wind speed in João Pessoa during analyzed periods is shown in Figure 3. The seasonal wind speed pattern in the study area is increasing with a trend of 0.15 ms-1/decade. This trend is statistically significant according to the Mann-Kendall test at the 5% confidence level. Wind speed values range from a minimum of 1.3 ms-1 to a maximum of 3.80 ms-1 with average ± standard deviation of 2.91 ± 0.61 ms-1. When discussing the effects of urban design and meteorological parameters on thermal comfort for pedestrians at street level, Kleerekoper et al. (2017) observed that wind is among the four main thermal comfort indicators, and is therefore an important parameter to be used in any urban climate index. Using the Mann-Kendall test for analyzing climate trends on the extreme winds in Brazil, Pes et al. (2017) observed that trends in minimum wind speed series are not conclusive because they show disparate results between homogeneous regions.
Rev. Ambient. Água vol. 13 n. 5, e2092 - Taubaté 2018
humidity of 0.10%/year, both statistically significant at p<0.01 level. He also observed an increasing trend in Class A pan evaporation and reference evapotranspiration, which are indicative of a decreasing trend in wind speed. The results of the present study agree with those reported by Silva (2004). When analyzing the spatiotemporal impact of land use and land cover changes on urban heat islands in Maranhão State, Brazil, Silva et al. (2018) observed that many areas experienced extensive urbanization over the 16-year study period, which resulted in the loss of green spaces and increased urban heat island.
Figure 3. Trends in air wind speed in the study area for the period of 1968-20115.
The spatial distribution of the human thermal comfort level in João Pessoa for current climate conditions and for the 2020s, the 2030s, the 2040s, the 2050s and the 2060s are depicted for both the dry and rainy seasons in Figures 4 and 5, respectively. It is apparent that there is a large discrepancy in the thermal sensations between the two seasons. For the current weather conditions, the areas surrounding point P01 are partially comfortable, whereas the remainder of the city is uncomfortable during the dry season (Figure 4A). Except for the comfortable level of the reference area (point P01), the city is partially comfortable during the rainy season (Figure 5A). In the coastal area, large differences in the air temperature and ET index occur during the dry season relative to the rainy season. For the dry season, results for the scenarios from the 2020s to the 2050s indicate that the entire city is uncomfortable during the dry season due to a sensation of heat that varies between approximately 27°C (point P01) and 30°C (point P03). For the scenario in the 2060s (Figure 4F), points P03 and P04 became very uncomfortable, with air temperatures in the range 28.9-30.5°C, and the remaining area is uncomfortable. Thermal conditions during the rainy season will tend to be less rigorous for the scenarios from the 2020s to the 2050s. Because building–system interactions play a significant role in thermal perception, it is reasonable that points P02 and P03 show a high discomfort level. The intensity of external heat loads in these areas is more dependent on the solar radiation and orientation of the building (east–west or north–south) than on wind speed. Although wind is an important factor for mitigating the heat stress of an urban area, the obstacles created by high-rise buildings prevent the flow of wind from the ocean.
Rev. Ambient. Água vol. 13 n. 5, e2092- Taubaté 2018
whereas the coastal area (points P03, P04 and P09) changes from partially comfortable to uncomfortable. This indicates an overall difference of 5.5% and 6.4% during dry and rainy seasons, respectively. The temperature in the coastal area is primarily influenced by buildings and asphalt pavement that trap solar radiation. In contrast, the air temperature at the reference area is influenced by vegetation that maintains a temperature lower than that in the other areas of the city as a consequence of evapotranspiration by abundant vegetation. The relatively comfortable areas within the city for both current weather conditions and future scenarios are those closer to vegetation. Point P02 is the second-most comfortable area among the measuring points, which may be attributable to the green areas surrounding the reference point. In summary, the area of comfortable conditions surrounding point P01 appears during dry and rainy seasons due to evapotranspiration by native vegetation, which results in lower temperatures in comparison to other points in the city.
Inversely, uncomfortable conditions near point P03 are caused by heat that is accumulated by the impervious surfaces or building materials (e.g., concrete and asphalt) during the day. This result agrees with the observations of Hassaan and Mahmoud (2011) who analyzed the microclimatic and human comfort conditions in an urban park in hot and arid regions. They documented that the thermal requirements of people and the qualities of the local climate should be carefully considered when designing the landscapes of urban parks in hot and arid regions. The temperatures were found to be highest near the coastal area, and the temperature gradient increases from the coastal area towards the reference point. The horizontal surface temperature gradient can be used to determine the cooling effect of vegetation relative to the urban effect. Air temperature has been increasing at a rate of 0.034°C/year during the last 48 years with predicted values as high as 30.5°Cin the 2060s. The maximum predicted value is only 28.9°C at the reference point, in agreement with the presence of vegetation. There is a sharp increase in the ET values at point P03 when the ET reaches very uncomfortable conditions in the 2050s, whereas the remaining area has uncomfortable conditions during the dry season.
The highest recorded air temperature at points P03, P04 and P09 are attributable to different types of cover, such as aluminum roofing tiles, asphalt pavement and concrete pavement. A major problem associated with the use of those materials in warm weather is that they absorb and retain enormous amounts of heat, which leads to an increase in air temperature. Therefore, the level of human thermal comfort has been increasing throughout these areas due to the substitution of vegetation for building materials. These data indicate that the range of ET index corresponds to a thermal sensation between uncomfortable in the dry season and comfortable/partially comfortable in the rainy season for the current weather conditions. This study indicates that physiological responses are determined primarily by changes in air temperature.
Rev. Ambient. Água vol. 13 n. 5, e2092 - Taubaté 2018
Rev. Ambient. Água vol. 13 n. 5, e2092 - Taubaté 2018
Figure 6. Spatial distribution of air temperatures in 2015 during the rainy (A) and dry (B) seasons within the study area.
Although points P03 and P04 are located near the coastal zone, they have an uncomfortable condition according to the adjusted ET index. The combined effects of high temperature, high moisture content and changes in the urban landscape can explain these results. Another reason for the high thermal conditions is that the surface materials in that zone have a high albedo, which reflects a large amount of radiation to the surrounding objects; that area is also not surrounded by any vegetation. Although studies have shown that areas 10–20 m from the water’s edge show the greatest improvement in thermal comfort (Xu et al., 2010) changes in the biodiversity and aesthetics of urban landscapes in littoral areas can have a synergistic effect, thereby reducing the effects of the water body on human thermal comfort.
4. CONCLUSIONS
Rev. Ambient. Água vol. 13 n. 5, e2092- Taubaté 2018
5. REFERENCES
AKBARI, H.; POMERANTZ, M.; TAHA, H. Cool surfaces and shade trees to reduce energy use and improve air quality in urban areas. Solar Energy, v. 70, n. 1, p. 295-310, 2001. GULYÁS, A.; UNGER, J.; MATZARAKIS, A. Assessment of the microclimatic and human
comfort conditions in a complex urban environment: Modeling and measurements. Building and Environment, v. 41, p. 1713-1722, 2006.
HAN, J.; YANG, W.; ZHOU, J.; ZHANG, G.; ZHANG, Q.; MOSCHANDREAS, D. J. A. Comparative analysis of urban and rural residential thermal comfort under natural ventilation environment. Energy Building, v. 41, p. 139-145, 2009.
HASSAAN, A.; MAHMOUD, A. Analysis of the microclimatic and human comfort conditions in an urban park in hot and arid regions. Building and Environment, v. 46, p. 2641-2656, 2011.
JUSUF, S. K.; WONG, N. H.; HAGEN, E.; ANGORRO, R.; HONG, Y. The influence of land use on the urban heat island in Singapore. Habitat International, v. 31, p. 232-242, 2007. KATZSCHNER, L.; BOSCH, U.; RÖTTGEN, M. Behaviour of people in open spaces in dependence of thermal comfort conditions. In: CONFERENCE ON PASSIVE AND LOW ENERGY ARCHITECTURE, 23., 2006, Proceedings… Genève: Université de Genève, 2006.
KENDALL, M. G. Rank correlation measures. London: Charles Griffin, 1975. 220p.
KLEEREKOPER, L.; TALEGHANI, M.; VAN DEN DOBBELSTEEN, A.; HORDIJK, T. Urban measures for hot weather conditions in a temperate climate condition: A review study. Renewable and Sustainable Energy Reviews, v. 75, p. 515–533, 2017.
KOLOTRONI, M.; GIRIDHARAN, R. Urban heat island intensity in London: an investigation of the impact of physical characteristics on changes in outdoor air temperature during summer. Solar Energy, v. 82, p. 986-988, 2008.
KRÜGER, E. L.; MINELLA, F. O.; RASIA, F. Impact of urban geometry on outdoor thermal comfort and air quality from field measurements in Curitiba, Brazil. Building and Environment,v. 46, p. 621-634, 2011.
KRÜGER, E. L.; DRACH, P. R. C. Interferências do fator cor da pele na percepção térmica de transeuntes. Ambiente Construído, v. 17, n. 1, p. 83-96, 2017.
LI, P.W.; CHAN S. T. Application of a weather stress index for alerting the public to stressful weather in Hong Kong. Journal of Climate and Applied Meteorology, v. 7, p. 369-375, 2000.
LOBACCARO, G.; CARLUCCI, S.; CROCE, S.; PAPARELLA, R.; FINOCCHIARO, L. Boosting solar accessibility and potential of urban districts in the Nordic climate: A case study in Trondheim. Solar Energy, v. 149, p. 347-369, 2017.
MANN, H. B. Econometrica. The econometric society, v. 13, p. 245-259, 1945.
Rev. Ambient. Água vol. 13 n. 5, e2092 - Taubaté 2018
MEMON, R. A.; LEUNG, D. Y. C.; CHUNHO, L. A review on the generation, determination and mitigation of Urban Heat Island. Journal of Environmental Sciences, v. 20, p. 120-128, 2008.
PES, M. P.; PEREIRA, E. B.; MARENGO, J. A.; MARTINS, F. R.; HEINEMANN, D.; SCHMIDT, M. Climate trends on the extreme winds in Brazil. Renewable Energy, v. 109, p. 110-120, 2017.
RAFAEL, S.; MARTINS, H.; MARTA-ALMEIDA, M.; SÁ, E.; COELHO, S.; ROCHA, A. et al. Quantification and mapping of urban fluxes under climate change: Application of WRF-SUEWS model to Greater Porto area (Portugal). Environmental Research, v. 155, p. 321-344, 2017.
ROBAA, S. M. Thermal Human Comfort in Egypt. International Journal of Meteorology, v. 283, p. 359-371, 2003.
SALVATI, A.; ROURA, H. C.; CECERE, C. Assessing the urban heat island and its energy impact on residential buildings in mediterranean climate: Barcelona case study. Energy and Buildings, v. 146, p. 38-54, 2017.
SILVA, V. P. R. On climate variability in Northeast of Brazil. Journal of Arid Environments, v. 58, p. 575-596, 2004.
SILVA, V. P. R.; SOUSA, F. A. S.; CAVALCANTI, E. P.; SOUZA, E. P.; SILVA, B. B. Teleconnections between sea-surface temperature anomalies and air temperature in northeast Brazil. Journal of Atmospheric and Solar-Terrestrial Physics, v. 68, p. 781-792, 2006.
SILVA, V. P. R.; AZEVEDO, P. V.; BRITO, R. S.; CAMPOS, J. H. B. C. Evaluating the urban climate of a typically tropical city of northeastern Brazil. Environmental Monitoring Assessment, v. 161, n. 1, p. 45 – 59, 2010.
SILVA, J. S.; SILVA, R. M.; SANTOS, C. A. G. Spatiotemporal impact of land use/land cover changes on urban heat islands: A case study of Paço do Lumiar, Brazil. Building and Environment, v. 136, p. 279-292, 2018.
TONG, H.; WALTON, A.; SANG, J.; CHAN, C. L. Numerical simulation of the urban boundary layer over the complex terrain of Hong Kong. Atmospheric Environment, v.
9, n.1, p. 3549-3563, 2005.
TSELIOU, A.; TSIROS, I. X.; LYKOUDIS, S.; NIKOLOPOULOUM, M. An evaluation of three biometeorological indices for human thermal comfort in urban outdoor areas under real climatic conditions. Building and Environment, v. 45, p. 1346-1352, 2010.
VEREMCHUK, L. V.; YANKOVA, V. I.; VITKINA, T. I.; NAZARENKO, A. V.; GOLOKHVAST, K. S. Urban air pollution, climate and its impact on asthma morbidity. Asian Pacific Journal of Tropical Biomedicine, v. 6, p. 76-79, 2016.
YU, C.; HIEN, W. N. Thermal benefits of City Parks. Energy and Buildings, v. 38, p. 105-120, 2006.