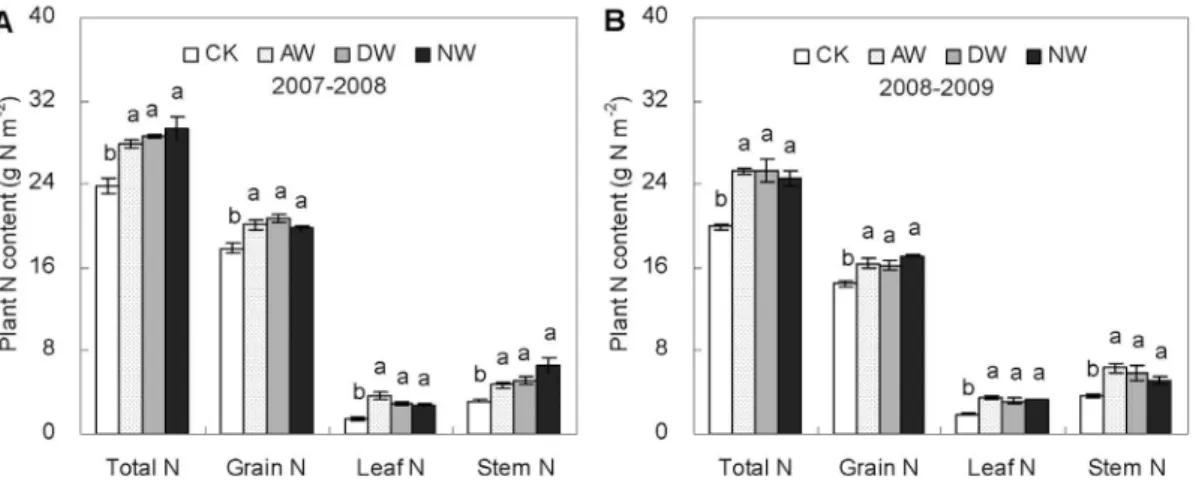
Climatic warming increases winter wheat yield but reduces grain nitrogen concentration in east China.
Texto
Imagem


Documentos relacionados
Redução de caracteres repetidos: Normalmente as pessoas utilizam letras repetidas para intensificar o sentimento, como “adoooooooooro o pacote de canais”. Neste caso, devem- se
Figura 34 – Coeficiente de expansão térmica linear da placa expansora para um ensaio de ativação do sombreamento seguido pela respetiva
Although the use of fertilizer-N increases oat biomass and grain yield in favorable years, high doses may lead to lodging, compromising grain production and quality (Arenhardt
Abstract – The objectives of this work were to study the genetic control of grain yield (GY) and nitrogen (N) use efficiency (NUE, grain yield/N applied) and
A rate of 45 kg N∙ha −1 as AS or UR in top dressing to no-till wheat following soybean provides the maximum economic yield to obtain grain yield of 4.0 t∙ha −1...
An increase in plant population reduced the number of pods per plant and the contribution of branches to the grain yield, independently of N fertilization, but the effects on
Paraquat, regardless of the application rate, applied in the milk grain to soft dough stage reduces wheat yield. Preharvest desiccation, regardless of the herbicide and
The aim of this study is to evaluate the grain yield adaptation patterns of 62 modern winter wheat cultivars in six agro-ecological regions of Poland for two crop
