Effect of phosphorus application on substrate
and use of saline water in sugar
-
apple
seedlings
1Francisco Hélio Alves de Andrade2, Walter Esfrain Pereira3,
Rafael Ramos Morais3, Anselmo Ferreira da Silva3, Miguel Avelino Barbosa Neto3
INTRODUCTION
The sugar-apple tree (Annona squamosa L.),
also known as sweetsop tree, belongs to the Annonaceae family. According to León (1987), the sugar-apple tree originated from the lands of Central America, entered Mexico, and then was introduced to the Middle East through the Philippines. Due to its adaptation to arid and semiarid regions of Brazil
ABSTRACT
RESUMO
and India, they stand out from others crops due to their widespread cultivation (Coelho et al. 2012). From the Annonaceae trees, the sugar-apple and the soursop trees are the most important ones in the Northeastern Brazilian region. This region has the greatest producers of the country, especially in the states of Bahia, Pernambuco and Ceará, while, in the Southeast region, the greatest producing states are São Paulo and Minas Gerais (Lemos 2014).
1. Manuscript received in Mar./2018 and accepted for publication in Jun./2018 (http://dx.doi.org/10.1590/1983-40632018v4852035). 2. Universidade Federal de Lavras, Lavras, MG, Brasil. E-mail: [email protected].
The irrigation with saline water affects the growth of sugar-apple plants. Some reports indicate that phosphorus affects the plants growth, with positive effects on the salts attenuation. This study aimed to assess the effects of the irrigation water electrical conductivity (iwEC) levels and triple superphosphate (TSP) doses in the growth and leaf levels of sugar-apple seedlings (Annona squamosa L.). The experiment was conducted in a
protected environment, in an experimental design of randomized block, with nine treatments that combined phosphorus doses (0.00 g dm-1, 1.10 g dm-1, 3.00 g dm-1, 5.13 g dm-1 and 6.00 g dm-1 of TSP) with irrigation water electrical conductivity (0.50 dS m-1, 1.10 dS m-1, 2.50 dS m-1, 3.91 dS m-1 and 4.50 dS m-1), to evaluate the growth and leaf levels of Na+, K+, Ca+2 and P of
sugar-apple seedlings. The increased curve for stem diameter presented by plants was proportional to the amount of TSP. Nevertheless, the iwEC levels were inversely proportional to this variable. The use of TSP directly affected the plant height (2.02 g dm-²/14.50 cm), dry mass (1.25 g dm-²/0.90 g) and total dry mass (2.32 g dm-²/2.00 g). The increase in the iwEC levels was directly proportional to the Na+ values (16.20 mg g-1), as
well as to the Na+/K+ ratio (1.48 mg g-1), which cause metabolic
disorders in the cellular environment. The TSP doses improve the seedlings growth, proving to be not phytotoxic; however, in combination with the iwEC, they reduce the amount of K+ in
sugar-apple seedlings.
KEYWORDS: Annona squamosa L.; triple superphosphate;
seedling production.
Efeito da aplicação de fósforo ao substrato e uso de água salina em mudas de pinheira
A salinidade da água de irrigação interfere no crescimento de plantas de pinheira. Relatos indicam que o fósforo interfere no crescimento das plantas, com efeitos positivos na atenuação dos sais. Objetivou-se avaliar os efeitos da condutividade elétrica da água de irrigação (CEai) e doses de superfosfato triplo (SFT), no crescimento e teores foliares de mudas de pinheira (Annona squamosa L.). O experimento foi realizado em
ambiente protegido, em delineamento experimental de blocos casualizados, com nove tratamentos, combinando-se doses de fósforo (0,00 g dm-3; 1,10 g dm-3; 3.00 g dm-3; 5,13 g dm-3; e 6.00 g dm-3 de SFT) e condutividade elétrica da água de irrigação (0,50 dS m-1; 1,10 dS m-1; 2,50 dS m-1; 3,91 dS m-1; e 4,50 dS m-1), no crescimento e teores foliares de Na+, K+, Ca+2 e P, em mudas
de pinheira. As plantas apresentaram curva crescente de diâmetro caulinar com o aumento do SFT, porém, à medida que aumentou-se a CEai, houve efeito negativo para esta variável. O SFT influenciou positivamente na altura das plantas (2,02 g dm-²/14,50 cm), massa seca (1,25 g dm-²/0,90 g) e massa seca total (2,32 g dm-²/2,00 g). Com o aumento da CEai, houve incremento nos valores de Na+
(16,20 mg g-1), bem como na razão Na+/K+ (1,48 mg g-1), que ocasionam distúrbios metabólicos no meio celular. Doses de SFT melhoram o crescimento das mudas, não sendo fitotóxico; porém, aliados à CEai, reduzem o conteúdo de K+ em plantas de pinheira.
PALAVRAS-CHAVE:Annona squamosa L. ; superfosfato triplo;
191 Effect of phosphorus application on substrate and use of saline water in sugar-apple seedlings
To produce seedlings in the Northeastern region, the water used for irrigation is collected from dams or rivers, which usually present high salt levels, what hinders the plants growth. Consequently, the adoption of techniques that enable the use of this water is essential. Some producers use biofertilizers, perform substrate drainage and dilute the salt water to employ the hydric resources available to them (Mesquita et al. 2015, Silva Júnior et al. 2017).
According to Silva Júnior et al. (2017), salinity reduces the osmotic potential, decreasing the availability of water in the soil, what compromises the crops yield. K+ and Ca+2 interact positively during the development of several plant species, and one of the positive effects of these ions occurs under salt stress conditions (Diniz Neto et al. 2014, Wu et al. 2014, Silva et al. 2017).
A fundamental factor in the formation of seedlings is the use of phosphorus, since all Brazilian soils present a lack thereof. Phosphorus is part of the plant growth, because it plays an important role in the ATP and NADPH molecules formed in the photosynthesis photochemical phase and later used in the Calvin Benson cycle (Taiz et al. 2017). Phosphorus works as a stimulant in the biomass growth, as reported by Samarão et al. (2011), who noticed a mass increase of the shoot dry mass in soursop seedlings with the application of phosphorus doses to the soil.
Phosphorus is also beneficial for crops in saline environments. Oliveira et al. (2010) reported that, under a reduction of the saline stress effect due to phosphate fertilization, in the radish crop, although the plants were affected by the salt, those that received a more concentrated phosphate fertilization were less affected and were proven more resistant, in comparison with those that were not fertilized.
Souza et al. (2011) reported that Barbados nut trees under salt water conditions can reestablish their leaf increment with phosphate fertilization after 30 days, even when pruned. Although most crops present a slow development, due to the use of phosphorus (Taiz et al. 2017), Barbados nuts presented no reduction in their leaf increment. As for El-Nakhlawy et al. (2012), they concluded that the use of 180 kg ha-1 of P can reduce the effects of an average salinity level on lucerne plants. Diniz et al. (2018) concluded that the phosphate fertilization does not reduce the effect of saline stress on castor oil seedlings.
Therefore, this study aimed to assess the growth of sugar-apple seedlings, as well as the contents of Na+, K+, Ca+2 and P, in leaves submitted to water salinity and triple superphosphate levels.
MATERIAL AND METHODS
The experiment was conducted from January to March 2017, in a protected environment, at the Universidade Federal da Paraíba, in Areia, Paraíba state (PB), Brazil. According to the Köppen classification, the climate is AS’, hot and moist, with maximum temperature of 29.5 ºC and minimum of 18.7 ºC, relative humidity of 77.4-91 % and average annual rainfall of 1,427 mm (Pereira Junior at al. 2008). During the experimental period, the air temperature in the greenhouse varied from a maximum of 43.0 ºC to a minimum of 22.7 ºC.
The experimental design was arranged in randomized blocks. The treatments were obtained based on the Box central compound, with a total of nine treatments, which combined triple superphosphate (TSP) doses (0.00 g dm-3, 0.87 g dm-3, 3.00 g dm-3, 5.13 g dm-3 and 6.00 g dm-3) with irrigation water electrical conductivity (iwEC) levels (0.50 dS m-1, 1.10 dS m-1, 2.50 dS m-1, 3.91 dS m-1 and 4.50 dS m-1). The triple superphosphate was composed of 46 % of P and 10 % of Ca, and was introduced into the substrate at a depth of 10 cm. As for the iwEC levels, a water sample with electrical conductivity of 0.50 dS m-1 was diluted in water collected from the Jacaré dam, in the city of Remígio, PB.
The seeds were collected from well-formed and healthy fruits, harvested from sugar-apple trees grown in the experimental orchard of the Universidade Federal da Paraíba, in Catolé do Rocha, PB. Sowing was performed at a depth of 1.0 cm, in 20-cell seedling trays. After germination, they were transplanted into 4,080-dm³ plastic containers, whose substrate was composed of soil (60 %), vermiculite (20 %) and water-washed sand (20 %).
The soil used for the substrate was classified as a sand-textured Dystrophic Yellowish-Red Latosol (Santos et al. 2013).
the water of the Jacaré dam used in the experiment (Table 2) (Embrapa 2009).
Irrigation started at 20 days after germination, and was performed every two days, always maintaining the substrate humidity and 50 % of the substrate water retaining capacity, with the formula: WRCS = CM + DSM + WRS, where WRCS is the
water retention capacity of the substrate (mL), CM
the container mass (g), DSM the dry substrate mass
(g) and WRS the water retained in the substrate
(g). The irrigation was governed by the formula: DI = WRCFS - WRCS48h, where DI is the daily
irrigation (mL), WRCFS the water retention capacity
of the fixed substrate (mL) and WRCS48h the water
retention capacity of the substrate after 48 h (mL). At 78 days after the implantation of the experiments, the following variables were determined: seedling height, stem diameter, shoot dry mass, total dry mass and the levels of Na+, K+, Ca+2 and P.
The seedling height was measured using the plant stem base as a reference up to the plant stem
plant stem base, at 1.0 cm from the soil.
Both the plant shoot and total dry mass were obtained by weighting the dry vegetal material in an air-circulated muffle at 65 ºC, for 72 h.
The relative and absolute growth rates were obtained based on the plant height and stem diameter data, according to Benincasa (2003) and Floss (2004), using the formulas:
RGR = M2 - M1 T2 - T1
AGR = nlM2 - nlM1 T2 - T1
where AGR is the absolute growth rate, RGR the
relative growth rate, M1 the initial measurement for
height or diameter, M2 the final measurement for
height or diameter, T2 - T1 the time interval and nl
the natural or Napierian logarithm.
The Dickson quality index (DQI) (Dickson et al. 1960) was determined by the following formula:
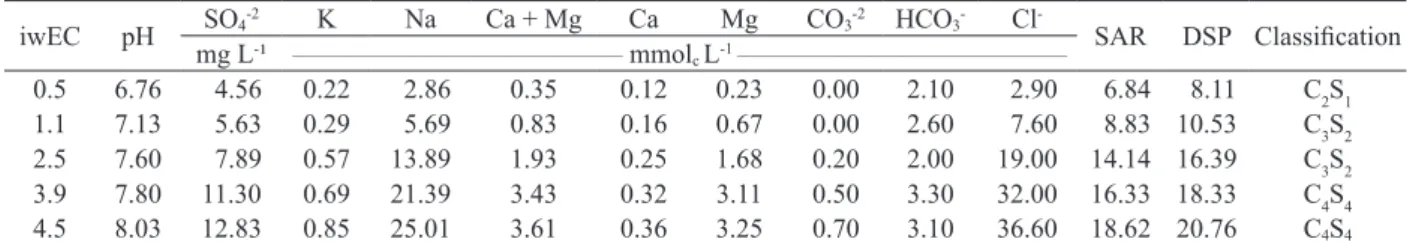
iwEC: irrigation water electrical conductivity; SAR: sodium adsorption ratio; DSP: dissolved sodium percentage. Richards’ classification (1954).
iwEC pH SO4-2 K Na Ca + Mg Ca Mg CO3-2 HCO3- Cl
-SAR DSP Classification mg L-¹ __________________________________________ mmol
c L-1 __________________________________________
0.5 6.76 4.56 0.22 2.86 0.35 0.12 0.23 0.00 2.10 2.90 6.84 8.11 C2S1
1.1 7.13 5.63 0.29 5.69 0.83 0.16 0.67 0.00 2.60 7.60 8.83 10.53 C3S2
2.5 7.60 7.89 0.57 13.89 1.93 0.25 1.68 0.20 2.00 19.00 14.14 16.39 C3S2
3.9 7.80 11.30 0.69 21.39 3.43 0.32 3.11 0.50 3.30 32.00 16.33 18.33 C4S4
4.5 8.03 12.83 0.85 25.01 3.61 0.36 3.25 0.70 3.10 36.60 18.62 20.76 C4S4
Table 2. Irrigation water salinity analysis employed in the experiment.
Treatment pH iwEC SO4-2 K Na Ca + Mg Ca Mg CO3-2 HCO3- Cl
-SAR ESP Classification
mg L-1 __________________________________ mmol
c L-1 __________________________________
SB 7.80 0.62 222.11 1.18 4.16 3.00 2.0 1.00 0.00 20.00 10.00 3.40 3.61 Not saline
1 6.50 4.10 98.15 2.81 24.73 11.50 2.5 9.00 0.00 5.00 65.00 10.31 12.24 Saline
2 6.58 4.78 484.84 2.10 14.46 11.00 1.5 9.50 0.00 5.00 25.00 6.17 7.27 Saline
3 6.34 6.49 56.38 2.27 30.92 11.50 1.0 10.50 0.00 5.00 55.00 12.89 15.08 Saline sodic
4 5.81 4.15 149.96 2.14 12.47 8.50 3.0 5.50 0.00 5.00 15.00 6.05 7.12 Saline
5 6.7 3.70 171.62 2.73 3.90 9.00 1.5 11.50 0.00 0.00 11.00 6.00 10.12 Not Saline
6 5.53 5.66 187.86 2.10 17.90 11.00 3.0 8.00 0.00 5.00 25.00 7.63 9.09 Saline
7 5.87 12.22 146.10 3.29 60.33 16.00 4.5 11.50 0.00 5.00 95.00 21.33 23.20 Saline sodic
8 5.51 5.31 134.49 1.91 19.22 8.00 0.0 8.00 0.00 0.00 50.00 9.61 11.44 Saline
9 5.67 9.05 149.96 2.47 39.99 16.50 4.5 12.00 0.00 5.00 85.00 13.92 16.16 Saline sodic
iwEC: irrigation water electrical conductivity; SAR: sodium adsorption ratio; ESP: exchangeable sodium percentage.
193 Effect of phosphorus application on substrate and use of saline water in sugar-apple seedlings
DQI = SDMM H
+ RDMM
D SDMM
where TDMM is the total dry matter mass (g), H the
shoot height (cm), D the stem base diameter (mm), RDMM the root dry matter mass (g) and SDMM the
shoot dry matter mass (g).
The levels of the Na+, K+ e Ca2+ ions were determined in a laboratory of the Universidade Estadual da Paraíba, in Catolé do Rocha, PB. The analyses were performed according to Silva et al. (2009), in aqueous extracts obtained by the addition of 50 mg of leaf dry mass for 10 mL of deionized water.
The phosphorus leaf level was determined through the digestion with H2O2 and H2SO4 (Tedesco et al. 1995).
The data were submitted to variance analysis and regression of up to 5 % of significance, using the SAS@University software (Cody 2015).
RESULTS AND DISCUSSION
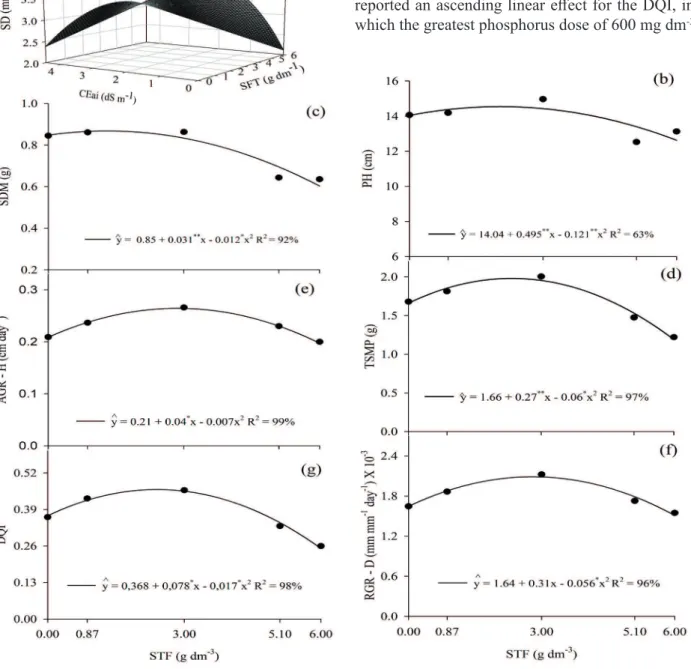
The interaction between the phosphorus doses and the water salinity levels significantly affected the stem diameter, and the increase of the water salinity level and TSP doses inhibited the plants stem diameter growth (Figure 1a). However, the greatest diameter of 3.93 mm corresponded to the dosage of 0.125 g dm-3 of TSP on the plants irrigated with a water sample of lower salinity, a sample of 0.5 iwEC (Figure 1a). Notice that iwEC levels above 0.5 dSm-1 and TSP doses above 0.125 g dm-3 inhibited the stem diameter growth.
Additionally, Sá et al. (2015) reported that the stem diameter was inversely proportional to the salinity level, in sugar-apple seedlings. This reduction may be a response to the nutritional unbalance caused by the salt complex, but also due to the specific ionic effect of Na+ and Cl-, which are the components in greater proportion in all water samples used in the seedlings irrigation (Table 2) and which induced plant toxicity, even in plants with ascending P doses. Another important fact: the daily irrigation was greater in the treatments with more concentrated iwEC and TSP levels, since the build-up of salts in the substrate was inversely proportional to the water absorption, due to the greater concentration of solutes in the substrate.
The increase of the TSP doses was directly proportional to the seedlings height (Figure 1b), shoot dry biomass production (Figure 1c) and total of seedlings (Figure 1d) (2.02 g dm-3, 1.25 g dm-3 and 2.32 g dm-3 of TSP, respectively), resulting in the values of 14.50 cm, 0.86 and 2.00 g seedling-1, respectively. Differently from the results hereof, Pereira et al. (2015) reported more elevated values for sugar-apple seedlings shoot, dry mass and total dry mass, in comparison with the results hereof (5.84 g dm-3 and 5.79 g dm-3, respectively).
The substantial increase of plant growth and development may be related to the fact that phosphate fertilization promotes the plant development, due to its participation in specific reactions in the plants photosynthetic metabolism, acting on their breathing, storage, energy transference and cellular growth (Dias et al. 2009). However, when deprived of this element, they do not complete their normal development cycle.
The absolute growth in height, in comparison with the stem and seedlings quality index, presented similar responses to the effects of the TSP doses (Figure 1). The absolute height growth rate (Figure 1e), stem diameter (Figure 1f) and seedlings quality index (Figure 1g) respectively increased from 0.210 cm day-1 to 0.264 cm day-1, from 1.64 mm mm-1 day-1 to 2.09 mm mm-1 day-1 and from 0.368 to 0.461, between the seedlings of the phosphorus-deprived substrate and the ones with the maximum doses of 2.78 g dm-3, 2.82 g dm-3 and 2.41 g dm-3 of triple superphosphate or phosphorus. Similar results were noticed by Diniz et al. (2017), while testing four phosphate fertilization doses in the papaya crop, reporting effects on height growth and biomass percentage and water level reduction, even when irrigated with five saline water concentrations, caused by the elevated concentration of salts in the water. Nonetheless, there are always damages caused by the nutritional and physiological unbalance due to elevated iwEC levels (Taiz et al. 2017).
growth rate. Nevertheless, elevated values thereof cause ionic toxicity and a consequent increase in the respiratory rate, demanding more input to perform the maintenance of the structures, what increases breathing (Pereira 1989).
producing new materials (Fey et al. 2010). According to Chiariello et al. (1991), due to the fact that a relative growth evaluation does not require mathematical assumptions, the relative growth rate may be considered more as an agronomic handling effect.
The dose of 2.41 g dm-3 resulted in a greater Dickson quality index (DQI) value (0.462). A phosphorus efficiency was also observed by other researchers. Freitas et al. (2013) reported a positive DQI effect in the dose of 143.16 mg seedling-1 of P in sugar-apple seedlings, and Freitas et al. (2017) reported an ascending linear effect for the DQI, in which the greatest phosphorus dose of 600 mg dm-3
195 Effect of phosphorus application on substrate and use of saline water in sugar-apple seedlings
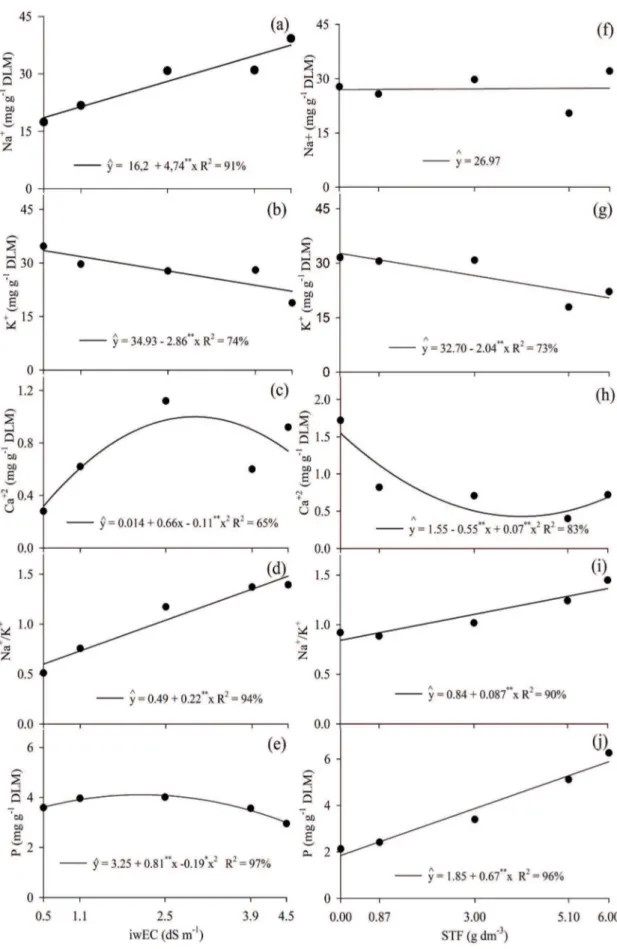
Figure 2. Leaf Na+ (a and f), K+ (b and g), Ca+2 (c and h), Na+/K+ (d and i) and P (e and j) levels, proportionally to the irrigation water
of the best parameters used to evaluate the seedlings quality. The greater the DQI value, the best the seedlings quality standard (Gomes & Paiva 2012).
The greatest increases in the absolute growth rate, relative growth rate and DQI must represent a phosphorus stimulus to the crop genetic potential, due to the fact that they belong to the DNA’s nucleotide molecules, a compound that stores and makes energy available for the metabolic activities and functions. Phosphorus is also part of energy molecules such as the ATP and NADPH, which help in the formation of carbon skeletons and, consequently, in plant growth.
Elevated phosphorus doses reduce the sugar-apple growth, probably due to ionic toxicity, what results in the degradation of the cellular membranes and leaf necrosis. However, the addition of phosphate fertilization presented different results from the ones hereof, in comparison with Psidium guajava
(Nachtigal et al. 1994), Manilkara zapota (Mendonça
et al. 2006) and Passiflora edulis (Silva et al. 2017), and significant dry matter, shoot and total length increases thereof.
The levels of Na+, K+, Ca+2, Na+/K+ and P were affected, regarding the isolated effect of the factors iwEC level and TSP doses, in the sugar-apple seedlings (Figure 2). The nutritional disorders are caused by the salinity effects, especially due to the lack of phosphorus in the soils, caused by the decrease of P+ and K+ (Figures 2b and 2e). Na+ not only reduces the transportation of nutrients, but also impairs their mobility to growth regions (Grattan & Grieve 1998). Nonetheless, there was an increase of the Na+/K+ ratio (Figure 2i) with the addition of TSP, what possibly caused a competition among the nutrients (Grattan & Grieve 1998).
Another factor that may be linked to the increase of the Na+/K+ ratio is related to the attempt of the plants to control the concentration gradient.
For the Na+ levels and Na+/K+ ratio, they were directly proportional to the iwEC levels, to the unitary increase of 16.2 mg g-1 of dry leaf mass and 0.46 ratio (Figures 2a and 2d). Meanwhile, the greatest values found were 37.53 mg g-1 (dry leaf mass) of Na+ and 1.48 of Na+/K+, at the iwEC level of 4.5 dS m-1. The increase in the Na+ level was caused by the build-up of sodium, both in the substrate of 60 mmolc L-1 (Table 1) and in the addition of salt
(2011) reported a greater Na+ leaf level with the salinity increase in cashew trees. The Na+ build-up at the plants shoot is related to the osmotic adjustment caused by the plant, which stabilizes the internal and external amounts of solutes and, consequently, increases the growth rate and dry mass (Gorham et al. 1985).
The complement of the Na+/K+ leaf ratio is caused by an increase of the Na+ (Figure 2d) and by a reduction in the K+ (Figure 2b) leaf quantification caused by the increase of the iwEC level. According to Greenway & Muns (1980), these kinds of relations are essential to the cellular functioning under saline stress conditions. Nevertheless, these same authors report that a ratio equal or less than 0.6 is essential for the maintenance and efficiency of the metabolism in non-halophyte plants. Al-Karaki (2008), while growing Hordeum vulgare L. in a saline environment, noticed that NaCl+ reduces the amount of P in the shoot. However, with the increase of the P solution, there is a reduction in the concentration of Na+ and an increase in the amount of K+, an important ion for the leaf osmotic adjustment and an essential element in the plants tolerance to salt.
The K+ level was inversely proportional to the irrigation water conductivity level (Figure 2b). The greatest level of the ion was calculated by a derivation in the iwEC level of 0.5 dS m-1, resulting in the value of 33.5 mg g-1 of dry leaf mass. Alves et al. (2011) also reported an inverse proportionality to the salinity level in cashew trees. The Na+ build-up in the cell results in metabolic disorders, due to the competition with K+ for the enzymes active zones (Blumwald 2000).
197 Effect of phosphorus application on substrate and use of saline water in sugar-apple seedlings
(1995), the fast Ca+2 increase in the cytoplasm acts as a stress signal, not confirming a tolerance effect to the saline stress.
The iwEC levels stimulate the increase of the leaf phosphorus contents up to 2.13 dS m-1 and, after this value, there is a significant reduction in the leaf phosphorus level (Figure 2e). Fernandes et al. (2002) did not report effects of leaf phosphorus build-up caused by salinity. Nonetheless, they reported a reduction in the root phosphorus content after 15 mmolc L-1 of NaCl+. The increase of NaCl+ (Table 1) in the substrate after 2.13 dS m-1 probably resulted in a reduced activity of the triple superphosphate [Ca(H2PO4)2 H2O] in the substrate solution.
The leaf Na+ was not affected when submitted to triple superphosphate doses (Figure 2f). As for the contents of K+, it is possible to notice a reduction with the proportional increase of the triple superphosphate doses (Figure 2g). Therefore, a negative relation between K+ and triple superphosphate in sugar-apple seedlings may be observed. On the other hand, Soares et al. (2007) did not report effects in the amount of K+ in soursop seedlings.
For the contents of Ca+2 , it is possible to notice a reduction with the increase of the triple superphosphate doses up to the dose calculated by the derivation of 3.9 g dm-3, and later addition up to the dose of de 6 g dm-3 of triple superphosphate (Figure 2h). Soares et al. (2007) reported a greater content of Ca+2 on the shoot (3.37 mg g-1), in soursop seedlings, which was three times greater than the one presented in Figure 2h.
The Na+/K+ ratio was directly proportional to the triple superphosphate doses (Figure 2i), because the K+ content was inversely proportional to the triple superphosphate. However, the leaf phosphorus level was directly proportional to the triple superphosphate doses (Figure 2j). Lima et al. (2015) also reported that P doses are directly proportional to the levels thereof, in the shoot of Toona ciliata seedlings. Soares et al.
(2007) reported that the variation of 0-120 mg dm-3 of P2O5 did not affect the phosphorus content in the shoot of soursop seedlings.
Consequently, the greatest phosphorus dose is not viable for the production of sugar-apple seedlings, because the greatest dry phytomass and the Dickson quality index value of the plant were seen at the phosphorus doses of 2.4 g dm-3 and 2.3 g dm-3, respectively.
CONCLUSIONS
1. Triple superphosphate doses promote a greater growth in sugar-apple seedlings, being recommended the application of 2.24 g dm-3 in the substrate;
2. High triple superphosphate and irrigation water electrical conductivity levels reduce the amount of leaf K+ and increase the Na+/K+ ratio;
3. Triple superphosphate doses do not mitigate the negative effects of the irrigation water electrical conductivity levels.
REFERENCES
AL-KARAKI, G. Barley response to salt stress at varied levels of phosphorus. Journal of Plant Nutrition, v. 20, n. 11, p. 1635-1643, 2008.
ALVES, F. A. L. et al. Efeito do Ca2+ externo no conteúdo
de Na+ e K+ em cajueiros expostos a salinidade. Revista
Brasileira de Ciências Agrárias, v. 6, n. 4, p. 602-608, 2011.
APSE, M. P.; BLUMWALD, E. Na+ transport in plants.
FEBS Letters, v. 581, n. 12, p. 2247-2254, 2007.
BENINCASA, M. M. P. Análise de crescimento de plantas. Jaboticabal: Funep, 2003.
BLUMWALD, E. Sodium transport and salt tolerance in plant cells. Current Opinion of Cell Biology, v. 12, n. 4, p. 76-112, 2000.
CHIARIELLO, N. R. et al. Growth, carbon allocation and cost of plant tissues. In: PEARCY, R. W.; EHLERINGER, J. R.; MOONEY, H. A. (Eds.). Plant physiological ecology: fields and instrumentation. New York: Chapman and Hall, 1991. p. 328-365.
CODY, R. An Introduction to SAS: university edition. Cary:
SAS Institute, 2015.
COELHO, I. R. et al. Uso de fungos micorrízicos arbusculares (FMA) na promoção do crescimento de mudas de pinheira (Annona squamosa L., Annonaceae). Acta Botanica Brasilica,v. 26, n. 4, p. 933-937, 2012. DIAS, T. J. et al. Desenvolvimento nutricional de mudas de mangabeira cultivadas em substratos contendo fibra de coco e adubação fosfatada. Revista Brasileira de Fruticultura, v. 31, n. 2, p. 512-523, 2009.
DICKSON, A. et al. Quality appraisal of white spruce and white pine seedling stock in nurseries. Forest Chronicle, v. 36, n. 1, p. 10-13, 1960.
DINIZ, G. L. et al. Produção de mudas de mamoeiro sob salinidade da água, irrigação e adubação fosfatada. Revista de Ciências Agrárias, v. 41, n. 1, p. 218-228, 2018. EL-NAKHLAWY, F. S. et al. Response of forage yield, protein and proline contents of alfalfa genotypes to irrigation water salinity and phosphorus fertilizer. Journal of Food, Agriculture & Environment, v. 10, n. 1, p. 551-557, 2012.
E M P R E S A B R A S I L E I R A D E P E S Q U I S A AGROPECUÁRIA (Embrapa). Centro Nacional de Pesquisas de Solos. Manual de métodos de análises de solos. 2. ed. Rio de Janeiro: Embrapa Solos, 2009. FERNANDES, A. R. et al. Nutrição mineral de mudas de pupunheira sob diferentes níveis de salinidade. Pesquisa Agropecuária Brasileira, v. 37, n. 11, p. 1613-1619, 2002. FEY, R. et al. Crescimento inicial de mudas de maracujazeiro amarelo em função de doses crescentes de superfosfato simples. Revista Brasileira de Ciências Agrárias, v. 5, n. 3, p. 347-353, 2010.
FLOSS, E. L. Fisiologia das plantas cultivadas. Passo Fundo: Ed. da UPF, 2004.
FREITAS, E. C. S. et al. Crescimento e qualidade de mudas de Cassia grandis Linnaeus f. em resposta à adubação fosfatada e calagem. Ciência Florestal, v. 27, n. 2, p. 509-519, 2017.
FREITAS, R. M. O. et al. Fertilizante fosfatado no desenvolvimento inicial de mudas de pinheira. Bioscience Journal,v. 29, n. 2, p. 319-327, 2013.
GOMES, J. M.; PAIVA, H. N. Viveiros florestais: propagação sexuada. Viçosa: Ed. da UFV, 2012.
GORHAM, J. et al. Some mechanisms of salt tolerance in crop plant. Plant and Soil, v. 89, n. 3, p. 15-40, 1985. GRATTANA, S. R.; GRIVEB, C. M. Salinity-mineral nutrient in horticultural crops. Scientia Horticulturae, v. 78, n. 4, p. 127-157, 1998.
GREENWAY, H.; MUNS, R. Mechanisms of salt tolerance in crop plants. Plant Physiology,v. 31, n. 1, p. 149-190, 1980.
LEMOS, E. E. P. A produção de anonáceas no Brasil. Revista Brasileira de Fruticultura, v. 36, ed. especial, p. 77-85, 2014.
LEÓN, J. Botânica de los cultivos tropicales. San José: IICA, 1987.
LIMA, K. B. et al. Crescimento, acúmulo de nutrientes e fenóis totais de mudas de cedro australiano (Toona ciliata)
MENDONÇA, V. et al. Superfosfato simples e cloreto de potássio na formação de porta-enxerto de sapotizeiro (Manilkara zapota (L.) Von Royen). Ciência Agrotécnica, v. 31, n. 1, p. 140-146, 2007.
MESQUITA, F. O. et al. Formação de mudas de nim sob salinidade da água, biofertilizante e drenagem do solo. Irriga, v. 20, n. 2, p. 193-203, 2015.
NACHTIGAL, J. C. et al. Efeito do fósforo no desenvolvimento inicial de mudas de goiabeira serrana. Ciência Agrícola, v. 51, n. 2, p. 279-283, 1994.
NIU, X. et al. Ion homeostasis in NaCl stress environments. Plant Physiology, v. 109, n. 3, p. 735-742, 1995.
OLIVEIRA, F. R. A. et al. Interação entre salinidade e fósforo na cultura do rabanete. Revista Ciência Agronômica, v. 41, n. 4, p. 519-526, 2010.
PEREIRA JÚNIOR, L. R. Variação climática no brejo paraibano e sua influência na produtividade da cana-de-acúcar. Revista Verde, v. 3, n. 3, p. 50-58, 2008.
PEREIRA, A. R. Aspectos fisiológicos da produtividade vegetal. Revista Brasileira de Fisiologia Vegetal, v. 1, n. 2, p. 139-42, 1989.
PEREIRA, E. C. et al. Fontes, proporções de materiais orgânicos e doses de fósforo na produção de mudas de pinha. Agropecuária Científica no Semiárido, v. 11, n. 3, p. 84-96, 2015.
RICHARDS, L. A. (Ed.). Diagnosis and improvement of saline and alkali soils. Washington, DC: United States Salinity Laboratory, 1954. (Agiculture handbook, 60). SÁ, F. V. S. et al. Balanço de sais e crescimento inicial de mudas de pinheira (Annona squamosa L.) sob substratos irrigados com água salina. Irriga, v. 20, n. 3, p. 544-556, 2015.
SAMARÃO, S. S. et al. Desempenho de mudas de gravioleira inoculadas com fungos micorrízicos arbusculares em solo não-esterilizado, com diferentes doses de fósforo. Acta Scientiarum Agronomy, v. 33, n. 1, p. 81-88, 2011.
SANTOS, H. G. et al. Sistema brasileiro de classificação de solos. 3. ed. Brasília, DF: Embrapa, 2013.
199 Effect of phosphorus application on substrate and use of saline water in sugar-apple seedlings
SILVA, F. A. et al. Estresse salino e adubação mineral na composição nutricional da cultura do milho. Revista Brasileira de Gestão Ambiental,v. 11, n. 1, p. 76-83, 2017. SILVA, M. R. R. et al. Desenvolvimento de mudas de maracujá amarelo em função de diferentes doses de fósforo reativo. Revista Agronegócio, v. 6, n. 1, p. 41-50, 2017. SOARES, I. et al. Crescimento e composição mineral de mudas de gravioleira em resposta a doses de fósforo. Revista de Ciências Agronômicas, v. 38, n. 4, p. 343-349, 2007. SOUSA, A. E. C. et al. Crescimento e consumo hídrico de pinhão manso sob estresse salino e doses de fósforo.
Revista Ciência Agronômica, v. 42, n. 2, p. 310-318, 2011.
TAIZ, L. et al. Fisiologia vegetal. 5. ed. Porto Alegre: Artmed, 2017.
TEDESCO, M. J. et al. Análises de solo, plantas e outros
materiais. Porto Alegre: Ed. da UFRGS, 1985. (Boletim
técnico, 5).