Metrics derived from fish assemblages as indicators of environmental
degradation in Cerrado streams
Milton P. Ávila
1, Rafaela Neves Carvalho
1, Lilian Casatti
2, Juliana Simião-Ferreira
1,
Lorrane Faria de Morais
1, Fabrício B. Teresa
11Campus de Ciências Exatas e Tecnológicas, Universidade Estadual de Goiás. Rodovia BR 153, 3105, Fazenda Barreiro do Meio, Caixa Postal 459, 75132-903 Anápolis, GO, Brazil.
2Instituto de Biociências, Letras e Ciências Exatas, Universidade Estadual Paulista. Rua Cristovão Colombo 2265, 15054-000 São José do Rio Preto, SP, Brazil.
Corresponding author: Fabrício B. Teresa (fabricioteresa@yahoo.com.br)
http://zoobank.org/18B257ED-3A86-41E2-A213-F08023091438
ABSTRACT. The development of effective monitoring tools depends on finding sensitive metrics that are capable of detecting the most important environmental impacts at a given region. We assessed if metrics derived from stream fish assemblages reflect physical habitat degradation and changes in land cover. We sampled the ichthyofauna and environmental character-istics of 16 stream sites of first and second order in the Upper Tocantins River basin. The streams were classified according to their environmental characteristics into reference (n = 5), intermediate (n = 4), and impacted (n = 7). A total of 4,079 individuals in five orders, 12 families, and 30 species were collected. Of the 20 metrics tested, eight were non-collinear and were tested for their performance in discriminating among groups of streams. Three metrics were sensitive to the gradient of degradation: Berger-Parker dominance index, percentage of characiform fish, and percentage of rheophilic individuals. Some commonly used metrics did not reflect the disturbances and many others were redundant with those that did. These results indicate that the metrics derived from fish assemblages may be informative for identifying the conservation status of streams, with the potential to be used in biomonitoring.
KEY WORDS. Bioindicators, Brazilian savannah, fish fauna, multimetric index.
INTRODUCTION
Anthropogenic impacts, such as pollution, riparian zone logging, and landscape (including network) fragmentation (Barletta et al. 2010, Naiman and Dudgeon 2011) affect aquatic ecosystems almost everywhere. These impacts have negatively influenced the chemical, physical, and biological integrity of ecosystems (Barletta et al. 2010, Casatti et al. 2009). In this sce-nario, the development of environmental monitoring tools is fundamental to provide information for the management and protection of natural resources (Yoccoz et al. 2001).
Biological communities can provide valuable information on ecosystem functioning and environmental quality (Roset et al. 2007). Several descriptors (metrics) can be derived from biological communities, including taxonomic structure
(e.g. diversity, evenness or dominance), taxonomic composition (e.g. percentage of individuals of a given taxonomic group), and functional composition (e.g. percentage of individuals of a given ecological guild). For example, it has been suggested that curves of relative abundances and biomass allow the assessment of the level of disturbance in an environment (Clarke and Warwick 2001). These curves are based on the assumption that small-sized species dominate in more disturbed environments, whereas large species dominate in minimally disturbed environments (Yemane et al. 2005). The number of species, the presence of rare species, and the distribution of the abundance of individuals among species (evenness) in an assemblage are also potentially informative metrics for the differentiation of assemblages that have been subjected to different levels of disturbance (Barman and Gupta 2015).
RESEARCH ARTICLE
Environmental quality has often been measured and mon-itored using metrics that have not been thoroughtly evaluated, particularly with respect to how they respond to the disturbance gradient (Roset et al. 2007). And since metric responses can vary regionally and also accorging to the type of impact (Bonada et al. 2006, Teresa and Casatti 2017), it is necessary that they are evalu-ated before they can be used. Thus, studies that test the response of biological metrics to the gradients of anthropogenic disturbance provide an important step to find reliable regional indicators.
Fish are excellent indicators of the conditions of aquatic environments (Karr 1981, Ruaro and Gubiani 2013) and many different indicators based on fish have been developed world-wide (Schiemer 2000, Maire et al. 2013). In Brazil, most efforts to validate metrics extracted from fish assemblages have been concentrated in regions with high densities of humam popula-tions, such as those in the south and southeast Brazil (e.g., Araújo et al. 2003, Casatti et al. 2009 and Costa and Schulz 2010). This asymmetry highlights the need to validate these metrics for other regions, such as the Cerrado (e.g. Carvalho et al. 2017), where the expansion of the agricultural frontier and degradation of aquatic environments have been of major concern for more than a decade (Wantzen et al. 2006, Hunke et al. 2015).
We studied the response of headwater fish assemblages according to contrasting conditions of physical habitat degrada-tion associated with the deforestadegrada-tion of the riparian zone. We evaluated whether metrics based on fish assemblages can be used to differentiate streams according to their conservation status.
MATERIAL AND METHODS
Study area and general proceduresWe described fish assemblage of headwater sites in relation to potential indicators (metrics) and tested whether these data would allow us to distinguish among streams with different levels of environmental degradation. Stream sites were classified according to their environmental characteristics, representing a gradient of land use and habitat degradation.
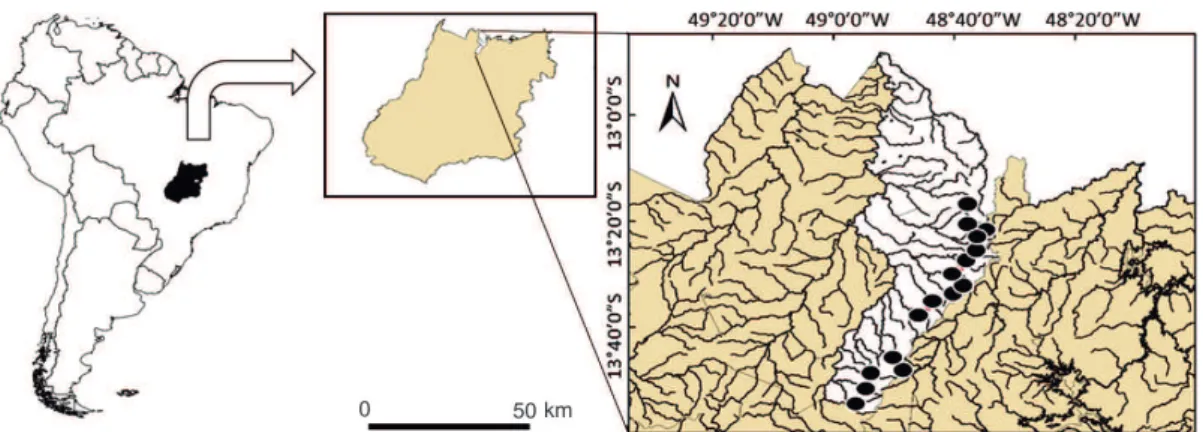
The studied streams are part of the Upper Tocantins basin, Santa Tereza sub-basin (northern Goiás state) (Fig. 1). The Upper Tocantins basin covers an area of 123,800 km2, encompassing parts of the states of Tocantins, Goiás and Distrito Federal. It drains part of the Cerrado biome and the climate is classified as Cwa, according to the Köppen classification system. Annual rainfall is 1,100-1,700 mm and is concentrated between Decem-ber and February (Ferreira and Tokarski 2007). In the studied region, the native vegetation comprises 85% of the land cover (Borges et al. 2016). Impacts resulting from removal of the ri-parian forest contribute to a loss of physical integrity in aquatic habitats, and are among the main antropogenic impacts in local streams (Borges et al. 2015). Minimally disturbed streams have streambeds with stable substrate (composed of rocks and pebbles) and forested riparian zones and catchments.
Sampling
We sampled fish (license: ICMBio #34144-1) from 16 stream sites (sampling reach length of 80 meters) of 1st and 2nd order (sensu Sthraler 1957) (Fig. 1) during the dry period (September 2013), when sampling effectiveness is high due to low water volume. The stream sites were chosen to represent the gradient of environmental conditions in the region and the length of our sampling site was sufficient to estimate fish assemblage metrics based on abundance (Terra et al. 2013a). Sampling effort consisted of one passage of electrofishing (4A, 220V) performed by three people for 1 h in the upstream di-rection. Fishes were fixed in formaldehyde solution (10%) and transferred to 70 % ethanol after 72 hours. Voucher materials are stored in the Coleção Zoológica da Universidade Estadual de Goiás (UEG 291 to 300).
Streams were characterized based on their environmental variables: 1) depth, 2) wetted width, 3) water velocity, 4) per-centage of stable (hard) substrate (rocks and pebbles), 5) riparian forest width, 6) proportion of trees and grass in the riparian zone (30 m from the stream channel in each margin), 7) percentage of native vegetation in a buffer of 100- and 500-m upstream of
the sampling sites, and 8) percentage of native vegetation in the entire catchment. These variables describe the natural en-vironmental gradient (variables 1 to 3) and the level of stream degradation (variables 4 to 8) (Casatti et al. 2006, Leal et al. 2016, Teresa and Casatti 2017).
The physical habitat variables were assessed using a pro-tocol adapted from Casatti et al. (2006). Each sampled site was divided into nine equidistant transversal transects. Depth and wetted width were measured using a meter ruler and measuring tape, respectively. Depth was measured at five equidistant points from one margin to the other in each transect. Water velocity was measured at ~ 0.6 times the total depth at the center of each transect with a mechanical flowmeter model 2030 (General Oceanics). The relative proportion of each type of substrate was visually estimated at each transect according to Cummins (1962). The proportion of pebbles, cobbles and boulders were grouped into a single category named stable substrate. The values of instream and riparian variables for the whole site were obtained by calculating mean values across transects. The percentage of native vegetation in the catchment and in a buffer of 100 and 500-meters upstream of the sampling site were obtained using high resolution images of the RapidEye satellite (spatial resolution of 5 m), made available by the Brazilian Ministry of the Environment, as well as SRTM (Shuttle Radar Topography Mission) images.
Assemblage-based metrics
We tested 20 metrics to describe fish assemblages. These metrics describe patterns of diversity and dominance (Shannon diversity index, Berger-Parker dominance index, and Pielou’s evenness index), taxonomic composition (percentage of indi-viduals in each family or order), size distribution (W statistic for ABC curve summarizing abundance and biomass accumulated among species), trophic ecology, and habitat use (percentage of individuals in each guild).
In order to identify trophic guilds, fish diets were evaluat-ed. Ten individuals of each species had their stomachs removed and analyzed under a stereomicroscope. Food items were sepa-rated and identified in broad categories: detritus, terrestrial in-vertebrates, aquatic inin-vertebrates, plant material (seeds and leaf fragments), and filamentous algae. The alimentary index (IAi) was calculated for each item following Kawakami and Vazzoler (1980). Species were grouped into trophic guilds according to the most frequent and dominant item (high values of IAi). The classification of species according to habitat use was based in the literature (e.g. Teresa et al. 2016, Teresa and Casatti 2017) and personal observations. Species were classified as being either water column dwellers, benthic or nektobenthic, and in relation to rheophily.
The relationship between species abundance and biomass within an assemblage was summarized by ABC curves (Warwick 1986). The abundance and biomass accumulated among the species of each assemblage were ranked in decreasing order of
importance (Warwick 1986), using the software package ‘PRIM-ER’ (Clarke and Gorley 2001). From the ABC curve, it is possible to calculate the W-statistic, which indicates the relationship between the curves. When the biomass curve is positioned above the abundance curve (positive W-statistic), this indicates that large species are dominant in the assemblage, which is typical of better conserved environments (Clarke and Warwick 2001). When the abundance curve is positioned above the biomass curve (negative W-statistic), this indicates that the dominant species has a small contribution to the total biomass, which is typical of disturbed environments (Clarke and Warwick 2001).
Data analysis
Our data anaysis can be summarized in three steps. In step one, we removed colinear variables from environmental and fish-based metric data, performing Pearson pairwise correlations in each matrix and removing variables that were strongly correlated (R > |0.75|). When two or more metrics were redundant with one another, we retained the metric that could more be objectively identified or recorded by a technician. In step two, streams were classified as reference (minimally disturbed), intermediate, or impacted, according to their environmental variables. Only variables that describe the gradient of environmental degrada-tion in agroecosystems (variables 4-8 in sampling secdegrada-tion), and which are useful to explain the variation in the structure and composition of fish assemblages were considered for stream clas-sification (Casatti et al. 2015, Leal et al. 2016, Teresa and Casatti 2017). We generated a matrix of environmental dissimilarity among stream sites (Euclidian distance) based on a standardized environmental matrix (z-score) and performed a cluster analysis using the UPGMA algorithm. We also compared stream groups in relation to their hydrological characteristics (depth, wet width, and water velocity) in order to ensure that stream groups were similar in relation to natural environmental gradients using a one-way ANOVA. Finally, in step three, the performance of the metrics in distinguishing stream groups (obtained in the pre-vious step) was tested with a one-way ANOVA and, in case of significant result, we obtained the Least Significant Difference (LSD) using the software STATISTICA 7.0.
RESULTS
Table 2. Performance of the metrics in distinguishing streams accord-ing to their conservation status, with the correspondaccord-ing F statistic and p-value. For each sensitive metric, the redundant metrics (R > |0.75|) are shown. (+) positive correlation with the sensitive metric; (–) negative correlation with the sensitive metric.
Metrics Redundant metrics F(2,13) p-value
Berger-Parker dominance index
W-statistic (–)
10.78 0.001 Shannon diversity (–)
Pielou evenness (–) % omnivorous individuals (+)
% individuals of Characiformes
% individuals of Siluriformes (–)
3.82 0.05 % individuals of Characidae (+)
% individuals of Loricariidae (–) % benthic individuals (–)
% rheophilic individuals
% individuals of Characidae (–)
7.24 0.001 % individuals of Loricariidae (+)
% water column individuals (–) % benthic individuals (+) % nektobenthic individuals (+)
% aquatic invertivorous indi-viduals (+) % omnivorous individuals (–) % detritivorous/periphytivorous
individuals (+)
Abundance 1.15 NS
% individuals of Gymnotiformes 2.52 NS
% individuals of Heptapteridae 0.02 NS
% individuals of Characiformes + Siluriformes 1.17 NS
% terrestrial invertivorous 0.36 NS
Figure 2. Stream sites grouped by their environmental characteristics by using UPGMA (Unweighted Pair Group Method with Arithmetic Mean). Height at y-axis refers to Euclidean distance.
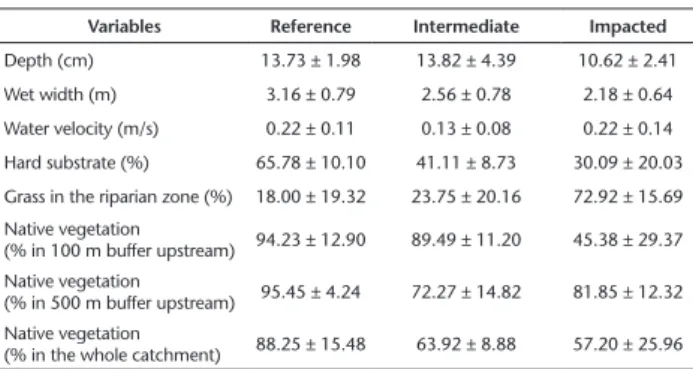
Table 1. Environmental variables (mean ± standard deviation) from reference, intermediate and impacted stream groups.
Variables Reference Intermediate Impacted Depth (cm) 13.73 ± 1.98 13.82 ± 4.39 10.62 ± 2.41 Wet width (m) 3.16 ± 0.79 2.56 ± 0.78 2.18 ± 0.64 Water velocity (m/s) 0.22 ± 0.11 0.13 ± 0.08 0.22 ± 0.14 Hard substrate (%) 65.78 ± 10.10 41.11 ± 8.73 30.09 ± 20.03 Grass in the riparian zone (%) 18.00 ± 19.32 23.75 ± 20.16 72.92 ± 15.69 Native vegetation
(% in 100 m buffer upstream) 94.23 ± 12.90 89.49 ± 11.20 45.38 ± 29.37 Native vegetation
(% in 500 m buffer upstream) 95.45 ± 4.24 72.27 ± 14.82 81.85 ± 12.32 Native vegetation
(% in the whole catchment) 88.25 ± 15.48 63.92 ± 8.88 57.20 ± 25.96
values for the majority of variables (Table 1). The third group was formed by six impacted stream sites that had unconsolidated sub-strate, grass covering most of the riparian zones, and less forested catchments (Table 1). The fourth group was formed by a single stream site (S8). Given the characteristics of this stream, which fit with the typicaly highly degraded streams of agroecosystems, we consider this stream as belonging to the third group (Fig. 2, Table 1). There were no differences among groups of streams with respect to the hydrological variables depth (F(2,13) = 2.35, p = 0.13), wet width (F(2,13) = 2.73, p = 0.13), and water velocity (F(2,13) = 0.76, p = 0.48).
A total of 4,079 individuals in five orders, 12 families, and 30 species were sampled. The species accumulation curves reached the asymptote, indicating that the species sampling was representative (see Suppl. material 1: Table S1 and Fig. S1). The order Characiformes was dominant, representing 81 % of all individuals, followed by Siluriformes, which represented 17 % of the total abundance. Richness varied from 7 to 21 and
the most abundant species was Knodus cf. chapadae (46% of the total abundance).
DISCUSSION
We found that at least three metrics were capable of dis-tinguishing streams in contrasting conditions. Accordingly, they can be useful for identifying the conservation status of streams. Thus, our study assists with the fundamental step of incorpo-rating bioindicators in environmental assessment frameworks, which is the identification of sensitive metrics (Bonada et al. 2006, Roset et al. 2007).
The stream groups identified by us represent the typ-ical physionomies present in agroecosystems (Terra et al. 2013b, Teresa and Casatti 2017). The reference streams have well-preserved riparian forests, with a dominance of woody vegetation. These streams also have good physical integrity, with high environmental complexity, and hard substrate that maintains high species richness (Dala-Corte et al. 2016). On the other hand, impacted streams have more unconsolidated substrate, which is evidence of the siltation process that is currently underway in the region (Borges et al. 2015). These impacts, associated with riparian forest removal and loss of native vegetation surrounding streams, cause habitat homo-geneity, favoring tolerant fish species that become abundant (Lorion and Kennedy 2009). The most dominant species was
Knodus cf. chapadae, a species with high phenotypic plasticity (Teresa et al. 2016). Like its congener, K. moenkahusii, this species seems to be tolerant of environmental degradation, with a great ability to exploit niche opportunities in degraded streams (Ceneviva-Bastos et al. 2007).
Despite the high proportion of minimally disturbed land-scapes (Borges et al. 2016), the region has been experiencing livestock and crop expansion, especially in lowlands, which threatens the conservation of rivers and streams. As exemplified by Knodus cf. chapadae, in impacted conditions, some opportu-nistic species may be favoured, while many specialized species tend to experience a reduction in their populations (Casatti et al. 2009). Our results suggest that other species of Characi-formes may be dominant in impacted streams. In fact, many species (particulary Characidae) of this order are active water column swimmers (Souza et al. 2014). Their ability to exploit the entire water column makes them greatly flexible regarding feeding items (Moraes et al. 2013). Consequently, they are not dependent on physical structures that are lost in degraded streams, such as fallen leaves, logs or stable substrate (Bozzetti and Schulz 2004).
In streams with steep slopes, like those studied here, runs and riffles are prevalent along the longitudinal gradient. Thus, an abundance of rheophilic species is expected. Most of these species are dependent upon hard substrates, where they find suitable microhabitat and food resources (Teresa et al. 2016). However, with the increased runoff of terrestrial sediments, the stream bed becomes silted and less suitable for rheophilic species. In this context, the metric “percentage of rheophilic species” was informative enough to discriminate intermediate Figure 3. Box-and-Whisker plots of the three sensitive metrics.
Rect-angles represent the 1st and 3rd quartiles, small squares are medians,
conditions from the reference. The importance of rheophilic species as bioindicators has been documented in other studies (Terra et al. 2013b, Mostafavi et al. 2015). Armored catfishes, which have benthic and periphytivorous habits (Teresa and Casatti 2012), compose this functional group. Indeed, in our study the percentage of rheophilic species was correlated with the percentage of Loricariidae individuals, of benthic individu-als, and detritivorous/periphytivorous individuals.
Our sensitive metrics are complementary, as they allow to distinguish different stream conditions along the gradient of perturbation. Two metrics (dominance and percentage of Characiformes) are capable of distinguishing more impacted streams. However, at intermediate levels of disturbance these metrics should be uninformative. In these cases, the percent-age of rheophilic individuals would allow the discrimination of reference from intermediate conditions. Therefore, these three metrics can be used jointly to improve the discrimina-tory power of assessment indices when the goal is to classify regional streams according to their environmental condition. In fact, the capacity to discriminate different conditions along a gradient of environmental perturbation is a desirable feature of bioindicators (Bonada et al. 2006).
Recently a new fish-based multimetric index has been developed for streams in the Brazilian savannah (Carvalho et al. 2017). However, we found that the response of at least one sensitive metric (i.e. percentage of characiformes fish) contra-dicted the findings of Carvalho et al. (2017). Other metrics (e.g. percentage of Trichomycteridae and percentage of Poecilia reticulata individuals) are not applicable in our study system, since these taxa were not recorded. Therefore, the validation of context-specific metrics are fundamental, given the fact that indicators cannot be reliably used across different regions (Teresa and Casatti 2017). In summary, our results suggest that physical habitat degradation and changes in land cover in the riparian zone and in the catchment can be detected by fish-based metrics. We expect that our results, coupled with recent iniciatives (Carvalho et al. 2017), represent part of the initial efforts to develop reliable bioindicators for the streams in the Brazilian savannah.
ACKNOWLEDGMENTS
We are grateful to the Laboratório de Ciências Biológicas (Universidade Estadual de Goiás/Porangatu) and the Laborató-rio de Biogeografia e Ecologia Aquática (Universidade Estadual de Goiás/Anápolis) for data collection; to Fernando R. Carvalho for fish identification; to Fundação de Apoio à Pesquisa do Estado de Goiás (201210267000703 and AUXPE 2036/2013) and Conselho Nacional de Desenvolvimento Científico e Tecnológico (482185/2012-0) for research funding. MPA and LFM received scholarships from FAPEG; FBT and LC receive research grants from CNPq (302158/2015-4, 301755/2013-2 respectively).
LITERATURE CITED
Araújo FG, Fichberg I, Pinto BCT, Peixoto MG (2003) A preliminary index of biotic integrity for monitoring the condition of the Rio Paraíba do Sul, southeast Brazil. Environmental Management 32: 516–526. https://doi.org/10.1007/s00267-003-3003-9 Barletta M, Jaureguizar AJ, Baigun C, Fontoura NF,
Agostin-ho AA, Almeida-Val VMF, Val AL, Torres RA, Jimenes-Segura LF, Giarrizzo T, Fabré NN, Batista VS, Lasso C, Taphorn DC, Costa MF, Chaves PT, Vieira JP, Corrêa MFM (2010) Fish and aquatic habitat conservation in South America: a continental overview with emphasis on Neotropical systems. Journal of Fish Biology 76: 2118–2176. https://doi.org/10.1111/j.1095-8649.2010.02684.x
Barman B, Gupta S (2015) Aquatic insects as bio-indicator of wa-ter quality: a study on Bakuamari stream, Chakras hila Wildlife Sanctuary, Assam, North East India. Journal of Entomology and Zoology Studies 3: 178–186.
Bonada N, Prat N, Resh VH, Statzner B (2006). Developments in aquatic insect biomonitoring: a comparative analysis of re-cent approaches. Annual Review of Entomology 51: 495–523. https://doi.org/10.1146/annurev.ento.51.110104.151124 Borges PP, Teresa FB, Martins PTA, Nabout JC (2015) Relative
in-fluence of direct and indirect environmental effects on sestonic chlorophyll-a concentration in Cerrado streams. Acta Limnolo-gica Brasiensia 27: 301–310. https://doi.org/10.1590/S2179-975X1815
Borges PP, Martins PTA, Ferreira AA (2016) Uso e ocupação do solo por meio de uma série histórica na bacia do rio Santa Teresa em Goiás. Revista Brasileira de Geografia Física 9: 296–304. https:// doi.org/10.5935/1984-2295.20160020
Bozzetti M, Schulz UH (2004) An index of biotic integrity based on fish assemblages for subtropical streams in southern Brazil. Hy-drobiologia 529: 133–144. https://doi.org/10.1007/s10750-004-5738-6
Carvalho DR, Leal CG, Junqueira NT, Castro MA, Fagundes DC, Alves CBM, Hughes RM, Pompeu PS (2017) A fish-based multimetric index for Brazilian savanna streams. Eco-logical Indicators 77: 386–396. https://doi.org/10.1016/j. ecolind.2017.02.032
Casatti L, Langeani F, Silva AM, Castro RMC (2006) Stream fish, water and habitat quality in a pasture dominated basin, south-eastern Brazil. Brazilian Journal of Biology 66: 681–696. https:// doi.org/10.1590/S1519-69842006000400012
Casatti L, Ferreira CP, Langeani F (2009) A fish-based biotic integ-rity index for assessment of lowland streams in southeastern Brazil. Hydrobiologia 623: 173–189. https://doi.org/10.1007/ s10750-008-9656-x
Ceneviva-Bastos M, Casatti L, Rossa-Feres DC (2007) Meso and microhabitat analysis and feeding habits of small nek-tonic characins (Teleostei: Characiformes) in Neotropical streams. Zoologia 27: 191-200. https://doi.org/10.1590/ S1984-46702010000200006
Clarke KR, Gorley RN (2001) Software PRIMER. Plymouth, Primer-E Ltd, v. 5.
Clarke KR, Warwick RM (2001) Change in marine communities: an approach to statistical analysis and interpretation, 2nd ed.,
PRIMER-E, Plymouth, 172 p.
Costa PF, Schulz UH (2010) The fish community as an indicator of biotic integrity of the streams in the Sinos River basin, Bra-zil. Brazilian Journal of Biology 70: 1195–1205. https://doi. org/10.1590/S1519-69842010000600009
Cummins KH (1962) An evaluation of some techniques for the col-lection and analysis of benthic samples with special emphasis on lotic waters. The American Midland Naturalist 67: 477–504. https://doi.org/10.2307/2422722
Dala-Corte RB, Giam G, Olden JD, Becker FG, Guimarães TF, Melo AS (2016) Revealing the pathways by which agricultur-al land-use affects stream fish communities in South Brazilian grasslands. Freshwater Biology 61: 1921–1934. https://doi. org/10.1111/fwb.12825
Ferreira EAB, Tokarski DJ (2007) Bacia Hidrográfica do Alto Tocan-tins Retrato e Reflexões. ECODATA, WWF – Brasil, 102 pp. Hunke P, Mueller EN, Schröder N, Zeilhofer P (2015) The Brazilian
Cerrado: assessment of water and soil degradation in catchments under intensive agricultural use. Ecohydrology 8: 1154–1180. https://doi.org/10.1002/eco.1573
Karr JR (1981) Assessment of biotic integrity using fish com-munities. Fisheries 6: 21–27. https://doi.org/10.1577/ 1548-8446(1981)006<0021:AOBIUF>2.0.CO;2
Kawakami E, Vazzoler G (1980). Método gráfico e estimativa de índice alimentar aplicado no estudo de alimentação de peixes. Boletim do Instituto Oceanográfico 29: 205–207. https://doi. org/10.1590/S0373-55241980000200043
Leal CG, Pompeu PS, Gardner TA, Leitão RP, Hughes RM, Kaufmann PR, Zuanon J, Paula FR, Ferraz SFB, Thomson JR, Nally RM, Fer-reira J, Barlow J (2016) Multi-scale assessment of human-induced changes to Amazonian instream habitats. Landscape Ecology 31: 1725–1745. https://doi.org/10.1007/s10980-016-0358-x Lorion CM, Kennedy BP (2009) Riparian forest buffers mitigate the
effects of deforestation on fish assemblages in tropical headwa-ter streams. Ecological Applications 19: 468–479. https://doi. org/10.1890/08-0050.1
Maire A, Buisson L, Biau S, Canal J, Laffaille P (2013) A multi-fac-eted framework of diversity for prioritizing the conservation of fish assemblages. Ecological Indicators 34: 450– 459. https:// doi.org/10.1016/j.ecolind.2013.06.009
Moraes M, Rezende CF, Mazzoni R (2013) The feeding ecology of stream-dwelling Characidae (Osteichthyes: Characiformes) from the upper Tocantins River, Brazil. Zoologia 30: 645–651. https://doi.org/10.1590/S1984
Mostafavi H, Schinegger R, Melcher A, Moder K, Mielach C, Schmut-za S (2015) A new fish-based multi-metric assessment index for cyprinid streams in the Iranian Caspian Sea Basin. Limnologica 51: 37–52. https://doi.org/10.1016/j.limno.2014.10.006 Myers N, Mittermeier RA, Mittermeier CG, Fonseca GA, Kent J
(2000) Biodiversity hotspots for conservation priorities. Nature 403: 853–858. https://doi.org/10.1038/35002501
Naiman RJ, Dudgeon D (2011) Global alteration of freshwaters: in-fluences on human and environmental well-being. Ecological Re-search 26: 865–873. https://doi.org/10.1007/s11284-010-0693-3 Roset N, Grenouillet G, Goffaux D, Pont D, Kestemont PA (2007)
Review of existing fish assemblage indicators and methodolo-gies. Fisheries Management and Ecology 14: 393–405. https:// doi.org/10.1111/j.1365-2400.2007.00589.x
Ruaro R, Gubiani EA (2013) A scientometric assessment of 30 years of the Index of Biotic Integrity in aquatic ecosystems: appli-cations and main flaws. Ecological Indicators 29: 105–110. https://doi.org/10.1016/j.ecolind.2012.12.016
Schiemer F (2000) Fish as indicators for the assessment of the eco-logical integrity of large rivers. Hydrobiologia 422/423: 371–278. https://doi.org/10.1023/A:1017086703551
Souza MA, Fagundes DC, Leal CG, Pompeu PS (2014) Ecomor-phology of Astyanax species in streams with different sub-strates. Zoologia 31: 42–50. https://doi.org/10.1590/S1984-46702014000100006
Sthraler AN (1957) Quantitative analysis of watershed geomor-phology. Trans. American Geophysical Union 38: 913–920. https://doi.org/10.1029/TR038i006p00913
Teresa FB, Casatti L (2012) Influence of forest cover and meso-habitat types on functional and taxonomic diversity of fish communities in Neotropical lowland streams. Ecology of Freshwater Fish 21: 433–442. https://doi.org/10.1111/j.1600-0633.2012.00562.x
Teresa FB, Casatti L (2017) Trait-based metrics as bioindicators: responses of stream fish assemblages to a gradient of envi-ronmental degradation. Ecological Indicators 75: 249–258. https://doi.org/10.1016/j.ecolind.2016.12.041
Teresa FB, Souza LS, Silva DMA, Barbosa HO, Lima JD, Nabout JC (2016) Environmental constraints structuring fish assemblages in riffles: evidences from a tropical stream. Neotropical Ichthyology 14: e150185. https://doi.org/10.1590/1982-0224-20150185 Terra BF, Hughes, RM, Araújo, FG (2013a) Sampling sufficiency
for fish assemblage surveys of tropical Atlantic forest streams, Southeastern Brazil. Fisheries 38: 150–158. https://doi.org/10. 1080/03632415.2013.775572
Terra BF, Hughes RM, Francelino MR, Araújo FG (2013b) Assess-ment of biotic condition of Atlantic Rain Forest streams: a fish-based multimetric approach. Ecological Indicators 34: 136–148. https://doi.org/10.1016/j.ecolind.2013.05.001
Warwick RM (1986) A new method for detecting pollution effects on marine macrobenthic communities. Marine Biology 92: 557–562. https://doi.org/10.1007/BF00392515
Yemane D, Field JG, Leslie RW (2005) Exploring the effects of fish-ing on fish assemblages usfish-ing Abundance Biomass Compari-son (ABC) curves. ICES Journal of Marine Science 62: 374-379. https://doi.org/10.1016/j.icesjms.2005.01.009
Yoccoz NG, Nichols JD, Boulinier T (2001) Monitoring of biological diversity in space and time. Trends in Ecology & Evolution 16: 446–453. https://doi.org/10.1016/S0169-5347(01)02205-4
Supplementary material 1
Table S1. Species identity, total number of individuals and
species classification according to trophic guilds and habitat use. Terins: terrestrial invertivorous; Aquins: aquatic invertivo-rous; Det-Per: detritivorous/periphytivoinvertivo-rous; Pis: piscivoinvertivo-rous; Omni: omnivorous; WC: water column; Ben: benthic; Nectb: nectobenthic; Bank: bank-dwelling species; Rheo: rheophilic.
Figure S1. Species accumulation (black) and rarefaction
curve (gray) based on samples.
Authors: Milton P. Ávila, Rafaela Neves Carvalho, Lilian Casatti, Juliana Simião-Ferreira, Lorrane Faria de Morais, Fabrício B. Teresa
Data type: measurement
Copyright notice: This dataset is made available under the Open Database License (http://opendatacommons.org/li-censes/odbl/1.0/). The Open Database License (ODbL) is a license agreement intended to allow users to freely share, modify, and use this Dataset while maintaining this same freedom for others, provided that the original source and author(s) are credited.
Link: https://doi.org/10.3897/zoologia.35.e12895.suppl1
Submitted: 23 March 2017
Received in revised form: 12 June 2017 Accepted: 14 June 2017
Editorial responsibility: Adriano S. Melo
Author Contributions: MPA JSF and FBT designed the sampling design; MPA, RNC, LFM and FBT collected data; MPA RNC LFM and FBT analyzed the data; MPA RNC LC JSF LRM and FBT wrote the paper.