Rev Bras
Cineantropom
Hum
DOI: http://dx.doi.org/10.5007/1980-0037.2018v20n5p445
original article
Open public spaces and physical activity
facilities: study of systematic observation
of the environment
Espaços públicos de lazer e estruturas para atividade
física: estudo de observação sistemática do ambiente
Sofia Wolker Manta1
Adalberto Aparecido dos Santos Lopes2,4
Adriano Akira Ferreira Hino2,3,4
Tânia Rosane Bertoldo Benedetti1
Cassiano Ricardo Rech1
Abstract – The aim of this study was to investigate the quantity and quality of open public spaces (OPS) and physical activity (PA) facilities in Florianopolis, Santa Catarina. A descriptive survey was carried out in 2015 on the quantity, type and quality of OPS and PA facilities. The quality of OPS and PA facilities were assessed by systematic observa-tion. A quality index of OPS (score -3 to 6 points) was divided into three categories, poor (category ≤0), average (0.1 to 2.9) and good quality (category ≥3). For analysis, descriptive statistics were used. Of the 214 OPS, the highest proportion was squares/gardens (n = 128, 59.8%). Of the 214 OPS, 59.8% were squares/gardens. About 51.9% (n = 111) of OPS had good quality. A higher proportion of comfort items obtained good quality, such as lighting (54.7%), trash cans (45.8%) and garden benches (55.1%). In more than 60.0% of OPS, there were no incivilities. Of the 377 PA facilities identified, 53.6% presented good quality and 13.8% poor quality. Playgrounds (29.4%), outdoor gyms (15.9%) and soccer fields/courts (14.9%) were more frequent, only the latter less than half had good quality (28,6%). There were no PA facilities in 29.0% of OPS. A higher proportion of OPSs have good quality, but less than half require improvement, comfort, less incivility and greater diversity of PA facilities. This may promote greater visits to OPS and leisure opportunities, including the practice of PA.
Key words: Healthy environment; Leisure activities; Motor activity.
Resumo – Objetivou-se analisar a quantidade e a qualidade dos espaços públicos de lazer e estruturas para atividades físicas em Florianópolis, Santa Catarina. Realizou-se, no ano de 2015, um levantamento descritivo da quantidade, tipo e qualidade dos espaços públicos de lazer (EPL) e estruturas para atividade física (AF). A qualidade dos EPL e estruturas para AF foi avaliada por meio de observação sistemática. Um índice de qualidade dos EPL (escore -3 a 6 pontos) foi categorizado em três níveis, qualidade ruim (categoria ≤0), média (0,1 a 2,9) e boa (categoria ≥3). Para análise fez-se uso da estatística descritiva. Dos 214 EPL, maior proporção foi de praças/jardins (n=128; 59,8%). Em 51,9% (n=111) dos EPL tinham qualidade boa. Maior proporção de itens de conforto obteve qualidade boa como iluminação (54,7%), lixeiras (45,8%) e bancos (55,1%). Em mais de 60,0% dos EPL inexistiam incivilidades. Das 377 estruturas para AF identificadas, 53,6% apresentaram qualidade boa e 13,8% qualidade ruim. Os parquinhos infantis (29,4%), academias ao ar livre (15,9%) e campos/canchas de futebol (14,9%) foram mais frequentes, apenas este último menos da metade apresentou qualidade boa (28,6%). Em 29,0% dos EPL inexistiam estruturas para AF. Maior proporção dos EPL tem boa qualidade, mas ainda menos da metade necessitam de melhorias, em conforto, menores incivilidades e maior diversidade de estruturas para AF. Isso poderá promover maior visitação
1 Federal University of Santa Cata-rina. Graduate Program in Physical Education. Florianópolis, SC. Brazil
2 Federal University of Paraná. Gra-duate Program in Physical Education. Curitiba, PR. Brazil.
3 Pontifical Catholic University of Paraná. Graduate Program in Health Technology, Curitiba, PR. Brazil.
4 Pontifical Catholic University of Paraná. Research Group on Physical Activity and Quality of Life. Curitiba, PR. Brazil.
INTRODUCTION
Open public spaces (OPS) are important attributes of the urban environ-ment that favor health promotion1,2. These spaces favor free access and
promote benefits for mental health, environmental and economic sustain-ability3. Studies in high-income countries demonstrate that the presence
and quality of OPS1,4 and structures for activities in these spaces can
promote higher level of physical activity in different population groups5.
Thus, public policies could stimulate the adaptations of urban centers to stimulate the installation of environmental attributes, such as OPSs in order to contribute to the sustainable development of cities2. This is
neces-sary since, in low- and middle-income countries, public health expenditures are high due to physical inactivity, representing approximately US$ 42.5 million in per year6. Analyzing the urban context of a city in its
distribu-tion of public goods and services intended for health promodistribu-tion, such as parks, squares, allows us understanding how much a city is friendly to the population4,7. In the context of Brazil, this analysis may favor more
vulner-able groups, such as those with low income and lower levels of education, to enjoy leisure options in an active and safe way8,9.
The city of Florianopolis is among the capitals of Brazil with the high-est prevalence of people active in leisure time (43.9%), compared to São Paulo, with the lowest prevalence (30.4%)10. The quantity and quality of
OPS, as well as the presence of physical activity facilities in spaces can have an important impact on the health of the population, such as adherence, maintenance and motivation to healthy life choices11. Therefore,
investigat-ing the characteristics of these spaces may support municipal and national public policies for the planning of health-promoting urban environments2.
Thus, this study aims to investigate the quantity and quality of open public spaces and physical activity facilities in Florianopolis.
METHODOLOGICAL PROCEDURES
Study site
The study was carried out in the city of Florianopolis, capital of the state of Santa Catarina, located on the coast of southern Brazil. Florianopolis has population of 421,240 thousand inhabitants, population density of 623.68 inhabitants/km2 and human development index above the national
average (0.847 in Florianopolis and 0.727 in Brazil)10.
Design, study characteristics and ethical aspects
Selection of open public spaces
Initially, OPSs were identified from information available at the Municipal Health Secretariat of Florianopolis based on the 2012 database. In order to update data, an interview with community health agents in health centers was conducted to identify spaces not included in the lists. Finally, OPSs were geo-referenced in the Google Earth program and visited by a team of trained evaluators. The types of OPSs were classified into squares/gardens (≤2 street blocks), parks/woods (≥2 street blocks), garden beds (central streets and avenues), community institutions and/or residents’ association (containing open areas of free access to the population) and free areas, composed of seaside coastal regions.
Data collection
The presence and quality of OPSs and physical activity facilities were ob-tained through the method of systematic observation of the environment, through the Physical Activity Resource Assessment (PARA) instrument12,
also used in the Brazilian context9,13. The instrument is composed of a
checklist that evaluates the presence/quantity of physical activity facilities (courts and sports fields, outdoor gym, playgrounds, among others); com-fort items (picnic tables, bathrooms, benches, lighting, drinkers, changing rooms and trash cans); and incivility items (broken glass, presence of ani-mals, loose dogs, evidence of alcohol use, graffiti, scattered garbage, signs of vandalism and high grass). The quality of these items is established by a likert scale, ranging from 0 (negative pole) to 3 points (positive pole), thus: a) ‘0’ represents the absence of structures; b) ‘1’ presence of structures with poor quality (established for present items or structures, but that do not offer conditions of use due to poor state of conservation); c) ‘2’ pres-ence of structure with average quality (considered when the structure can be used, but needs improvement); and d) ‘3’ presence of structures with good quality (those that have their characteristics preserved in good state of conservation). For the presence of incivility items, the likert scale is inverted, where ‘0’ refers to the non-existence of incivilities; ‘1’ the place is in good condition, but at least one sign of incivility is observed; ‘2’ 2 to 4 incivility items are present and, ‘3’ more than 5 incivility items are observed, revealing poor quality12.
The number of OPS was counted according to classification of the space evaluated. For the quality analysis, a quality index of OPS was computed through the sum of the quality averages of physical activity facilities, the average quality of comfort structures, subtracted from the mean value of the presence of incivilities5. This index varied from -3 to 6 points, with
quality, ‘2’ average quality and ‘3’ good quality. With regard to incivilities, for analysis only, the poles of the scale have been inverted and thus, the larger the scale value, the better the quality of the space.
The analysis of the presence/amount of physical activity facilities was calculated as the sum of the types of structures present in OPS. According to the description of the structure quality, the instrument’s own likert scale was adopted, being ‘1’ poor quality, ‘2’ average quality and ‘3’ good quality. After that, the presence of physical activity facilities by type of public space was analyzed, being distributed into four categories: “nonexistent”, “pres-ence of one facilities”, “two facilities”, “three facilities” and “≥4 facilities”.
Statistical analyses
Data were entered in the Excel software by the double typing method to avoid errors in the process. Absolute and relative frequency distribution was used to describe the presence of OPS and physical activity facilities; quality of OPS (categories) and physical activity facilities (categories); com-fort structures and incivilities, as well as measures such as mean, median, minimum and maximum for the presentation of OPS quality as a continu-ous variable. Analyses were performed by the SPSS software version 17.0.
RESULTS
A total of 374 OPSs were identified, and sites such as ecological trails (n = 16, 4.3%), non-habitable garden beds (used for pedestrian crossing only) (n = 45, 12%), (N = 2, 0.5%), those located in risk areas (n = 5, 1.3%), in private places (n = 20, 5.3%) and duplicate spaces (n = 14, 3.7%) were ex-cluded. Thus, 153 spaces were excluded (40.9%), remaining 221 located via Google Earth and 22 included during visits. Of these, 243 public spaces, 29 (11.9%) had to be excluded from the final analysis because they were exclusively from stretches of cycle paths, resulting in 214 OPSs evaluated.
Among OPSs evaluated, higher presence of squares/gardens (n = 128, 59.8%), free areas (n = 47, 22%) and only nine parks/woods (n = 9, 4.2%) (Table 1). The quality index of OPSs ranged from -2 to 6 and only squares / gardens obtained negative scores. The mean space quality was 2.7 (median [md] = 3.0), being higher among parks / woods (mean [μ] = 3.8, md = 4.1). Higher proportion garden beds presented average quality (n = 5, 55.6%) and the other types of OPS showed good quality (Table 1).
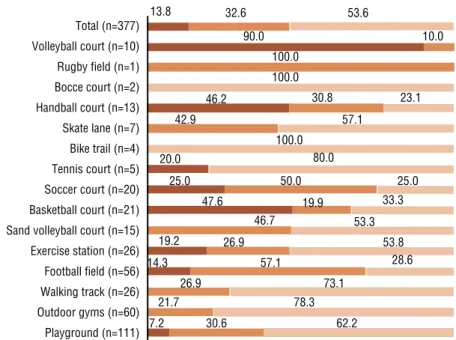
In OPSs, 377 physical activity facilities were identified. In general, a higher proportion of facilities had good quality (53.6%), followed by average quality (32.6%) and poor quality (13.8%) (Figure 1). The most frequent fa-cilities were children’s playgrounds (29.4%, n = 111), outdoor gyms (15.9%, n = 60) and soccer fields/courts (14.9%, n = 56), in the latter, less than half had good quality (14.9%). basketball (33.3%), soccer (25.0%) and handball (23.1%) courts had higher proportion of poor quality facilities (Figure 1).
Table 1. Description of the presence / quantity and quality of open public spaces in Florianópolis, 2015 (n = 214).
Types of Public Spaces
Total
Quality Index (continuous)
Quality Index (categories)*
Poor Average Good
n (%) Mean (µ) Median (min,max) n (%) n (%) n (%)
Squares / gardens 128 (59.8) 2.7 2.9 (-2.0;6.0) 12 (9.4) 52 (40.6) 64 (50.0)
Free areas 47 (22.0) 2.7 3.0 (0.0;6.0) 3 (6.4) 18 (38.3) 26 (55.3)
Community institutions 21 (9.8) 2.8 3.0 (0.0;5.7) 1 (4.8) 9 (42.9) 11 (52.4)
Parks / woods 9 (4.2) 3.8 4.1 (2.0;5.8) - 3 (33.3) 6 (66.7)
Garden beds 9 (4.2) 2.2 1.7 (0.5;4.4) - 5 (55.6) 4(44.4)
Total 214 (100) 2.7 3.0 (-2.0;6.0) 16 (7.5) 87 (40.7) 111 (51.9)
Note. * Quality score classification: poor quality (category ≤ zero); average quality (category of 0.1-2.9); good quality (category ≥ 3.0).
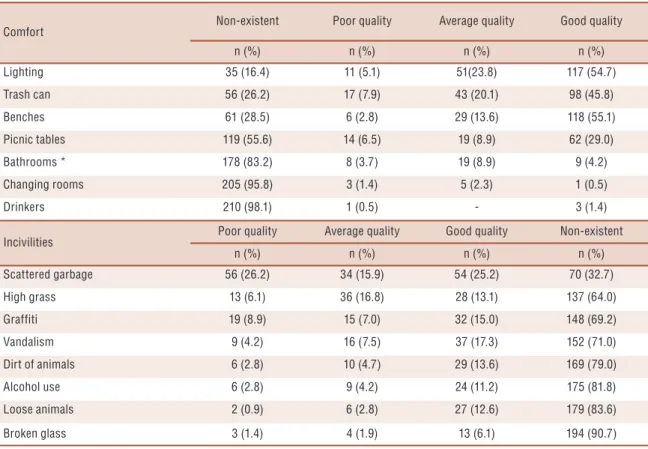
Table 2. Frequency and quality of comfort and incivility items observed in open public spaces of Florianopolis, 2015 (n = 214).
Comfort Non-existent Poor quality Average quality Good quality
n (%) n (%) n (%) n (%)
Lighting 35 (16.4) 11 (5.1) 51(23.8) 117 (54.7)
Trash can 56 (26.2) 17 (7.9) 43 (20.1) 98 (45.8)
Benches 61 (28.5) 6 (2.8) 29 (13.6) 118 (55.1)
Picnic tables 119 (55.6) 14 (6.5) 19 (8.9) 62 (29.0)
Bathrooms * 178 (83.2) 8 (3.7) 19 (8.9) 9 (4.2)
Changing rooms 205 (95.8) 3 (1.4) 5 (2.3) 1 (0.5)
Drinkers 210 (98.1) 1 (0.5) - 3 (1.4)
Incivilities Poor quality Average quality Good quality Non-existent
n (%) n (%) n (%) n (%)
Scattered garbage 56 (26.2) 34 (15.9) 54 (25.2) 70 (32.7)
High grass 13 (6.1) 36 (16.8) 28 (13.1) 137 (64.0)
Graffiti 19 (8.9) 15 (7.0) 32 (15.0) 148 (69.2)
Vandalism 9 (4.2) 16 (7.5) 37 (17.3) 152 (71.0)
Dirt of animals 6 (2.8) 10 (4.7) 29 (13.6) 169 (79.0)
Alcohol use 6 (2.8) 9 (4.2) 24 (11.2) 175 (81.8)
Loose animals 2 (0.9) 6 (2.8) 27 (12.6) 179 (83.6)
Broken glass 3 (1.4) 4 (1.9) 13 (6.1) 194 (90.7)
Figure 1. Proportion of the quality of physical activity facilities present in open public spaces of Florianopolis, 2015 (n = 377).
Higher proportion of OPSs showed the presence of only one physi-cal activity facility (36.9%) and in 29.0%, they were non-existent. High proportion of squares/gardens (34.4%) and garden beds (55.6%) did not contain physical activity facilities, while in parks/woods, 44.4% contained four or more facilities (Figure 2).
Figure 2. Proportion of structures for physical activities present in open public spaces of
Florianopolis, 2015 (n = 377).
DISCUSSION
than 50% of spaces presented good quality, but 48.1% need improvements in comfort and less presence of incivilities, such as high grass, scattered litter and graffiti. In addition, the options of physical activities facilities in OPS are reduced, being more frequent the presence of playgrounds, outdoor gyms and soccer fields/courts. The latter, for the most part, did not show good conditions of use. In general, greater proportion of OPS contain only one physical activity facility, which denotes the need for greater public and private investments to broaden and diversify the options for active leisure to the population.
Evidence shows that public leisure spaces in urban centers are impor-tant, since they are associated with greater practice of physical activities2,14.
In Florianopolis, the amount of OPS is reduced compared to other cities in Brazil, but more than half (51.9 %) are in good conditions of use, un-like other regions of the country such as Parintis/AM15, Cuiaba/MT8 and
Pelotas/RS9. Possibly, the greater proportion of OPS with good quality in
Florianopolis may be due to the adoption of squares and parks by private companies that are jointly responsible for their maintenance, in exchange for the disclosure of their brands. This can be an interesting strategy to improve the quality of spaces and encourage active leisure1,5. In addition,
adjusting the quality of existing spaces can contribute not only to the city sustainability but also the equity of access to the local population for health promotion9.
About 48.2% of surveyed OPSs still need better adaptations, especially in the reduction of incivilities, such as scattered garbage, high grass and graffiti, as they make spaces more vulnerable to crime, as observed in the city of Curitiba16. Comfort items such as good lighting were present in
more than 54.7% of public spaces of Florianopolis, which in addition to improving the perception of safety by users, can contribute to the engage-ment in physical activities throughout the day16,17. The presence of trash
cans (45.8%), benches (55.1%) and picnic tables (29.0%) with good quality in the spaces evaluated also serve to support moments of rest, socializa-tion and contemplasocializa-tion18. Evidence shows that each new comfort attribute
perceived in parks increases by three times the probability of being highly used19. Thus, the maintenance, aesthetics and good quality of OPS may
explain, in part, why some places are more frequented than others11,19.
Leisure physical activity facilities are also important factors for the frequent use of public spaces20. In 29% of spaces evaluated in Florianopolis,
there were no structures for the practice of physical activity. Consequently, these spaces are more used for less active activities, such as rest and/or contemplation18. In general, facilities such as playgrounds, outdoor gyms
and soccer fields/courts were more frequent, only the latter with less than half in good conditions of use. However, the type of facilities present for physical activity in an OPS may favor some age groups of the population to the detriment of others20. For example, children’s playgrounds are more
frequented by children and adolescents21, while outdoor gyms favor the use
evaluated public spaces, stimulate greater engagement in walking activities, regardless of socioeconomic conditions of cities23. Thus, soil occupation
in Florianopolis, although reduced, due to its geographic characteristics (insular and continental portion) may be more attractive if OPSs had greater diversity of physical activity facilities. In addition to serving to the different age groups, they may also favor the active leisure choices of residents24.
It could be observed that parks/woods were OPSs that obtained more than four physical activity facilities (44.4%). Possibly these spaces may be the greatest potentiates of engagement in physical activities, due to their larger area in square meters, and to the greater amount of sport-recreational events by the greater number of physical activity facilities present in these spaces19-21, as observed in other studies24,25. Evidence shows that the
fre-quency of use of a OPS can be justified by the types of physical activities offered20,21. Therefore, garden beds, community institutions, free areas and
squares/gardens can enhance the use of spaces if they are attractive to a greater diversity of interests of the population19. This not only contributes
to the adoption and maintenance of the recommended levels of physical activities, but also in the health co-benefits3.
The present study presents strengths, as it evaluates the quantity and quality of OPS and physical activity facilities in all regions of the city using an internationally recognized instrument, validated and adapted to the Brazilian context. The findings contribute to reduce the lack of results in the area about the characteristics of OPS for health promotion in Latin American regions, enabling future actions and strategies to be made to make cities friendlier to healthy practices, thus allowing the proximity of data.
However, some limitations to the analysis of findings should be consid-ered. The identification of the types of public spaces present is characteristic of the city; therefore, they could not be generalizable to other contexts. Public spaces such as beaches and ecological trails, despite the large amount in the city, positively contributing to the practice of physical activity, were not investigated because they were considered natural environments, which evaluation would be impossible with the instrument used. Potential sites to be evaluated were previously identified through a listing provided by community health agents, in addition to visits by researchers to verify and confirm sites not included in the listing. However, places that may not have been identified in one of these possibilities may not have been evaluated.
of use, also assisting managers, urban planners and health professionals in the implementation of programs and events to encourage the creation, maintenance and adaptation of open public spaces, as a way to encourage the population to have healthier habits by using these spaces for practicing physical activities.
COMPLIANCE WITH ETHICAL STANDARDS
Funding
CNPQ for the award of Masters scholarship. Financing of the project by FAPESC / PPSUS / n.2014TR2263.
Conflict of interest statement
The authors have no conflict of interests to declare.
Ethical approval
Ethical approval was obtained from the local Human Research Ethics Com-mittee - Federal University of Santa Catarina (No. 47789015.8.0000.012) and Research Coordination of the Health area of Florianopolis, and the protocol was written in accordance with the standards set by the Declara-tion of Helsinki.
Authors’ Contributions
SWM; CRR and TRBB conceived and designed the experiments; SWM and CRR performed the experiments, SWM analyzed data, SWM, CRR, TRBB, AASL and AAFH contributed with reagents/materials/analysis tools, SWM, CRR, TRBB, AASL and AAFH wrote the paper.
REFERENCES
1. Van Cauwenberg J, Cerin E, Timperio A, Salmon J, Deforche B, Veitch J. Park proximity, quality and recreational physical activity among mid-older aged adults: moderating effects of individual factors and area of residence. Int J Behav Nutr Phys Act 2015;12(46):1-8.
2. Sallis JF, Cerin E, Conway TL, Adams MA, Frank LD, Pratt M, et al. Physical activity in relation to urban environments in 14 cities worldwide: a cross-sectional study. Lancet 2016;387(10034):2207-17.
3. Sallis JF, Spoon C, Cavill N, Engelberg JK, Gebel K, Parker M, et al. Co-benefits of designing communities for active living: an exploration of literature. Int J Behav Nutr Phys Act 2015; 12(30):1-10.
4. Veitch J, Abbott G, Kaczynski AT, Wilhelm Stanis SA, Besenyi GM, Lamb KE. Park availability and physical activity, TV time, and overweight and obesity among women: Findings from Australia and the United States. Health Place 2016;38:96-102.
5. Lee RE, Mama SK, Adamus-Leach HJ, Soltero EG. Contribution of neighbor-hood income and access to quality physical activity resources to physical activity in ethnic minority women over time. Am J Health Promot 2015;29(4):210-6.
7. Dyck DV, Sallis JF, Cardon G, Deforche B, Adams MA, Geremia C, et al. Associa-tions of neighborhood characteristics with active park use: an observational study in two cities in the USA and Belgium. Int J Behav Nutr Phys Act 2013;12(26):1-9.
8. Silva IJO, Alexandre MG, Ravagnani FCP, Silva JVP, Coelho-Ravagnani CF. Atividade física: espaços e condições ambientais para sua prática em uma capital brasileira. Rev Bras Cienc Mov 2014;22(3):53-62.
9. Silva I, Mielke G, Nunes B, Böhm A, Blanke A, Nachtigall M, et al. Espaços públicos de lazer: distribuição, qualidade e adequação à prática de atividade física. Rev Bras Ativ Fís Saúde 2015;20(1):82-92.
10. Brasil. Vigitel Brasil 2014: vigilância de fatores de risco e proteção para doenças crônicas por inquérito telefônico estimativas sobre frequência e distribuição so-ciodemográfica de fatores de risco e proteção para doenças crônicas nas capitais dos 26 estados brasileiros e no Distrito Federal em 2014. Ministério da Saúde, Brasília, 2014.
11. Salvo D, Sarmiento OL, Reis RS, Hino AA, Bolivar MA, Lemoine PD, et al. Where Latin Americans are physically active, and why does it matter? Findings from the IPEN-adult study in Bogota, Colombia; Cuernavaca, Mexico; and Cu-ritiba, Brazil. Prev Med 2017;103S:S27-S33.
12. Lee RE, Booth KM, Reese-Smith JY, Regan G, Howard HH. The Physical Ac-tivity Resource Assessment (PARA) instrument: evaluating features, amenities and incivilities of physical activity resources in urban neighborhoods. Int J Behav Nutr Phys Act 2005;2(13):1-9.
13. Vieira MC, Sperandei S, Reis AC, da Silva CGT. An analysis of the suitability of public spaces to physical activity practice in Rio de Janeiro, Brazil. Prev Med 2013; 57(3):198-200.
14. Bancroft C, Joshi S, Rundle A, Hutson M, Chong C, Weiss CC, et al. Association of proximity and density of parks and objectively measured physical activity in the United States: A systematic review. Soc Sci Med 2015;138:22-30.
15. Radicchi M, Santos J, Carneiro D, Reis Júnior M, Anselmo J. Descrição dos espaços esportivos de lazer e educação na cidade de Parintins, Amazonas. Rev Bras Ativ Fís Saúde 2016;20(6):626-637.
16. Rech CR, Reis RS, Hino AA, Rodriguez-Añez CR, Fermino RC, Gonçalves PB, et al. Neighborhood safety and physical inactivity in adults from Curitiba, Brazil. Int J Behav Nutr Phys Act 2012;9(72):1-7.
17. Arango CM, Páez DC, Reis RS, Brownson RC, Parra DC. Association between the perceived environment and physical activity among adults in Latin America: a systematic review. Int J Behav Nutr Phys Act 2013;10(122):1-9.
18. Cohen DA, Han B, Derose KP, Williamson S, Marsh T, Raaen L, et al. The paradox of parks in low-income areas: park use and perceived threats. Environ Behav 2016;48(1):230-45.
19. Edwards N, Hooper P, Knuiman M, Foster S, Giles-Corti B. Associations between park features and adolescent park use for physical activity. Int J Behav Nutr Phys Act 2015; 12(21):2-10.
20. Cohen DA, Sehgal A, Williamson S, Marsh T, Golinelli D, McKenzie TL. New recreational facilities for the young and the old in Los Angeles: policy and pro-gramming implications. J Public Health Policy 2009;30(1):248-63.
21. Oreskovic NM, Perrin JM, Robinson AI, Locascio JJ, Blossom J, Chen ML, et al. Adolescents’ use of the built environment for physical activity. BMC Public Health 2015;15(1):1-9.
CORRESPONDING AUTHOR
Sofia Wolker Manta Salmões avenue, 874 Zip Postal: 88053365, Florianopolis, Brazil.
E-mail: [email protected] 23. Cerin E, Cain KL, Conway TL, Van Dyck D, Hinckson E, Schipperijn J, et
al. Neighborhood environments and objectively measured physical activity in 11 countries. Med Sci Sports Exerc 2014;46(12):2253-2264.
24. Macedo J, Haddad MA. Equitable distribution of open space: Using spatial analysis to evaluate urban parks in Curitiba, Brazil. Environ Plan 2015;43(6):1096-117.