DOI: http://dx.doi.org/10.5007/1980-0037.2017v19n4p480
Quality of public urban parks for physical
activity practice in Bucaramanga, Colombia
Qualidade dos parques públicos urbanos para a prática
de atividades físicas em Bucaramanga, Colômbia
Paula Camila Ramírez1,2
Diana Marina Camargo1
Vanessa Quiroga3
Ana Paola Rios4
Rogério César Fermino5,6
Olga L. Sarmiento4
Abstract - he characteristics of parks (availability, accessibility, conservation, quality, safety, etc.) are important predictors of their use for physical activity practices. he aim of this study was to verify the association among the socioeconomic level of neighborhoods, the characteristics and quality of urban public parks for physical activity in Bucaramanga, Colombia. Cross-sectional study, conducted in 2015, in which 10 parks with structures for physical activity were evaluated. he socioeconomic level of the district was evaluated based on the neighborhoods around the parks and classiied in “low” and “high”. he number of residents in the surrounding area of parks were evaluated with Geographic Information System (GIS), site characteristics and quality with the System for Observing Play and Recreation in Communities (SOPARC) and the Physical Activity Resource Assessment (PARA), respectively. he association was analyzed with Mann Whitney U test and Spearman correlation (rho) on STATA 14 and the signiicance level was main-tained at 5%. A positive association was found between the socioeconomic level and the presence of walking paths (marginal, p=0.056), accessibility (rho=0.875; p=0.001) and general quality of parks (rho=0.657; p=0.039). he low socioeconomic level was associ-ated with the presence of sports courts (p=0.032). hese results can guide the actions of public managers for the modiication of the built environment and structures of the parks for physical activity.
Key words: Environment; Green Areas; Motor Activity; Parks; Social Class.
Resumo - As características dos parques (disponibilidade, acessibilidade, conservação, qualidade, segurança, etc.) são importantes preditores da sua utilização para a prática de atividades físicas. O objetivo deste estudo foi veriicar a associação entre o nível socioeconômico dos bairros com as características e a qualidade dos parques públicos urbanos para a prática de atividades físicas em Bucaramanga, Colômbia. Estudo transversal, realizado em 2015, no qual foram avaliados 10 parques com estruturas para atividades físicas. O nível socioeconômico da região foi avaliado com base nos bairros próximos aos parques e classiicado em “baixo” e “alto”. O número de resi-dentes próximos foi avaliado com o Sistema de Informação Geográica (SIG), as características do local e a qualidade foram avaliadas, respectivamente, com o System for Observing Play and Recreation in Communities (SOPARC) e o Physical Activity Resource Assessment (PARA). A associação foi analisada com o teste U de Mann Whitney e a correlação de Spearman (rho) no STATA 14 e o nível de signiicância mantido em 5%. Foi veriicada associação positiva entre o nível socioeconômico e a presença de pistas de caminhada (marginal, p=0,056), acessibilidade (rho=0,875; p=0,001) e qualidade geral dos parques (rho=0,657; p=0,039). O baixo nível so-cioeconômico foi associado à presença de quadras para esportes (p=0,032). Esses resultados podem orientar as ações dos gestores públicos para a modiicação do ambiente construído e estruturas dos parques para a atividade física.
1 Universidad Industrial de Santan-der. School of Physical Therapy. Re-search Group in Movement, Harmony and Life. Bucaramanga. Colombia. 2 Universidad Santo Tomás. Rese-arch Group in Being, Culture and Movement. Bucaramanga. Colombia. 3 Universidad Industrial de San-tander. School of Civil Engineering. Research Group in Geomatics, Ma-nagement and Systems Optimization. Bucaramanga. Colombia.
4 Universidad de los Andes. School of Medicine. Group of Epidemiology at the University of los Andes. Bogota D.C. Colombia.
5 Federal University of Technology - Parana. Postgraduate Program in Physical Education. Research Group in Environment, Physical Activity and Health. Curitiba, PR. Brazil. 6 Pontifical Catholic University of Parana. Research Group in Physical Activity and Quality of Life. Curitiba, PR. Brazil.
INTRODUCTION
Characteristics of the built environment are positively associated with leisure time physical activity1. In this sense, the access to locations such as parks, plazas and bicycle routes becomes important for the development of active healthy lifestyles in the population2-5. Aspects such as the avail-ability of areas for walking, green areas and access to recreational facilities as well as the aesthetics of the surroundings are positively associated with physical activity1,2,6.
Diferent characteristics of parks may inluence its use2,6. Among them are accessibility, availability, conservation and quality, land use, programming, safety and services ofered2,4,6-11. he availability, access, characteristics and quality of public open spaces are associated to the socioeconomic level of neighborhoods12. Evidence shows that living in areas of low socioeconomic level is inversely associate to physical activity, which could be explained by lack of adequate spaces for practice13-15. his is important, once in Colombia (Bogotá) it was found that 55% of the population uses parks and plazas for physical activity and, moreover, that the use of these spaces can increase in 310% the likelihood of reaching the recommendations of physical activity for health, in leisure time5.
Evidence of quality and availability of public open spaces and its use for physical activity has been published in the past years4. Nonetheless, most of the studies were conducted in high-income countries such as United States, Canada and Australia4,16-18, which may not represent the sociocultural and urban reality of middle-income countries such as those in Latin America1. In Brazil, three studies assessed the presence and quality of public open spaces for physical activity in the cities of Rio de Janeiro-RJ and Pelotas-RS, and results showed that most locations have adequate structures, beyond the safety issue, cleanliness and other structures for usercomfort12,19,20.
In Colombia, no studies have been conducted on the quality of public urban parks for physical activity practice and its relationship with socioeconomic levels of the neighborhoods where they are located. he understanding of this relationship is important for local managers to be able to redirect interventions, to improve the quality of parks for physical activity in the community level.
he aim of this study was to analyze the association between the socioeconomic level of neighborhoods and the characteristics and quality of public urban parks for physical activity in Bucaramanga, Colombia.
METHODOLOGICAL PROCEDURES
Study location
Santander and is divided into 17 regions, which include neighborhoods, settlements, and urbanized areas. A region is an administrative unit in which the urban area is divided and aggregates diferent neighborhoods.
he architecture of Bucaramanga was inluenced by colonial heritage. Until the second half of the 19th century there were plazas conceived as a signal of progress and liberty, in which symbols and heroes of the nation were recognized, but there was a lack of aesthetics and environmental values. From the second half of the 19th century and until about half of the 20th century, Bucaramanga went through an economic up growth and civil processes where the inhabitants supported urban changes, inluenced by those living in the capital, Bogota, and many cities abroad. In this period a signiicant transformation of plazas and parks occurred. In 1920, institutions were created to preserve the beauty and urban memory of the city, as the Sociedad de Mejoras Públicas y la Academia de Historia (Society for Public Improvement and History Academia, in English).
his process of transformation was so signiicant for the country that, in the 20th century, Bucaramanga was called “the city of parks”. In 2015, the World Bank declared it the most prosperous city in Latin America and an example to the world. Moreover, the city has united with the initiative “Up-coming and sustainable cities” of the Inter-American Development Bank, which highlighted the city shows an important deicit of public space, with 4.5 m2/inhabitant, while the international level is of 10-15m2 inhabitant.
Project, design and ethical aspects
he data for this study are part of the project entitled “Actividad física y parques en Bucaramanga, caracterización y factores relacionados con su uso” (in English, Physical activity and parks in Bucaramanga, characterization and factors related to use), an observational and cross-sectional study. he project was approved by the ethics committee for human investigation of the School of Health at the Industrial University of Santander (7083 #12 of May 23rd, 2014).
Selection of parks
According to the Director Plan for Territory of Bucaramanga, there are two regional parks, eight metropolitan parks, six proposed of metropoli-tan scale, eight with a zonal scale, 31 parks at a local scale and 18 pocket parks in the 17 regions. Public parks, with free access and classiied in the category of “local/zonal parks”, that ofered spaces for free sport, child and adult play, active and passive recreation were selected21.
Ten parks were intentionally selected (igure 1 and table 1), representa-tive of the same number of regions. Five of the regions were excluded because there were no parks that would ill the criteria and other two did not present minimum safety conditions for data collection.
Training and data collection
of six surveyors. he observers were trained by researchers who previously applied the System for Observing Play and Recreation in Communities (SOPARC) protocol. he training included a theory and practice compo-nent. he theory component was conducted by an expert during three-day workshop (16 hours), in which trained observers were familiarized with the SOPARC method (operational deinitions, instruments notation and coding conventions). SOPARC training materials, available at the Active Living Research website22 were used to train observers as well. he practice component was conducted in two days (six hours) through work ield in parks, comparing results between observers and receiving feedback from coordinators, a total of 19 hours of training. he parks were evaluated between August and December 2015.
Independent variable – neighborhood income
Neighborhood income was classiied according to the categories available in Colombia, in six levels, from one (lower) to six (higher). he levels one through three were classiied as “low” and correspond to the area in which inhabitants have less resource and are subsidized by the government. Levels four through six correspond to the “high” socioeconomic level, and pay contribution on public services23. For this study, the park socioeconomic level was calculated by the sum of the strata of each building and divided by the number of buildings in a service area of 500 meters surrounding the park by the road network. herefore, parks were classiied into two groups, “low” (1-3) and “high” (4-6) socioeconomic level.
Dependent variables
• Number of people within 500 meters of a park and park area
he number of people within 500 meters of a park and park area (m2) were calculated with aGeographic Information System (GIS) with secondary data from the national24, with a road network bufer of 500 meters from the centroid point in each park, using software ArcGIS 9.0.
• Target areas for physical activity
To evaluate the target areas for physical activity, SOPARC protocol was used, developed to obtain observational data in public places25. SOPARC has been widely used to evaluate parks and public open spaces in the com-munity and has been used recently in Latin America8,26,27.
• Evaluation of target areas
addition, the conditions (accessible, usable, equipped, supervised, organ-ized, dark, empty) of selected areas were assessed with yes/no25. SOPARC observations were conducted by four trained observers under the supervision of two ield coordinators.
• Quality of parks for physical activity
he Physical Activity Resource Assessment (PARA) instrument was devel-oped to systematically identify and describe the type, features, amenities, and quality of physical activity resources in urban neighborhoods14,28. his instrument was translated and adapted to the Latin American context29 and has been used recently in Latin America regions12,29. he evaluation was conducted by one ield coordinator.
he adapted PARA identiies and qualiies the conditions of parks into six domains: 1) features for physical activity (e.g.: ields and courts for sports, exercise areas, trails for walking, running, skateboarding and roller skating, swimming pool, playgrounds); 2) amenities (e.g.: bathroom, benches, locker room, lighting, trash cans, picnic tables); 3) incivilities (e.g.: cleaning, aesthetics and safety – dog waste, garbage, broken glass, graiti/ tagging, vandalism, overgrown grass, stray dogs, litter); 4) services (e.g.: presence of cofee shops, food carts, loan of materials for physical activity, physical activity sessions); 5) accessibility (e.g.: presence of taxi and bus stops, parking, bike rack and bicycle path) and 6) safety (e.g.: presence of police station, police and private security).
he features and amenities items were classiied into four categories: “not present” (cod.: 0), “poor” (cod.: 1), “mediocre” (cod.: 2), and “good” (cod.: 3). Incivilities items were classiied into “not present” (cod.: 3) “a lit-tle” (cod.: 2) “some” (cod.: 1) or “a lot” (cod.: 0). Services, accessibility and security items were classiied into “absence” (cod.: 0) and “presence” (cod.: 1). he quality score in each domain was computed as the sum of items described above. General park quality was calculated by the sum of the six domains (features + amenities + incivilities + accessibility + services + safety).
Data analysis
RESULTS
Descriptive characteristics of parks
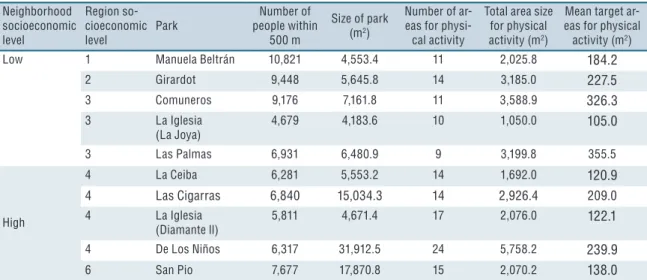
he mean size of the 10 parks evaluated was 123,000 m2; with a total of 139 target with a mean of 198.4 m2. he Parque de Los Niños located in a high income neighborhood had the largest area (31,912.5 m2), the larger number of target areas for physical activity (n=24) and largest area of target areas (5,758.2 m2). he Parque Comuneros was the largest within low socioeconomic level (7,161.8 m2), with a total of 11 target areas for physical activity and largest area of target areas (3,588.9 m2). he Parque
La Iglesia (La Joya) was the smallest (4,183.6 m2), had fewer target areas for physical activity (1,050.0 m2) and is located in a low socioeconomic level neighborhood (Table 1).
Characteristics, target areas and quality of parks
he mean number of people within 500 meters of parks was 7,398±1,887 and the size of parks was 10,306.8±8,929.2 m2. Nonetheless, the socio-economic level was not associated with these variables (p=0.103) (table 2). A total of 139 target areas were mapped and observed with a mean size of 2,757.2±1,317.6 m2. he parks with high socioeconomic level show more areas (84 versus 55). he socioeconomic level was not associated with the mean size of areas (p≥0.421) (table 2). Sports courts (41.4%) and walking paths (4.5%) were, respectively, the most and least observed areas (table 2).
Most target areas were accessible (99.0%), usable (97.4%) and supervised (69.9%). About 2.3% of areas were equipped and 0.2% was dark (table 2). In parks with high socioeconomic levels more usable (100%) and supervised (99.7%) areas were observed when compared to low socioeconomic level (usable: 94.7%; supervised: 40.1%) (table 2). Parks with low socioeconomic level showed high number of areas that was equipped (4.5%) and dark (0.4%) when compared to high socioeconomic level (equipped: 0.1%; dark: 0.0%). Nevertheless, the conditions of the area for physical activity were not associated to socioeconomic level (p≥0.095) (table 2).
he socioeconomic level was positively associated with the presence of walking paths (7.5 versus1.4%; p=0.056), the accessibility score (2.8±0.4 versus1.2±0.4; p=0.001) and general quality (30.4±4.6 versus 41.6±9.5; p=0.039) of the parks (table 2). he low socioeconomic level was associated to the presence of sports courts (p=0.032).
DISCUSSION
Table 1: Descriptive characteristics of parks, by socioeconomic level. Bucaramanga, Colombia, 2015 (n=10). Neighborhood socioeconomic level Region so-cioeconomic level Park Number of people within 500 m
Size of park (m2)
Number of ar-eas for physi-cal activity
Total area size for physical activity (m2)
Mean target ar-eas for physical
activity (m2)
Low 1 Manuela Beltrán 10,821 4,553.4 11 2,025.8 184.2
2 Girardot 9,448 5,645.8 14 3,185.0 227.5
3 Comuneros 9,176 7,161.8 11 3,588.9 326.3
3 La Iglesia (La Joya)
4,679 4,183.6 10 1,050.0 105.0
3 Las Palmas 6,931 6,480.9 9 3,199.8 355.5
High
4 La Ceiba 6,281 5,553.2 14 1,692.0 120.9
4 Las Cigarras 6,840 15,034.3 14 2,926.4 209.0
4 La Iglesia (Diamante ll)
5,811 4,671.4 17 2,076.0 122.1
4 De Los Niños 6,317 31,912.5 24 5,758.2 239.9
6 San Pio 7,677 17,870.8 15 2,070.2 138.0
Table 2: Association between socioeconomic level, characteristics and quality of public urban parks for physical activity. Bucaramanga,
Colombia, 2015 (n=10).
Low (n=5)
High
(n=5) sig.
a All
(n=10) Rho sig.
Number of people within 500 m
Average ± SD 8,211 ± 2418 6,585 ± 711 0.222 7,398 ± 1,887 -0.500 0.141 min. – max. 4,679 - 10,821 5,811 - 7,677 4,679 - 10,821
Size of park (m2)
Average ± SD 5,605.1 ± 1256.9 15,008.4 ± 11,070.2 0.174 10,306.8 ± 8,929.2 0.545 0.103 min. – max. 4,183.6 - 6,480.9 4,671.4 - 31912.5 4,183.6 - 3,1912.5
Target areas for physical activity
Number 55 84 - 139
Percentage 39.6 60.4 - 100.0
Total size (m2) 1,3049.5 1,4522.8 - 27,572.3
-Average ± SD 2,609.9 ± 1,050.2 2,904.6 ± 1658.1 0.943 2,757.2 ± 1,317.6 0.013 0.972 min. – max. 1,050.0 - 3,588.9 1,692.0 - 5,758.2 1,050.0 - 5,758.2
Size by area (m2)
Average ± SD 239.7 ± 102.8 165.9 ± 54.9 0.421 202.8 ± 86.9 -0.266 0.457 min. – max. 105.0 - 355.5 120.9 - 239.9 105.0 - 355.5
Type of target area for physical activity (%)
Sports courts 54.5 28.3 0.032 41.4 -
-Child play 23.7 23.0 1.000 23.3 -
-Fitness Zones 13.5 18.6 0.690 16.1 -
-Strength training 6.9 10.5 0.841 8.6 -
-Green areas* 0.0 12.1 0.310 6.1 -
-Walking paths 1.4 7.5 0.056 4.5 -
-Conditions of target areas for physical activity (%)
Accessible 98.0 99.8 0.690 99.0 -
-Usable 94.7 100.0 0.548 97.4 -
-Supervised 40.1 99.7 0.095 69.9 -
-Empty 54.3 45.2 0.421 49.8 -
-Organized 3.8 2.5 0.690 3.1 -
-Equipped 4.5 0.1 0.841 2.3 -
-services and safety against crime. he methods used allowed to represent the parks according to socioeconomic level of the neighborhoods, describe and compare its structures for physical activity, which is one of the strong of this study. Previous studies conducted in Latin America have only described the conditions of parks, but not relate it to neighborhood socioeconomic level19,20. his information should be used for better decision-making in public investment for the promotion of physical activity in the population of Bucaramanga.
he socioeconomic level was not associated to the mean number of people living within 500 meters from parks (p=0.141). In Pelotas, Brazil, Silva et. al.20 veriied inverse relationship between population density and number of available spaces for physical activity. he population density around the parks may represent potential users, so it is necessary to gener-ate public policy to improve the quality conditions of parks and establish strategies to motive the active use of those parks30.
In the present study, there was no signiicant association between the socioeconomic level and the size of parks (p=0.103). However, parks in high socioeconomic level neighborhoods area almost three times larger (15,008.4 versus 5,468.9 m2). Cohen et. al.30 conducted a study in 174 parks of 25 cities in the United States and veriied the positive associa-tion between socioeconomic level and size of parks (10.0 versus 7.8 acres,
Low (n=5)
High
(n=5) sig.a
All
(n=10) Rho sig.
Park quality (score)
Structure for physical activity
Average ± SD 10.2 ± 1.9 16.6 ± 6.4 0.095 13.4 ± 5.6 0.504 0.138
min. – max. 8.0 - 13.0 8.0 - 25.0 8.0 - 25.0
Structure for user benefit
Average ± SD 7.2 ± 1.9 8.4 ± 1.5 0.310 7.8 ± 1.8 0.244 0.497
min. – max. 5.0 - 10.0 6.0 - 10.0 5.0 - 10.0
Cleanliness. aesthetics and safety
Average ± SD 10.2 ± 1.6 10.0 ± 2.4 0.548 10.1 ± 1.9 0.091 0.803
min. – max. 9.0 - 13.0 8.0 - 13.0 8.0 - 13.0
Services
Average ± SD 0.8 ± 1.1 2.0 ± 0.7 0.151 1.4 ± 1.1 0.514 0.129
min. – max. 0.0 - 2.0 1.0 - 3.0 0.0 - 3.0
Accessibility
Average ± SD 1.2 ± 0.5 2.8 ± 0.5 0.008 2.0 ± 0.9 0.875 0.001
min. – max. 1.0 - 2.0 2.0 - 3.0 1.0 - 3.0
Safety against crime
Average ± SD 0.8 ± 1.1 1.6 ± 1.3 0.310 1.2 ± 1.2 0.429 0.216
min. – max. 0.0 - 3.0 0.0 - 3.0 0.0 - 3.0
General quality** 30.4 ± 4.6 41.6 ± 9.5 0.056 35.9 ± 9.1 0.657 0.039
min. – max. 26.0 - 37.0 27.0 - 52.0 26.0 - 52.0
SD: standard deviation; min.: minimum; max.: maximum; rho: Spearman correlation coefficient for association with region socioeconomic level; a: U Mann Whitney test; *Green areas, plazas, roundabouts; **General quality = score for structures for physical activity + structures’ for user benefit + cleanliness, aesthetics and safety + services + accessibility + safety against crime.
p=0.003). he lack of association in this study can be explained by the small number of parks in the sample and their great variability in size. In fact, the assessed parks in high socioeconomic level neighborhoods are larger in total area, but average size of physical activity areas is similar to those parks assessed in low socioeconomic level neighborhoods (2,904.6 versus 2,609.9 m2, p=0.943).
A few limitations need to be considered for the adequate interpreta-tion and extrapolainterpreta-tion of the results of this study. he parks were selected by convenience and their potential for physical activity in the community. herefore, there is no total representation of the regions. he sample did not include ive regions from the 17 total, due to the fact that there were no parks itting the inclusion criteria; additionally, 2/17 parks could not be evaluated due to lack of safety.
CONCLUSION
A positive association was found between the socioeconomic level and the presence of walking paths, accessibility and general quality of parks. he low socioeconomic level was associated to the presence of sports courts.
hese results can be a tool to support manager to fundament their ac-tions based in the modiication of the community environment for promo-tion of physical activity. It is necessary to improve the quality of parks in low income neighborhoods to attract the population to those places. he improvement in the quality of parks is a promising initiative to increase weekly frequency of use of parks for physical activity in costless and acces-sible locations for the entire community. Other studies could evaluate the perception of the people concerning the parks and the factors related to use for physical activity. his is important to know how sociodemographic and cultural characteristics and the perception of parks can be associated to their use. Also, future studies in Latin America should assess the efect of implementation and/or improvement in quality of parks and levels of physical activity in the community.
Funding
This study was funded by COLCIENCIAS, #686-2014 (project 110265740960).
REFERENCES
1. Sallis JF, Bull F, Guthold R, Heath GW, Inoue S, Kelly P, et al. Progress in physi-cal activity over the Olympic Quadrennium. Lancet 2016; 388(10051):1325-36.
2. Bedimo-Rung AL, Mowen AJ, Cohen DA. he signiicance of parks to physical activity and public health: a conceptual model. Am J Prev Med 2005; 28(2 Suppl 2):159-68.
3. Cohen DA, McKenzie TL, Sehgal A, Williamson S, Golinelli D, Lurie N. Contri-bution of public parks to physical activity. Am J Public Health 2007;97(3):509-14.
4. Fermino RC, Reis RS. Individual, environmental and social variables associated with the use of public open spaces for physical activity practices: a systematic review. Rev Bras Ativ Fis Saúde 2013;18(5):523-35.
5. Salvo D, Sarmiento OL, Reis RS, Hino AA, Bolivar MA, Lemoine PD, et al. Where latin americans are physically active, and why does it matter? indings from the IPEN-adult study in Bogota, Colombia; Cuernavaca, Mexico; and Curitiba, Brazil. Prev Med 2016; S0091-7435(16)30264-X.
7. Cohen DA, Marsh T, Williamson S, Derose KP, Martinez H, Setodji C, et al. Parks and physical activity: why are some parks used more than others? Prev Med 2010;50 (Suppl 1):S9-12.
8. Hino AAF, Reis RS, Ribeiro IC, Parra DC, Brownson RC, Fermino RC. Using observational methods to evaluate public open spaces and physical activity in Brazil. J Phys Act Health 2010;7:(Suppl 2):S146-54.
9. Fermino RC, Reis RS, Hallal PC, Kaczynski AT. Who are the users of urban parks? a study with adults from Curitiba, Brazil. J Phys Act Health 2015;12(1):58-67.
10. Fermino RC, Reis RS, Hallal PC, de Farias Junior JC. Perceived environment and public open space use: a study with adults from Curitiba, Brazil. Int J Behav Nutr Phys Act 2013;10(35):1-10.
11. Lima AV, Fermino RC, Oliveira MP, Rodriguez Anez CR, Reis RS. Perceived distance to recreational facilities and the association with physical activity and exercise among adolescents in Curitiba, Parana State, Brazil. Cad Saude Publica 2013;29(8):1507-21.
12. Vieira MC, Sperandei S, Reis A, da Silva CG. An analysis of the suitability of public spaces to physical activity practice in Rio De Janeiro, Brazil. Prev Med 2013;57(3):198-200.
13. Lee RE, Mama SK, McAlexander KP, Adamus H, Medina AV. Neighborhood and PA: neighborhood factors and physical activity in African American public housing residents. J Phys Act Health 2011;8(Suppl 1):S83-90.
14. Lee RE, Mama SK, Adamus-Leach HJ, Soltero EG. Contribution of neighbor-hood income and access to quality physical activity resources to physical activity in ethnic minority women over time. Am J Health Promot 2015;29(4):210-6.
15. Hino AA, Reis RS, Sarmiento OL, Parra DC, Brownson RC. he built environ-ment and recreational physical activity among adults in Curitiba, Brazil. Prev Med 2011;52(6):419-22.
16. Evenson KR, Jones SA, Holliday KM, Cohen DA, McKenzie TL. Park charac-teristics, use, and physical activity: a review of studies using SOPARC (System for Observing Play and Recreation in Communities). Prev Med 2016;86:153-66.
17. Bancroft C, Joshi S, Rundle A, Hutson M, Chong C, Weiss CC, et al. Association of proximity and density of parks and objectively measured physical activity in the United States: a systematic review. Soc Sci Med 2015;138:22-30.
18. Joseph RP, Maddock JE. Observational park-based physical activity studies: a systematic review of the literature. Prev Med 2016;89:257-77.
19. Silva MC, Silva BA, Costa ATE. Public area conditions and physical activity practice in the city of Pelotas-RS, Brazil. Rev Bras Ativ Fis Saúde 2012;17(1):28-32.
20. Silva I, Mielke G, Nunes B, Böhm A, Cruz M, Blanke A, et al. Public open spaces in Pelotas (Brazil): distribution, quality and suitability for physical activity practice. Rev Bras Ativ Fis Saúde 2015;20(1):82-92.
21. Alcaldia de Bucaramanga, Secretaria de Planeación. Documento técnico de soporte de la revisión del plan de ordenamiento territorial del municipio de Bucaramanga 2013-2017. [cited 2016 Aug 16]. Available from: http://www.concejodebucara-manga.gov.co/planordenamientoterritorial/tomo1.pdf.
22. McKenzie TL, Cohen DA. Tools and measures SOPARC: System for Observing Play and Recreation in Communities. 2006. [cited 2016 Dec 15]. Available from: http://activelivingresearch.org/soparc-system-observing-play-and-recreation-communities.
23. Departamento Nacional de Estadística. Estratiicación socioeconómica: 2015; [cited 2016 Jan 24]. Available from: http://www.dane.gov.co/index.php/estratii-cacion-socioeconomica/generalidades.
24. Departamento Nacional de Estadística. Censo General: 2005. [cited 2016 Jan 24] [Available from: https://www.dane.gov.co/iles/censos/libroCenso2005nacional.pdf.
CORRESPONDING AUTHOR Paula C. Ramírez
Industrial University of Santander. School of Physical Therapy. Research Group in Movement, Harmony and Life (MAV). Bucaramanga, Colombia Carrera 32, no 29-31, Bucaramanga E-mail: [email protected]
26. Parra DC, McKenzie TL, Ribeiro IC, Ferreira Hino AA, Dreisinger M, Coniglio K, et al. Assessing physical activity in public parks in Brazil using systematic observation. Am J Public Health 2010;100(8):1420-6.
27. Santos MPM, Rech CR, Alberico CO, Fermino RC, Rios AP, David J, et al. Utility and reliability of an app for the System for Observing Play and Recreation in Communities (ISOPARC®). Meas Phys Educ Exerc Scie 2016;20(2):93-8.
28. Lee RE, Booth KM, Reese-Smith JY, Regan G, Howard HH. he Physical Ac-tivity Resource Assessment (PARA) Instrument: evaluating features, amenities and incivilities of physical activity resources in urban neighborhoods. Int J Behav Nutr Phys Act 2005;2:13.
29. Hino AA. Medidas objetivas e percebidas do ambiente do bairro e sua associação com a atividade física de lazer em adultos de Curitiba [Dissertation]. Curitiba, Brazil: Universidade Federal do Paraná; 2014.