Vol.47, n. 4 : pp. 613-627, August 2004
ISSN 1516-8913 Printed in Brazil
BRAZILIAN ARCHIVES OF
BIOLOGY AND TECHNOLOGY
A N I N T E R N A T I O N A L J O U R N A L
Predicting Biological Parameters of Estuarine Benthic
Communities Using Models Based on Environmental Data
José Souto Rosa-Filho
∗, Carlos Emílio Bemvenuti and Michael Elliott
Laboratório Oceanografia; Centro de Geociências - UFPA - Av. Augusto Corrêa, S/N - Guamá - Belém - PA, Brazil - CEP.66.075-110 e-mail: jsouto@ufpa.br; Lab. Ecologia de Invertebrados Bentônicos - Depto. Oceanografia - FURG Cx. P. 474 - Rio Grande - RS, Brazil - CEP 96201-490 e-mail:docbemve@furg.br; Institute of Estuarine and Coastal Studies - University of Hull - HU6 7RX - Hull, UK - e-mail: elliott@hull.ac.uk
ABSTRACT
This study aimed to predict the biological parameters (species composition, abundance, richness, diversity and evenness) of benthic assemblages in southern Brazil estuaries using models based on environmental data (sediment characteristics, salinity, air and water temperature and depth). Samples were collected seasonally from five estuaries between the winter of 1996 and the summer of 1998. At each estuary, samples were taken in unpolluted areas with similar characteristics related to presence or absence of vegetatio n, depth and distance from the mouth. In order to obtain predictive models, two methods were used, the first one based on Multiple Discriminant Analysis (MDA), and the second based on Multiple Linear Regression (MLR). Models using MDA had better results than those based on linear regression. The best results using MLR were obtained for diversity and richness. It could be concluded that the use predictions models based on environmental data would be very useful in environmental monitoring studies in estuaries.
Key-words: Prediction, models, benthos, estuary, Southern Brazil
∗ Author for correspondence
INTRODUCTION
Studies analysing factors and processes underlying the structure of biological communities have shown that these factors and processes are dynamic and vary in importance according to the spatio-temporal scale under consideration (Wolff, 1983; Levinton, 1995). This variability is even more perceptible in estuaries where organisms are permanently subjected to stressful environment, which requires caution when interpreting changes in biological communities (Wilson and Jeffrey, 1994). Ecologists face the challenge of identifying the conditions under which different processes or factors may be important and to develop models
there is an increasing need for this type of models (Elliott, 1994; Allen, 1999a). These models can be useful in environmental monitoring and management studies since they can either be used to predict species and parameters for unknown areas or to identify departures of the observed biota from that predicted by the models for unpolluted areas (Clarke et al., 1996; Chessman, 1999).
The first attempt to use predictive models for aquatic communities was in England in the early 80s with the development of the RIVPACS (River InVertebrate Prediction and Classification System) (Wright et al., 1989). The starting point of RIVPACS was a cluster analysis used in order to identify groups of sites with similar biological characteristics. A multiple discriminant analysis using environmental data was then performed to create discriminant functions that distinguished the various macroinvertebrate-based site groups. The derived discriminant functions are used to predict macroinvertebrate fauna for new sites (test sites). Once the test site’s environmental characteristics have been determined, their values can be inserted into the discriminant functions, and the resultant values used to determine the site’s probability of membership of each group of reference sites. The probability of occurrence of each taxon at the test site can then be estimated from the frequency of occurrence of the taxon in each reference group (Moss et al., 1987).
Another useful method for predicting biological parameters in benthic communities based on environmental characteristics is the use of multiple linear regression analysis. This method aims to fit the best equation between biological and environmental variables allowing for predictions (Elliott and O´reilly, 1991).
This study tested two analytical methods based on environmental data to predict biological parameters (specific composition, richness, abundance, diversity and evenness) of soft bottom benthic communities in South Brazil estuaries.
MATERIAL AND METHODS
Study area
The studied estuaries are located in the Rio Grande do Sul State in South Brazil. These estuaries are part of coastal lagoons (Tramandaí/Armazém Complex, Lagoa do Peixe and Lagoa dos Patos) or
rivers (Mampituba River and Chuí River) . Lagoa
dos Patos is the biggest lagoon (10360 km2) and
Tramandaí/Armazém Complex is the smallest
(18.8 km2). Rio Mampituba and Rio Chuí are like
channels (length of 5-10 km and maximum depth of 2 m) (Schwarzbold and Schäfer, 1984).
The benthic fauna in the five estuaries consists of few species (maximum 22 species), where Crustacea and Polychaeta are dominant. The most
abundant species are Kallipaseudes schubartii
(Crustacea, Tanaidacea), Heteromastus similes
(Annelida, Polychaeta) and Heleobia australis
(Mollusca, Gastropoda) (Bemvenuti, 1997, Rosa-Filho and Bemvenuti, 1998a).
Field and laboratory procedures
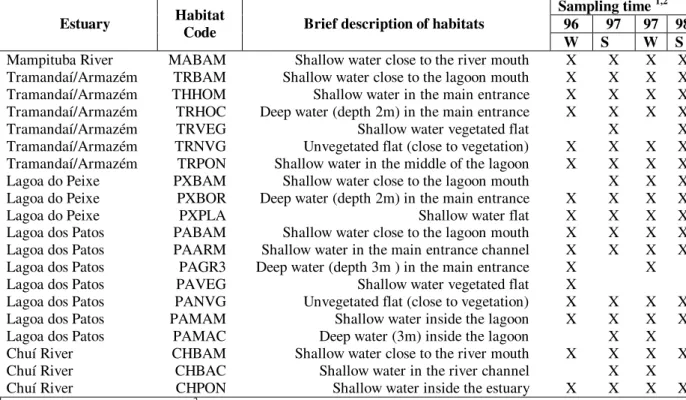
Samples were collected from the five estuaries in four occasions: August 1996 (winter), March 1997 (summer), August 1997 (winter) and March 1998 (summer). At each estuary, sampling took place in unpolluted areas with similar characteristics, henceforth called habitats (Table 1). The number of habitats sampled at each estuary varied according to the size of the estuary and to the presence of habitats at the sampling time.
Each habitat was divided into two stations 30 m apart of each other. Five samples were taken from each station for biological analyses. Sampling was
carried out using a van Veen grab (0.079 m2) at
places deeper than 1 m. Conversely, a PVC corer
(0.0079 m2) was used in shallower waters. When
the grab was used, sub-samples were taken (one per grab) with the corer in order to standardize the sample size. Samples were sieved with a 0.3 mm nylon mesh and the captured organisms were fixed in 5% formalin in seawater.
At each station three samples were taken for both sediment analyses (using a 5 cm inner diameter corer, 5 cm deep) and chlorophyll a determination
(using a 0.94 cm2 corer, 1 cm deep).
Mean particle diameter, sorting, skewness, kurtosis and total organic carbon were determined in sediments using the procedures described in Holme and McIntire (1984). The concentration of
chlorophyll a in the sediments was determined by
the fluorometric method (Welschmeyer, 1994). Sediment complexity was estimated using the
Shannon-Weiner diversity index (log2) using the
Table 1 - Brief description of habitats in the four studied estuaries.
Sampling time 1,2
96 97 97 98
Estuary Habitat
Code Brief description of habitats
W S W S
Mampituba River MABAM Shallow water close to the river mouth X X X X Tramandaí/Armazém TRBAM Shallow water close to the lagoon mouth X X X X Tramandaí/Armazém THHOM Shallow water in the main entrance X X X X Tramandaí/Armazém TRHOC Deep water (depth 2m) in the main entrance X X X X Tramandaí/Armazém TRVEG Shallow water vegetated flat X X Tramandaí/Armazém TRNVG Unvegetated flat (close to vegetation) X X X X Tramandaí/Armazém TRPON Shallow water in the middle of the lagoon X X X X Lagoa do Peixe PXBAM Shallow water close to the lagoon mouth X X X Lagoa do Peixe PXBOR Deep water (depth 2m) in the main entrance X X X X
Lagoa do Peixe PXPLA Shallow water flat X X X X
Lagoa dos Patos PABAM Shallow water close to the lagoon mouth X X X X Lagoa dos Patos PAARM Shallow water in the main entrance channel X X X X Lagoa dos Patos PAGR3 Deep water (depth 3m ) in the main entrance X X Lagoa dos Patos PAVEG Shallow water vegetated flat X
Lagoa dos Patos PANVG Unvegetated flat (close to vegetation) X X X X Lagoa dos Patos PAMAM Shallow water inside the lagoon X X X X Lagoa dos Patos PAMAC Deep water (3m) inside the lagoon X X Chuí River CHBAM Shallow water close to the river mouth X X X X Chuí River CHBAC Shallow water in the river channel X X Chuí River CHPON Shallow water inside the estuary X X X X
1 96 = 1996, 97 = 1997, 98 = 1998; 2 W = Winter, S = Summer.
Data analysis
Mean value of the five biological samples and of the three abiotic samples taken at each station were used as sampling unit, totaling 138 samples (Rosa-Filho, 2001). Two methods were used to obtain predictive models. The first one was based on Multiple Discriminant Analysis (MDA) and the second, on Multiple Linear Regression (MLR). Prior to the analysis, two data sets were prepared: the first set contained data from all the estuaries (n=138) and the second, samples only from Lagoa dos Patos and Tramandaí/Armazém Complex (n=86). The creation of a data set with stations only from Lagoa dos Patos and Tramandaí/Armazém complex was justified by the fact that these estuaries were the largest, the most exhaustively sampled, and had the largest volume of information available from previous studies.
Prediction using Multiple Discriminant Analysis (MDA)
Firstly, a cluster analysis (TWINSPAN) was carried out for each data set using the values 0, 0-252, 253-1265, 1266-7594, 7594-12657, 12658-126582, +126582 as cut-off for pseudo-species. The groups formed were then used as categorical variables in discriminant analysis based on
environmental data. Groups with only one sample were excluded (McGarigal et al., 2000).
The environmental variables employed were sediment characteristics (mean particle diameter, median, sorting, skewness, kurtosis, % gravel, % sand, % silt, % clay, % organic matter,
concentration of chlorophyll a and sediment
heterogeneity) and salinity. Prior to the MDA, data were transformed using different transformations (log (x+1), square root, fourth root and log ratio), as appropriate.
The STATISTICA® version of MDA was used and
the best combination of environmental variables in the model was achieved through extensive trials testing variables one by one. The discriminant scores obtained were used to predict specific composition and richness, using only significant functions (Moss et al., 1987).
using a one-way Analysis of Variance (ANOVA). Prediction success was assessed separately for stations located in channel and estuarine mouths and, for shallower water habitats inside estuaries.
Prediction using Multiple Linear Regression (MLR)
Prior to performing regression analyses, normality of data distributions were tested using the Kolmogorov-Smirnov’s test. When necessary, data were transformed using different transformations as appropriate (log (x+1), square root, fourth root, log ratio). Biological and environmental parameters used were: abundance, richness, diversity, evenness and ratio abundance/richness, sediment mean particle diameter, median, sorting, skewness, kurtosis, % gravel, % sand, % silt, % clay, % organic matter, concentration of chlorophyll a, sediment heterogeneity and salinity.
The SPSS 9.0 version of MLR was used with ‘Backward removal’ option in order to find the equations representing the best fit between biological and environmental parameters. The success of predictions was assessed by comparing the lines derived from the models and the ideal lines (where predicted and observed values are the same).
RESULTS
Models for all estuaries data set
Cluster analysis formed 13 groups at a level of 4 divisions. The best model derived by MDA
included median, skewness, H’sediment, kurtosis, %
organic matter, % gravel, % sand, % clay, chlorophyll a and salinity being able to correctly
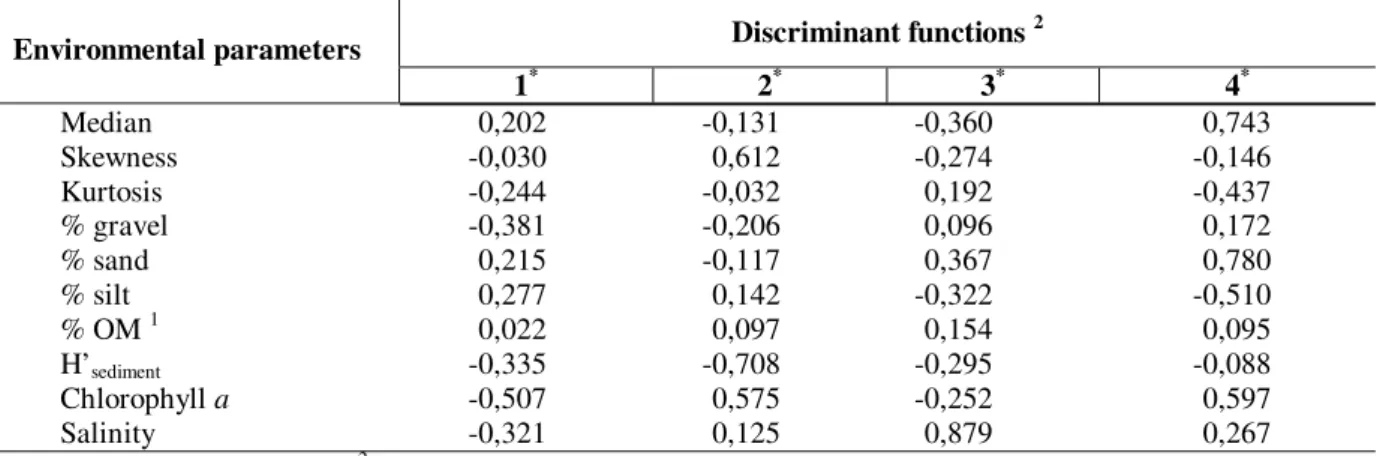
classify a mean of 59% of samples. Standardized scores for each variable in the four discriminant functions are shown in Table 2.
Table 3 summarizes prediction results for species with more than 50 and 70% probability of occurrence and for the number of species in 30 samples used to validate the model (for details see Moss et al., 1987). Considering all habitats together, the model correctly predicted 82% and 76% species with probability of occurrence higher than 75% and 50%, respectively. When shallower water habitats inside estuaries were considered separately, the model increased its power of prediction.
The ANOVA revealed that the model generally tended to significantly overestimate (p<0.05) the number of species in the habitats close to the mouth of estuaries and underestimate richness in shallower areas, inside estuaries (even not significantly, p>0.05). Based on MLR, best fits
were obtained for richness (r2=0.46), abundance
(r2=0.26) and diversity (r2=0.26). The equation
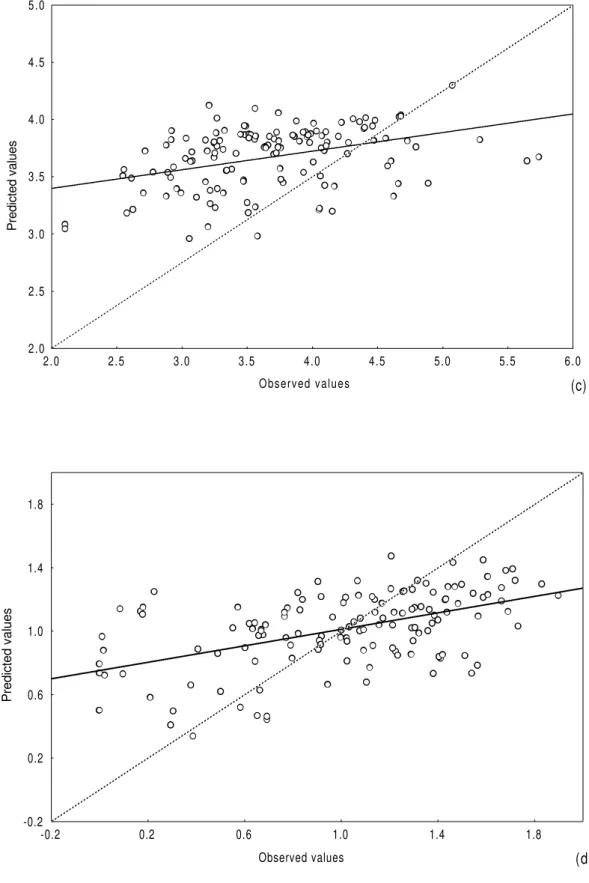
derived from the evenness explained less than 10% of variance in the data and, hence, is not presented in Table 4. Comparing predicted and observed values for the biological parameters, there was general agreement, mainly in relation to richness, diversity and abundance. Although the equations for A, S, A/S and H’ were statistically very significant (p<0.01), they tended to overestimate low values and underestimate high ones (Fig. 1a-d).
Table 2 - Standardized scores for each biological parameter derived by MDA for each discriminant function (all estuaries data set).
Environmental parameters Discriminant functions
2
1* 2* 3* 4*
Median 0,202 -0,131 -0,360 0,743
Skewness -0,030 0,612 -0,274 -0,146
Kurtosis -0,244 -0,032 0,192 -0,437
% gravel -0,381 -0,206 0,096 0,172
% sand 0,215 -0,117 0,367 0,780
% silt 0,277 0,142 -0,322 -0,510
% OM 1 0,022 0,097 0,154 0,095
H’sediment -0,335 -0,708 -0,295 -0,088
Chlorophyll a -0,507 0,575 -0,252 0,597
Salinity -0,321 0,125 0,879 0,267
Models for Lagoa dos Patos and Tramandaí/Armazém Complex data set
Cluster analysis formed 19 groups at a level of four divisions. The best model derived by MDA included the variables: mean, skewness, kurtosis, H’sediment, %organic matter, % sand, and amount of
chlorophyll a, and correctly classified a mean of
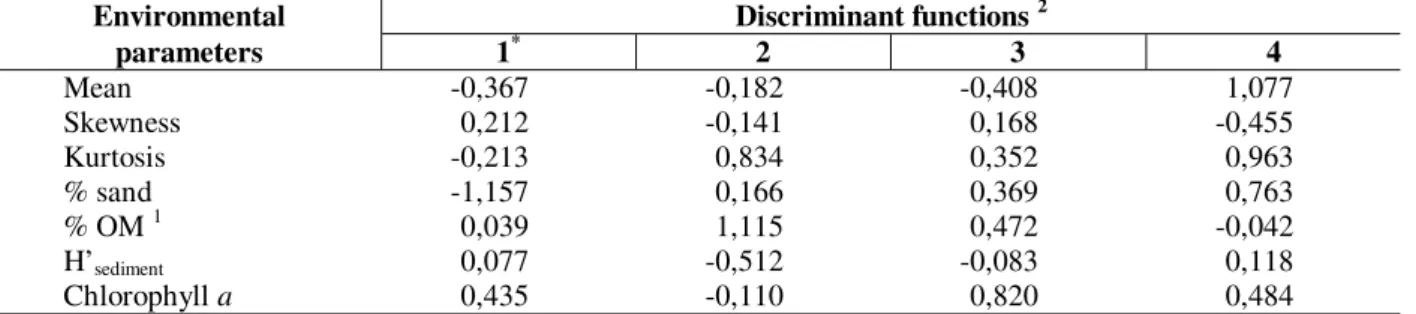
56% of samples. Only one discriminant function was significant. Standardized scores for each variable in the first four functions are in Table 5.
Table 6 gives the results of the predictions for species with more than 50 and 70% probability of occurrence and for the number of species in 30 samples used to validate the model. The proportion of species correctly predicted was generally higher in this model than in that derived for the dataset of all estuaries.
Table 3 - Predictions obtained based on the test sites (all estuaries data set).
Total percentage of species > 75% effectively captured 81 Total percentage of species >50% effectively captured 77 Total percentage of species >75% effectively captured in the mouth and channel habitats 58 Total percentage of species >50% effectively captured in the mouth and channel habitats 55 Total percentage of species >75% effectively captured in the shallower water habitats inside estuaries 95 Total percentage of species >50% effectively captured in the shallower water habitats inside estuaries 88 Percentage of the number of predicted species effectively captured in the mouth and channel habitats 72 Percentage of the number of predicted species effectively captured in the shallower water habitats
inside estuaries
> 100
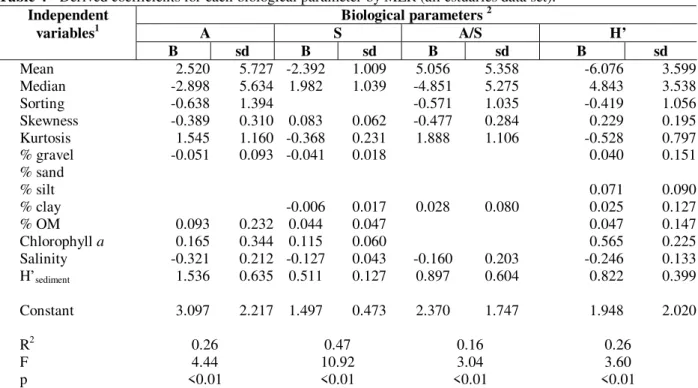
Table 4 - Derived coefficients for each biological parameter by MLR (all estuaries data set).
Independent Biological parameters 2
variables1 A S A/S H’
B sd B sd B sd B sd
Mean 2.520 5.727 -2.392 1.009 5.056 5.358 -6.076 3.599 Median -2.898 5.634 1.982 1.039 -4.851 5.275 4.843 3.538
Sorting -0.638 1.394 -0.571 1.035 -0.419 1.056
Skewness -0.389 0.310 0.083 0.062 -0.477 0.284 0.229 0.195 Kurtosis 1.545 1.160 -0.368 0.231 1.888 1.106 -0.528 0.797
% gravel -0.051 0.093 -0.041 0.018 0.040 0.151
% sand
% silt 0.071 0.090
% clay -0.006 0.017 0.028 0.080 0.025 0.127
% OM 0.093 0.232 0.044 0.047 0.047 0.147
Chlorophyll a 0.165 0.344 0.115 0.060 0.565 0.225
Salinity -0.321 0.212 -0.127 0.043 -0.160 0.203 -0.246 0.133 H’sediment 1.536 0.635 0.511 0.127 0.897 0.604 0.822 0.399
Constant 3.097 2.217 1.497 0.473 2.370 1.747 1.948 2.020
R2 0.26 0.47 0.16 0.26
F 4.44 10.92 3.04 3.60
p <0.01 <0.01 <0.01 <0.01
1 % MO = % of organic matter; 2 A = Abundance, S = Richness, A/S = Ratio abundance/richness, H’ = Diversity, sd = Standard
Observed values
Predicted values
1.5 2.0 2.5 3.0 3.5 4.0 4.5 5.0 5.5 6.0
1.5 2.5 3.5 4.5 5.5 6.5 7.5
(a)
Observed values
Predicted values
0.8 1.0 1.2 1.4 1.6 1.8 2.0
0.8 1.0 1.2 1.4 1.6 1.8 2.0
Figure 1 - Comparison between predicted and observed values for abundance (a), number of species
(b), ratio abundance/number of species (c) and diversity (d) (all estuaries data set).
Observed values
Predicted values
2.0 2.5 3.0 3.5 4.0 4.5 5.0
2.0 2.5 3.0 3.5 4.0 4.5 5.0 5.5 6.0
(c)
Observed values
Predicted values
-0.2 0.2 0.6 1.0 1.4 1.8
-0.2 0.2 0.6 1.0 1.4 1.8
Considering all habitats together, the model predicted correctly 95% and 70% of species with probability of occurrence higher than 75% and 50%, respectively. When habitats close to the estuarine mouth and channel zones, and those in shallower water inside the estuaries were considered separetely, the percentage of correctly predicted species increased considerably in the last habitats (Table 6). Although the model tended to underestimate the number of species in habitats close to the estuarine mouths and channel zones and to underestimate in areas inside estuaries, the ANOVA did not reveal a significant statistical difference (p >0.05) between the predicted and the observed number of species.
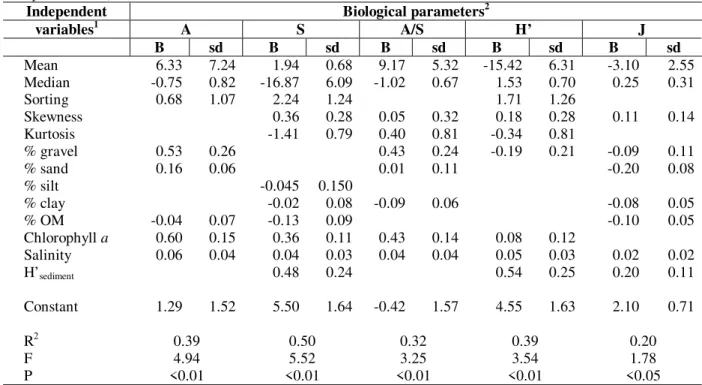
The best fits using MLR were obtained for
richness (r2=0,52), abundance (r2=0,39) and
diversity (r2=0,39) (Table 7). Comparing predicted
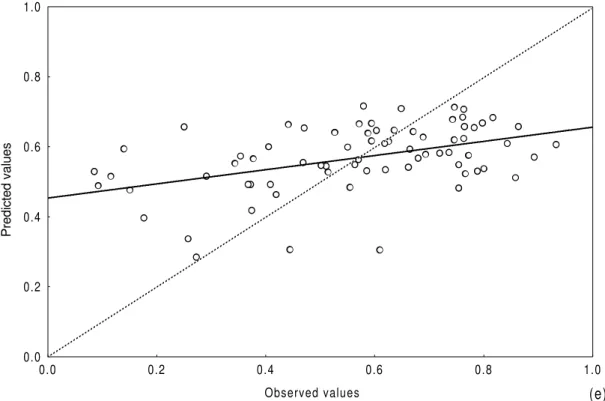
and observed values for the biological parameters, there was general agreement mainly for the number of species, diversity and abundance. Although the equations derived for all biological
parameters were statistically significant (p<0.05) or statistically very significant (p<0.01), the models tended to overestimate low values and underestimate high ones (Fig. 2a-e).
DISCUSSION
Over recent years, the discussion about the use of multivariate methods for description and assessment of biological systems has intensified due to the lack of consensus about the most reliable method for this purpose. Since no final conclusions have been reached, the best way of incorporating subsides for it is by comparing different methods using the same dataset in order to test their efficiency and reliability. In this study, two methods for prediction of biological parameters in benthic communities in estuarine regions in South Brazil were used.
Table 5 - Standardized scores for each biological parameter derived by MDA for each discriminant function (Lagoa
dos Patos and Tramandaí/Armazém complex data set).
Environmental Discriminant functions 2
parameters 1* 2 3 4
Mean -0,367 -0,182 -0,408 1,077
Skewness 0,212 -0,141 0,168 -0,455
Kurtosis -0,213 0,834 0,352 0,963
% sand -1,157 0,166 0,369 0,763
% OM 1 0,039 1,115 0,472 -0,042
H’sediment 0,077 -0,512 -0,083 0,118
Chlorophyll a 0,435 -0,110 0,820 0,484
1 % OM= % of organic matter; 2 Asterisk denotes significant function .
Table 6 - Predictions made for the test sites (Lagoa dos Patos and Tramandaí/Armazém Complex data set).
Total percentage of species > 75% effectively captured 95 Total percentage of species >50% effectively captured 70 Total percentage of species >75% effectively captured in mouth and channel habitats 88 Total percentage of species >50% effectively captured in mouth and channel habitats 60 Total percentage of species >75% effectively captured in shallow water habitats inside estuaries 98 Total percentage of species >50% effectively captured in shallow water habitats inside estuaries 79 Percentage of the number of predicted species effectively captured in mouth and channel habitats 94 Percentage of the number of predicted species effectively captured in shallow water habitats inside
The main criticisms about using models to predict biological parameters in biological communities based on environmental data are based on the absence of clear cause-effect relationship, difficulty in defining clear reference sites and lack of generality (Calow, 1992; Chessman et al., 1999). The empirical rather than causative nature of predictive models does not prevent it from
being used in this study since the emphasis in using predictive models was more for data exploration and hypothesis generation than for testing the significance of relations between biological and environmental variables. These tests would require more complex and formal tests, such as those applied for field and laboratory experiments.
Table 7 - Derived coefficients for each biological parameter by MLR (Lagoa dos Patos and Tramandaí/Armazém Complex data set).
Independent Biological parameters2
variables1 A S A/S H’ J
B sd B sd B sd B sd B sd
Mean 6.33 7.24 1.94 0.68 9.17 5.32 -15.42 6.31 -3.10 2.55 Median -0.75 0.82 -16.87 6.09 -1.02 0.67 1.53 0.70 0.25 0.31
Sorting 0.68 1.07 2.24 1.24 1.71 1.26
Skewness 0.36 0.28 0.05 0.32 0.18 0.28 0.11 0.14
Kurtosis -1.41 0.79 0.40 0.81 -0.34 0.81
% gravel 0.53 0.26 0.43 0.24 -0.19 0.21 -0.09 0.11
% sand 0.16 0.06 0.01 0.11 -0.20 0.08
% silt -0.045 0.150
% clay -0.02 0.08 -0.09 0.06 -0.08 0.05
% OM -0.04 0.07 -0.13 0.09 -0.10 0.05
Chlorophyll a 0.60 0.15 0.36 0.11 0.43 0.14 0.08 0.12
Salinity 0.06 0.04 0.04 0.03 0.04 0.04 0.05 0.03 0.02 0.02
H’sediment 0.48 0.24 0.54 0.25 0.20 0.11
Constant 1.29 1.52 5.50 1.64 -0.42 1.57 4.55 1.63 2.10 0.71
R2 0.39 0.50 0.32 0.39 0.20
F 4.94 5.52 3.25 3.54 1.78
P <0.01 <0.01 <0.01 <0.01 <0.05
1 % MO = % of organic matter; 2 A = Abundance, S = Species number, A/S = Ratio abundance/number of species, H’ =
Diversity.
The problem of defining clear reference sites was solved just sampling in areas known as not impacted by anthropogenic activities. Hence, it was possible to be sure that the derived models described assemblages in areas not impacted, which, thus, could be used as reference conditions for future studies of environmental monitoring. To deal with lack of generality, both in this study as well as others, the models were applied for making predictions only for the same areas and times of collection of the samples for its derivation.
Multiple discriminant analyses correctly classified 59% of samples in the dataset of all estuaries, and 62% of samples in the dataset including only stations from Lagoa dos Patos and the Tramandaí/Armazém complex. These results were better than those found by Chessman et al. (1999), who, when predicting diatom communities in
Australian rivers, obtained 42-43% of samples correctly classified. On the other hand, these results were lower than those found by Furse et al. (1984), Moss et al. (1987) and Parson and Norris (1996), who modeling freshwater benthic invertebrates in Australia, obtained from 68% to 85% of samples correctly classified. There were several reasons for the apparent lower predictive ability of models in our study, compared to other studies carried out in rivers: higher complexity of estuaries compared to fluvial environments (Day
et al., 1989; Little, 2000), the number of sites
Observed values
Predicted values
2.0 2.5 3.0 3.5 4.0 4.5 5.0 5.5
2.0 2.5 3.0 3.5 4.0 4.5 5.0 5.5 6.0 6.5
(a)
Observed values
Predicted values
1.2 1.6 2.0 2.4 2.8 3.2 3.6 4.0
1.2 1.6 2.0 2.4 2.8 3.2 3.6 4.0
Observed values
Predicted values
2.5 3.0 3.5 4.0 4.5 5.0 5.5
2.5 3.0 3.5 4.0 4.5 5.0 5.5
(c)
Observed values
Predicted values
0.0 0.4 0.8 1.2 1.6 2.0
0.0 0.4 0.8 1.2 1.6 2.0
Figure 2 - Comparison between predicted and observed values for abundance (a), number of species
(b), ratio abundance/number of species (c), diversity (d) and evenness (e) (Lagoa dos Patos and Tramandaí/Armazém Complex data set).
Although it has long been recognized that sediment characteristics are amongst the key factors controlling occurrence and distribution of benthic communities in estuaries (Snelglove and Buttman, 1994; Manino and Montagna, 1997), it is very important to keep in mind that models for description and prediction of ecological systems should ideally include variables reflecting the way organisms interact with the environment (organism-sediment relationships, physiological tolerances, etc) and with other organisms (predation, competition, commensalism, etc), as well as variables related to the natural history of the species (fertility, birth rate, mortality, etc), as referred by several authors (Snelglove and Buttman, 1994; Manino and Montagna, 1997). There is no doubt that best results would be achieved if the above variables together with chemical, physical and hydrological measurements were used.
Several authors (Capitoli et al., 1978; Bemvenuti, 1997) found that benthic organisms inhabiting areas close to estuaries’ mouths in Lagoa dos Patos were subjected to harsh environmental
conditions represented by strong and unpredictable changes in salinity and hydrodynamic regime. Using the abundance/biomass curve comparison in the estuaries of Rio Grande do Sul, Rosa-Filho and Bemvenuti (1998a) found that channel zones were generally classified as impacted, which supports the results obtained in this study.
The number of correctly predicted species varied from 81% to 95% species for those with more than 75% probability of occurrence, and from 70% to 77%, for those predicted with more than 50% probability of occurrence. These values were higher than those obtained by Allen (1999a), who found from 65 to 70% correctly predicted species for those predicted with more than 70% probability of occurrence in the coast of England. The models derived in this study correctly predicted from 91.5% (dataset of all estuaries) to 99.5% (dataset of Lagoa dos Patos and Tramandaí/Armazém complex) of number of species. Both models tended to overestimate the richness in poor habitats (few species), and underestimate rich ones. The same trend was observed by Allen (1999b) when predicting
Observed values
Predicted values
0.0 0.2 0.4 0.6 0.8 1.0
0.0 0.2 0.4 0.6 0.8 1.0
benthic fauna for marine environments in the
British coast. Moss et al. (1987) found that the
models derived to predict benthic fauna in freshwater tended to be conservative, generally predicting fewer species than observed. In the present study, the predictive ability of was either related to the stability of environmental conditions in habitats or to the mathematical methods used. All shallow water habitats inside estuaries in Rio Grande do Sul are known to have similar environmental conditions and fauna (Rosa-Filho and Bemvenuti, 1998b). These faunistic and environmental similarities lead to the fact that predictions made for species composition in one site based on data collected in other areas (in the same habitat) are probably confirmed. These habitats are also characterized by high richness, but low abundance (Bemvenuti 1997). As the species’ probability of occurrence in the procedure
of Moss et al. (1987) is based on the abundance
and the frequency of occurrence of taxa in the groups, low probability of occurrence is generally predicted for rare species. Thus, since the number of species predicted represents the sum of probability of occurrence of all species, the models tend to underestimate the richness in areas with lots of rare species, as observed in this study. Habitats close to the estuarine mouth and channel zones in the studied estuaries have extremely variable and unpredictable environmental conditions, which determines constant changes in faunal composition in a short period (Capitoli et al., 1978; Bemvenuti, 1997). This unpredictability results in species predictions based on data from other areas be seldom confirmed. As in these habitats the species present are generally abundant (opportunist species), models based on RIVPACS tend to predict a high probability of occurrence. As cited above, in order to predict the number of species, the probability of occurrence of each species is summed, which results in that, in areas with abundant species, the models tend to overestimate the richness, confirming the results obtained in this study.
The best results using the multiple regression method were obtained in both models for diversity and richness, which was consistent with Chessman (1999) and Elliott and O’Reilly (1991) findings. The highest predictive ability of this method resulted from the fact that the main environmental variables used for models derivation were sediment parameters. It is well known that substratum characteristics are key factors for
determining richness and diversity in benthic assemblages (Gray, 1981; Levinton, 1995; De Grave, 1999). By its time, abundance, ratio abundance/richness and evenness are related to dynamic communities, and for a proper prediction models should include variables related to species’ biology (birth and mortality rates, feeding mode, etc), as well as climatic variables (rainfall, temperature, humidity, etc.), as stated by Underwood (1996).
Models derived using discriminant analysis showed better results than those based on linear regression. These results were not consistent with the findings of Chessman (1999), who mentioned that one of main problems with methods like RIVPACS was that they begin with an unnecessary and sometimes dubious cluster analysis.
On the other hand, Moss et al. (1999) stated that
the RIVPACS approach was robust since it was relatively independent of the method for site classification as the predicted probability of occurrence of each taxon was calculated based on a weighted average across several groups according to the probability that the particular site belonged to each group, and cluster analysis was only an intermediate step to dissect what coud be a continuum.
Similar to our results, Constable (1999) pointed out that even though the findings obtained using deterministic models, such as those based on regression analysis, were very precise, there was little use in them since they suppose that parameters were very precisely measured, assuming a total understanding of the systems, and it is almost impossible to have such amount of knowledge in biological aquatic systems.
Both methods of model derivation had best predictive ability for the data set including only samples from Lagoa dos Patos and Tramandaí/Armazém complex. These results were already expected since these estuaries were most extensively sampled and known to have similar environmental characteristics and fauna, which favored predictions (Rosa-Filho and Bemvenuti, 1998b). Also, using only these two estuaries, many of sources of noise were excluded, since
Rosa-Filho et al. (in prep.) demonstrated that benthic
assemblages in Mampituba River, Lagoa do Peixe and Chuí River were very variable in both space and time.
could become useful tools in environmental monitoring studies. However, it would be important to consider when using these models that they were developed using data from samples collected in a short period of time (two years) and in few habitats. Before using them to make reliable predictions, it would be necessary to incorporate data of samples taken in more types of habitats and during a loger period (at least four or five years, along the four seasons).
RESUMO
Este trabalho objetivou predizer parâmetros da estrutura de associações macrobentônicas (composição específica, abundância, riqueza, diversidade e equitatividade) em estuários do Sul do Brasil, utilizando modelos baseados em dados ambientais (características dos sedimentos, salinidade, temperaturas do ar e da água, e profundidade). As amostragens foram realizadas sazonalmente em cinco estuários entre o inverno de 1996 e o verão de 1998. Em cada estuário as amostras foram coletadas em áreas não poluídas, com características semelhantes quanto a presença ou ausência de vegetação, profundidade e distância da desenbocadura. Para a obtenção dos modelos de predição, foram utilizados dois métodos: o primeiro baseado em Análise Discriminante Múltipla (ADM) e o segundo em Regressão Linear Múltipla (RLM). Os modelos baseados em ADM apresentaram resultados melhores do que os baseados em regressão linear. Os melhores resultados usando RLM foram obtidos para diversidade e riqueza. É possível então, concluir que modelos como aqui derivados podem representar ferramentas muito úteis em estudos de monitoramento ambiental em estuários.
REFERENCES
Allen, J. H. (1999a), The analysis and prediction of the shallow subtidal benthic communities along the East Coast of England. PhD Thesis, University of Hull,
England.
Allen, J. H. (1999b), Analysis and prediction of the subtidal benthic communities along the Durham coast. Thecnical Report, Institute of Estuarine and
Coastal Studies, Hull.
Bemvenuti, C. E. (1997), Benthic invertebrates. In: Seeliger, U.; Odebrecht, C. and Castello, J. P.. (eds.).
Subtropical convergence marine ecosystem. The coast and the sea in the warm temperate southwestern Atlantic. New York : Springer-Verlag. pp. 43-46.
Callow, P. (1992), Can ecosystems be healthy? Critical considerations of concepts. J. Aquat. Ecosys. Health, 1, 1-5.
Capitoli, R. R.; Bemvenuti, C. E. and Gianuca, N. M. (1978), Estudos de ecologia bentônica na região estuarial da Lagoa dos Patos. I. As comunidades bêntonicas. Atlântica, 3, 5-22.
Chessman, B. C. (1999), Predicting the macroinvertebrate faunas of rivers by multiple regression of biological and environmental differences. Fresh. Biol., 41, 747-757.
Chessman, B. C.; Growns, I.; Curreys, J. and Plunket-Cole, N. (1999), Predicting diatom communities at the genus level for the rapid biological assessment of rivers. Fresh. Biol., 41, 317-331.
Clarke, R. T.; Furse, M. T.; Wright, J. F . and Moss, D. (1996), Derivation of a biological quality index for river sites: comparison of the observed with the expected fauna. J. Appl. Stat., 23, 311-332.
Constable, A. J. (1999), Ecology of benthic-invertebrates in soft-sediment environments: a review of progress towards quantitative model of predictions.
Aust. J. Ecol., 24, 452-476.
Day Jr., J. W.; Hall, C. A. S.; Kemp, V. M.; Yãñez-Arancibia, A. (1989), Estuarine Ecology.
New York : John Wiley and Sons.
De Grave, S. (1999), The influence of sedimentary heterogeneity on within Maerl bed differences in infaunal crustacean community. Est. Coast. Shelf Sci., 49, 153-163.
Elliott, M. (1994), The analysis of macrobenthic community data. Mar. Pollut. Bul., 28, 64-64.
Elliott, M and O’Reilly, M. G. (1991), The variability and prediction of marine benthic community parameters. In: Elliott, M. and Ducrotoy, J. P. (eds.).
Estuaries and coasts: spatial and temporal intercomparisons. Fredelsbourg : Olsen and Olsen.
pp. 231-238.
Furse, M. T.; Moss, D.; Wright, J. F. and Armitage, P. D. (1984), The influence of seasonal and taxonomic factors on the ordination and classification of running-water sites in Great Britain and on the prediction of their macro-invertebrate communities.
Fresh. Biol., 14, 257-280.
Gerritsen, J. (1995), Additive biological indices for resource management. J. North Amer. Benth. Soc., 14, 451-457.
Gray, J. S. (1981), The ecology of marine sediments:
Holme, N. A. and McIntyre, A. D. (1984). Methods for the study of marine benthos. New York : Blackwell
Scientific Publications.
Jeffers, J. N. R. (1978), An introduction to systems analysis: with ecological applications. Baltimore :
Edward Arnold.
Jorgenson, S. E. (1986), Fundamentals of ecological modelling. Amsterdam : Elsevier.
Levinton, J. S. (1995), Marine biology: function, biodiversity, ecology. Oxford : Oxford University.
Little, C. (2000), The biology of soft shores and estuaries. Oxford : Oxford University Press.
Manino, A. and Montagna, P. A. (1997), Small-scale spatial variation of macrobenthic community structure. Estuaries, 20, 159-173.
McGarigal, K.; Cushman, S. and Stattford, S. (2000),
Multivariate statistics for wildlife and ecology research. New York : Springer-Verlag.
Moss, D.; Furse, M. T.; Wright, J. F. and Armitage, P. D. (1987), The prediction of the macroinvertebrate fauna of unpolluted running-water sites in Great Britain using environmental data. Fresh. Biol., 17,
41-52.
Moss, D.; Wright, J. F.; Furse, M. T. and Clarke, R. T. (1999), A comparison of alternative techniques for prediction of the fauna of running-water sites in Great Britain. Fresh. Biol., 41, 167-181.
Parson, M. and Norris, R. H. (1996), The effect of habitat-specific sampling on biological assessment of water quality using a predictive model. Fresh. Biol., 36, 419-434.
Rosa-Filho, J. S. (2001). Variações espaço-temporais das associações de macroinvertebrados bentônicos de fundos moles dos estuários do Rio Grande do Sul (Brasil): influênica de fatores naturais e introduzidos,
e modelos para sua predição. Tese (Doutorado), Fundação Universidade Federal do Rio Grande, Brasil.
Rosa-Filho, J. S. and Bemvenuti, C. E. (1998a), Utilização do método de comparação de curvas de abundância e biomassa (Método ABC) na identificação de ambientes submetidos a estresse am regiões estuarinas do Rio Grande do Sul (Brasil).
Paper pressented at 4. Simpósio de Ecossistemas
Brasileiros, 1-6 abril, Águas de Lindóia, SP.
Rosa-Filho, J. S. and Bemvenuti, C. E. (1998b), Caracterización de las comunidades macrobentónicas de fondos blandos en regiones estuarinas de Rio Grande do Sul (Brasil). Thalassas, 14, 45-56.
Schwarzbold, A. and Schäfer, A. (1984), Gênese das lagoas costeiras do Rio Grande do Sul - Brasil.
Amazoniana, 9, 87-104.
Snelglove, P. V. R. and Buttman, C. A. (1994), Animal-sediment relationship revisited: cause versus effect.
Oceanogr. Mar. Biol. Ann. Rev., 32, 111-177.
Underwood, A. J. (1990). Experiments in ecology and management: their logics, functions and interpretations. Australian Journal of Ecology, 15,
365-389.
Underwood, A. J. (1996), Detection, interpretation, prediction and management of environmental disturbances: some roles for experimental marine ecology. J. Exp. Mar. Biol. Ecol., 200, 1-27.
Welshmeyer, N. A. (1994), Flourometric analysis of chlorophyll a in the presence of chlorophyll b and
pheopigments. Limnol. Oceanogr., 39, 1985-1992.
Whitlach, R. B. (1981), Animal-sediment relationships in intertidal marine benthic habitats: some determinants of deposit-feeding species diversity. J. Exp. Mar. Biol. Ecol., 53, 31-45.
Wilson, J. G.; D. W. Jefrey. (1994), Benthic biological pollution indices in estuaries. In:. Kramer, K. J. M. (ed.). Biomonitoring of coastal waters and estuaries.
Boca Raton : CRC Press. pp. 311-327.
Wolff, W. J. (1983), Estuarine benthos. In: Ketchum, B. H. (ed.). Ecosystems of the world. Estuaries and enclosed seas. New York : Elsevier. pp. 121-132.
Wright, J. F.; Armitage, P. D.; Furse, M. T. and Moss , D. (1989), Prediction of invertebrates communities using stream measurements. Reg. Riv. Res. Man., 4, 147-155.