Development of a Profitability Report for a Luxury Fashion
Service Provider
Miguel Augusto Lourenço Spranger Master’s Dissertation
FEUP Supervisor: Prof. Nuno Domingues Soares
Mestrado Integrado em Engenharia Industrial e Gestão 2017-06-26
You can't cross the sea merely by standing and staring at the water. Rabindranath Tagore
Desenvolvimento de um Modelo de Rentabilidade para um Prestador
de Serviços na Área de Moda de Luxo
Resumo
O comércio digital é um dos tópicos mais falados nos negócios de luxo. Inicialmente, estes pautavam-se pela ausência de crescimento, levando a que a relação entre indústria de retalho e o comércio por via eletrónica fosse sendo considerada como quase inexistente. Assim que o retalho por via eletrónica começou a entrar em voga, as empresas que apostavam nessa via focavam-se em maximizar receitas e lucros o mais possível, despreocupando-se com a forma como a empresa se desenvolve noutros aspetos.
Após alcançar um fluxo operacional otimizado, a gestão de informação torna-se uma das principais preocupações das empresas. O crescimento e desenvolvimento até então feito pode ter escondido potenciais perdas que podem ser monitorizadas através sistema de controlo de informação definido e eficiente. Assim sendo, antes de tomar decisões estratégicas tendo em vista um certo objetivo, é crucial monitorar rendimentos e gastos, de forma a maximiza-las e a reduzi-las, respetivamente.
O principal objetivo deste projeto é compreender a rentabilidade da empresa. Inicialmente, foi essencial perceber a cadeia de valor, a partir de um estudo profundo sobre a estrutura e processos da empresa, as fontes de rendimentos e a alocação de custos.
Normalmente, os custos associados aos serviços são problemáticos e não são reconhecidos pelas empresas que disponibilizam serviços. A sobrecarga de serviços exigidos pelos demais clientes e as metodologias tradicionais de custeio não fornecem soluções eficazes baseadas nos resultados. Assim sendo, este projeto, como resposta aos métodos tradicionais de custeio, foi desenvolvido um modelo orientado para as atividades adaptado às restrições impostas pelos serviços, com o intuito de explicar os custos de uma forma mais balanceada.
Após identificarem-se as fontes de rendimento e gastos, é necessário realizar um estudo mais abrangente através da estruturação e implementação da demonstração de resultados da empresa. As demonstrações representam, de forma oficial, as atividades financeiras dos serviços oferecidos pela empresa, representando assim uma imagem da empresa, a nível de condições e resultados operacionais.
Consecutivamente, será realizada uma análise aprofundada do negócio em si, de forma a determinar a posição financeira, a viabilidade e a rendibilidade dos serviços. O passo seguinte será a criação de um relatório dinâmico que permita focar numa análise de rácios, com o intuito de perceber o historial dos mesmos ao longo dos anos. Posteriormente, a partir da demonstração de resultados e da monitorização realizada aos indicadores chave de desempenho, é possível perceber quais as áreas mais dispendiosas, dentro dos serviços oferecidos. Como tal, é realizada uma análise a um departamento fulcral na área dos serviços – Atendimento ao Cliente - com o objetivo de aumentar a eficiência deste departamento e consequentemente reduzir os custos. É realizada uma análise de otimização sobre o número de prestadores de serviço ao cliente através de um modelo desenvolvido.
Abstract
Digital commerce is among the hottest topics for luxury business. Initially characterized by an almost stagnant growth, the relationship between the retail industry and e-commerce became a slow-paced reality. As the e-tail world started to gain conviction, the service retail companies focused on growing and getting profits, without controlling the ceaseless information and amount of new data that came from the processes.
After establishing a significant operational workflow, the demand for managerial information becomes one of the main concerns of the companies. The growth and development of the company might be hiding potential losses that could be tracked through a defined and efficient information and control system. Therefore, before undertaking strategic steps towards a certain goal, it is crucial to track the revenues and costs and improve them.
This project’s main goal is to grasp the company’s profitability. Initially, it was essential to understand the value chain by providing a systematic exploration of the service company’s structure and processes, the roles of profits and explore the allocation of costs. As a clearer understanding of revenues and costs is essential today, so the process suggested must offer a well-thought route through these important aspects.
The costs associated with services are often problematic and unacknowledged. Service companies often have high overheads and traditional costing methodologies are not providing adequate solutions in an outcome-based environment. Therefore, the result was to design and propose an activity-based costing model adapted to services business, which can enhance practice and account for the costs in a balanced way.
After properly defining the revenues and costs, it was necessary to account for the bigger picture, through the structuring and implementation of the financial statement, more specifically, a Profit and Loss Statement. These statements will be a formal record of the financial activities of the service (activities that were identified beforehand) and will give an accurate picture of the company’s condition and operating results in a condensed form. This allows for a further analysis and interpretation of the business by assessing its profitability. Therefore, the next step will be creating dynamic reporting which will focus on ratio analysis, with the main purpose of showing whether the company is improving or deteriorating over time.
Finally, through both financial statement and constant reporting through key performance indicators it is possible to see which area of the service business is being costlier overall. This leads to a final analysis over one of the main departments on the service business – the Customer Service. Providing the best service for the clients is what ultimately maximizes revenue. So, to efficiently manage the costs of this department, an optimization analysis is implemented is conducted over the number of customer service agents through a developed model.
Acknowledgements
There are always people to thank when you have taken up an endeavour of this scale.
First of all, this would not exist if it were not for Farfetch. Therefore, I would like to thank Farfetch for giving me the opportunity to develop this project with the smoothest of integration and granting me the necessary conditions to guarantee the success of the project. In particular, I must express my gratitude to my supervisor Beatriz Conejo for her insights, remarks, encouragement and, most importantly, constantly transmitting the passion about the project. I have been extremely lucky to have a supervisor who cared so much about my work. My immense gratitude also goes to Tiago Carvalhinho for the constant engagement and patient guidance, for being a supportive pillar on the project and responding to my questions and queries so promptly throughout the project. A heartful thank you for teaching me all that I know about the business and making me what I am today. I would also like to thank Sofia Monteiro for the mutual help and for being relentless in her camaraderie and cheering whenever I needed on this final journey together. Also, a big thank you to the team I worked closely with, for integrating me in the company. Finally, I want to thank all the people at Farfetch that I had the opportunity to meet and also those that helped directly on the project. It was a great pleasure to work, learn and have fun with all of you.
There were many defining moments in the path which led me to the enrolment at the Masters until reaching the dissertation at FEUP. I would like to dedicate a memorable thank you to all my professors during the last years, for enriching me as a student and as a person. This appreciation immensely goes to my dissertation supervisor, Professor Nuno Domingues Soares, for the constant guidance since day one and reassurance given throughout the project. His orientation through great feedback and constant availability was of the utmost importance to me.
Completing this work would have been all the more difficult were it not for the support and friendship. A word of gratitude to all the friends who were always there for me when I needed and motivated me to seek to learn more every day and, most importantly, making me a better person. I also would like to thank all the people that crossed paths with me during this amazing part of on my life and somehow helped me to reach this day.
Last but not least, I deeply thank for having a great and supportive Family, my Father, Mother, Aunt, Uncle and Brother, who were always there to sacrifice themselves for me and pass me values that I will always carry throughout my life.
I want to give a special mention to teacher Margarida Anacleto for the careful feedback and support while doing this dissertation.
Although only my name appears on the cover of this paper, many people have contributed to its finalisation. I owe my deepest gratitude to everyone who made this work possible.
Contents
1 Introduction ... 1
1.1 Farfetch ... 1
1.1.1 Black & White ... 2
1.1.2 Black & White Operations ... 3
1.2 Project framework and motivation ... 4
1.3 Project Goals ... 5
1.4 Methodology ... 5
1.5 Dissertation’s structure ... 6
2 Literature review ... 7
2.1 E-commerce, Revenue Models and Metrics ... 7
2.2 Luxury: Embracing E-tailing ... 10
2.3 Financial Ratios and Cost Concepts ... 11
2.4 Service Costing Systems and Performance Measurement ... 13
3 Overview of Current Revenues and Costs ... 16
3.1 Business Overview ... 16
3.1.1 Order fulfilment process ... 16
3.2 Farfetch Profit & Loss Statement ... 18
3.2.1 Gross Profit ... 18
3.2.2 Profit After Marketing ... 20
3.2.3 Profit after Semi-Variable Overheads ... 20
3.3 Profitability Measurement ... 21
3.3.1 New Customers, Traffic and Orders ... 21
3.3.2 Average Order Value (AOV) ... 21
3.3.3 Net Transaction Value (NTV) ... 21
3.3.4 Delivered Contribution per Order (DCO) ... 22
3.3.5 Net Promoter Score (NPS) ... 22
3.3.6 Profit Levers ... 22
3.4 B&W Operational Revenue Model ... 23
3.4.1 Effective Commission and Fees ... 23
3.4.2 Discounts Co-Payments ... 24
3.4.3 Partner Shipping Contribution ... 24
3.4.4 Special Payments ... 25
3.5 B&W Operational Costs Structure ... 25
3.5.1 Transaction fees ... 25
3.5.2 Third Party Fraud Tool ... 26
3.5.3 Chargebacks ... 26 3.5.4 Communication costs... 27 3.5.5 Training Sessions ... 27 3.5.6 Software Licenses ... 28 3.5.7 Shipping ... 28 3.5.8 Duties... 29 3.5.9 Miscellaneous costs ... 29
4 Implemented Management Control ... 30
4.1 Data Collection ... 30
4.2 Costing System Approach ... 31
4.2.1 Operations structure ... 31
4.2.2 Costing model ... 32
4.2.4 Cost Assignment ... 33
4.3 Profit and Loss Statement ... 35
4.3.1 Brands Adapted Statement ... 38
4.4 Overall Reporting Model... 38
4.4.1 Business Overview Report ... 38
4.4.2 Profitability Report ... 41
4.5 Result benchmark ... 44
4.6 Customer Service Agents Optimization ... 44
4.6.1 CS Flow Design ... 44
4.6.2 Direct Labour Requirements ... 45
4.6.3 Potential Direct Labour Hours Available ... 47
4.6.4 Utilization Rate ... 47
5 Conclusions and Future Work ... 49
References ... 51
Appendix A: Farfetch Profit and Loss Statement ... 55
Appendix B: E-commerce Overview Statement ... 57
Appendix C: B&W Profit and Loss Statement ... 58
Nomenclature
ABC – Activity-Based Costing AWB – Air Way Bill
AOV – Average Order Value ATV – Actual Transacted Value B&W – Black & White Business Unit BOR – Business Overview Report BU – Business Unit
CP – Commission Percentage CR – Conversion Rate
CS – Customer Service
CTO – Customer Traffic Orders
DCO – Delivered Contribution per Order EC – Effective Commission
GBP – British Pounds
IT – Information Technology KPI – Key Performance Measure MTD – Month-To-Date
NP – Net Profit
NTV – Net Transacted Value Ops - Operations
P&L – Profit and Loss Statement PR – Profitability Report
TPFT - Third Party Fraud Tool VAT – Value-Added Tax YTD – Year-To-Date
List of Figures
Figure 1 - Black & White Department Organigram ... 3
Figure 2 - Black & White Dedicated Team and Farfetch Operations Support Team and its Departments ... 3
Figure 3 - Black & White Operations Work Stream Plan ... 4
Figure 4 - ABC design steps adapted from (Mowen and Hansen 2011) ... 15
Figure 5 - Order processing flow ... 16
Figure 6 - Order hierarchy ... 17
Figure 7 – B&W Operational Costs ... 25
Figure 8 - Approve payment workflow ... 26
Figure 9 - Split of Operations Teams ... 31
Figure 10 - Main brands activity centres and cost drivers’ layout ... 32
Figure 11 - BOR filter composition ... 39
Figure 12 - Business Overview analysis graphics ... 40
Figure 13 – Profitability Result analyses ... 42
Figure 14 – Revenue Overview analyses ... 43
Figure 15 – Cost Overview analyses ... 43
List of Tables
Table 1- Advantages and downsides to e-commerce, adapted from (Mirescu 2010,
Niranjanamurthy, Kavyashree et al. 2013) ... 8
Table 2 - B2C and B2B sales over time, adapted from (Schneider 2015) ... 8
Table 3 - Types of financial ratios, adapted from (Callahan, Stetz et al. 2007) ... 12
Table 4 - Cost classifications, adapted from (Garrison, Noreen et al. 2003) ... 13
Table 5 - Gross Profit drill-down calculation ... 19
Table 6 - Profit after Semi Variable Overheads structure ... 20
Table 7 – Effective commission and adjustments applied by Farfetch and B&W ... 23
Table 8 – CP per stock point ... 24
Table 9 – Commission percentage layout example ... 24
Table 10 - Payment fees layout ... 25
Table 11 - Outbound and Inbound prices ... 27
Table 12 – Type of costs available for each software ... 28
Table 13 - B&W teams' main activities ... 32
Table 14 - Cost assignment to activities (specific costs) ... 33
Table 15 - Miscellaneous allocation and cost drivers... 34
Table 16 - GMV to Net Sales drill-down ... 35
Table 17 - EFNS structure calculation ... 36
Table 18 - Selling expenses ... 37
Table 19 - Administrative expenses ... 37
Table 20 - CPO benchmark values ... 44
Table 21 - B&W phone lines structure ... 45
Table 22 – Tickets resolution and unsolved times ... 46
Table 23 – Potential Direct Labour Hours... 47
Table 24 – Initial iteration results ... 48
1 Introduction
The emergence of technology during the last years was so predominant that online commerce is now one of the hottest themes for luxury brands. However, initially, there was a perception that the introduction of internet sales would destroy the high-end image that consumers attach to luxury goods (Pruzhansky 2012). Currently, the luxury industry is forced to adapt to the e-tail trend. This change in paradigm was visible in 2015, when luxury and online commerce slowly bonded together to reach online sales worth 23€ billion, only half of its true potential (Walters 2016). Moreover, this growth is expected to reach up to €70 billion by 2025 (Catena, Durand-Servoingt, and Remy 2015). Nowadays, the current wave of e-commerce is concentrated on developing convenience, personalization and rich buying experiences for customers – which is something that can be witnessed in Farfetch and its new Business Unit (BU), Black & White.
Although the luxury industry is established in the digital market and growing, the ceaseless demand for managerial information becomes one of the main concerns of companies. This requirement is intensified whenever the company starts to grow rapidly, without having time to define an efficient information system. This dissertation, developed on Farfetch B&W Operations Team, will focus on building a Profit & Loss Statement for the whole Operations Division of Black & White. This is crucial to understand the Operations’ profitability and, more importantly, it allows to build a revenue model based on forthcoming brand clients and already existing ones. Another objective is to advise and point out opportunities to decrease the costs.
1.1 Farfetch
Farfetch is a global luxury fashion e-commerce platform that links consumers with a curated global network of boutiques and brands around the world. It was launched in 2008, with its headquarters in London, steadily expanding its offices internationally. Currently, its operations extend to up to 500 luxury boutiques, distributed all over 190 countries, through a single Internet storefront for a seamless logistical experience for fashion shoppers. This universal approach on offering a streamlined online shopping technology to empower e-commerce is unrivalled, granting boutiques access to an e-e-commerce marketplace. Farfetch focuses on developing a win-win partnership with boutiques and constructing a bridge of trust with its customers.
Farfetch’s outperforming business model, which is based on a commission per sale, has its advantages and also its complexities. First, it benefits from economies of scale when providing the services to a high number of boutiques. Second, Farfetch does not store inventory - the stock is kept at the boutiques where customers buy from and get it shipped directly. On the one hand, embracing this retail drop shipping fulfillment allowed this company to focus on a stress-free way to build a successful business, allowing it to scale easily in a flexible way and with low overhead expenses and consequently decreasing the
operating costs significantly. On the other hand, supplying from multiple boutiques brings many complexities. Controlling multiple products from various stock points and synchronizing all the information systems on a daily basis might not result in the most accurate information regarding stock quantities. Farfetch’s business model also relies heavily on customer appreciation, trying to do the most to generate value and deliver an amazing experience to customers.
Regarding the company’s structure, Farfetch is currently spread in eleven offices, namely Guimarães, Lisboa, London, Los Angeles, Hong Kong, Moscow, New York, Porto, Shanghai, São Paulo and Tokyo, with over 1000 workers. Each office has its structural differences. Regarding Porto’s office, it is currently divided into twelve main departments: Account Management, Business Development, Customer Service, Finance, Human Resources, Marketing, Merchandising, Operations, Office Operations, Partner Services, Production and Technology. The Operations department is where part of the Black & White BU is integrated, and is analyzed in the next section.
1.1.1 Black & White
Farfetch empowered its growth by using the acquired know-how in technology to potentialize the online fashion e-commerce – hence the creation of Black & White (B&W) BU. B&W, created in 2015, is a fully-fledged agency and white-label omnichannel solution for brands, exploiting Farfetch’s services and core systems to build websites and deploy them in a modular way, whatever infrastructures or services brands want to use.
B&W delivers omnichannel out-of-the-box solutions by taking advantage of the fact that Farfetch unwittingly specialized itself in international commerce. This specialization includes expertise in shipping and customs taxes and policies and pricing models. This gathered know-how and accumulated experience regarding e-commerce operations can be leveraged by B&W to create API-based modular solutions.
Although most of the integration is aided by Farfetch, B&W has its differences and potential benefits. Whereas Farfetch focuses on establishing connection with boutiques, B&W reaches out to brands from big fashion groups and designers. This mono-brand partnership leads to closer ties with indispensable groups from famous brands and enriches Farfetch resolving issues regarding supply and stock items. Furthermore, integrating the brands’ operations this way allows a simpler synchronization with Farfetch’s domain, since the platform used is the same. If the brand desires it, it can sell both its products in B&W and Farfetch in an instant. Therefore, Farfetch can secure more stock and, more importantly, secure partnership with brands that were not in their portal, giving them in return global exposure and huge amounts of traffic. It is also important to mention that this division business was called B&W because of its translucent solutions. B&W wants to commit itself with the brands in a clear and advantageous relationship for both sides - “it’s black and white”.
B&W has already launched about seven e-commerce websites until now. The current layout of this company has a dedicated team and Farfetch departments that support the project.
Figure 1 - Black & White Department Organigram
Concerning Figure 1, the Technology department oversees all the information technology resources that are needed – management of information systems, website development and user interface. It is also responsible for creating client-oriented tools, such as Content Management System, or even more general technology. The Commercial department, which is currently based in London, is responsible for covering all the commercial work, such as procurement. Moreover, the digital marketing is also included in this department. It’s also important to underline that the Managing Director is responsible for supervising all the departments mentioned, and is currently based in London as well. Finally, there is also the Operations department, the focus of this project, which is described thoroughly in the following segment.
1.1.2 Black & White Operations
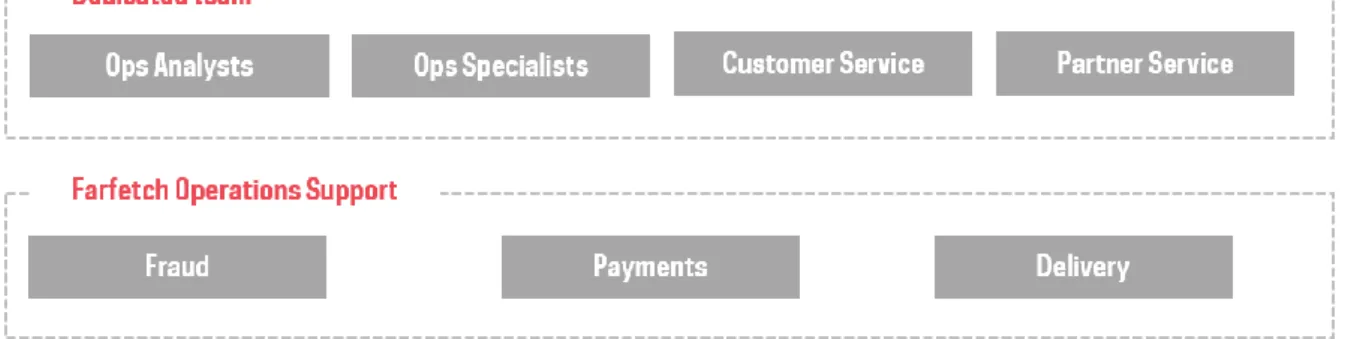
Starting from when the customer pays until the processing of the order and its shipping, the Operations’ offer covers a wide range of tasks when it comes to day-to-day activities. B&W Operations belongs to the integral team of Farfetch Operations department, and its structured as shown in Figure 2.
Figure 2 - Black & White Dedicated Team and Farfetch Operations Support Team and its Departments B&W Operations can be separated into two parts: (i) The Dedicated Team, which consists of people that only work for B&W business (100% allocated); (ii) The Farfetch Support Team, which can be seen as an ‘outsource’, since it is composed by people that currently work at departments within Farfetch, but also deal with B&W daily operations. The support team focuses mainly on customer operations (fraud check, payment verification, delivery support and development of better shipping solutions, supply setup and retail).
On the one hand, the Customer Service is a department that guarantees the customer support that is vital to an online business. On the other hand, impacting the customers’ experience
indirectly, it is vital to build and define expectations alongside brand partners, which is secured by the Partner Service. There are also the Operation Specialists who are responsible for setting up the brands configurations and manage projects to support them in the daily operations. Finally, as a more reporting role, there are the Business Analysts, who make data analysis, business intelligence and forecasts.
Altogether, this team has a defined work stream, defined into three main phases as shown on Figure 3.
Figure 3 - Black & White Operations Work Stream Plan
Initially, it is necessary to understand brands requirements to reach the right partnership agreement. After attending to such requests, a timeline is designed and is reached the final agreement, with a defined roadmap, which ends the Pre-Development phase. Moving onto the next phase, B&W Operations firstly focuses on aligning the service definition alongside the brand. Defining service hours and languages, payment methods available, shipping destinations and stock points to use and pricing items are many of the requirements needed. Meanwhile, B&W Technology builds and develops the website that the brand had structured. After helping the brand with all the operation set up and testing out the internal tools, website is launched. This is covered by a Post Launch support, improving the brands’ performance through reporting and consultancy. Moreover, the dedicated team and support team are the main actors in this stage. All the activities surrounding customer operations (managed by customer service, payments, fraud team and so on) play an important role supporting the brands’ service.
All in all, the Operations department works as both Farfetch and B&W to optimize resources and take advantage of what is already implemented correctly, all the while still improving or adapting what is already done. This represents a win-win relationship between both companies.
1.2 Project framework and motivation
This project was born out of the necessity of any newly born company. B&W begun with the objective to reach out to a specific market that Farfetch saw as an opportunity to explore. Given that this is a service provider, the most important focus was to partner up with the right luxury fashion brands. Along with these partnerships grew a lot of information to manage and data to store, as well as, most importantly, the inevitability of generating and controlling profits. Once the growth became solid enough, it was expected to have some way to control the company’s operations. Fundamentally, the main objective of this project is to create a full profitability reporting and analysis focused on the B&W Operations Department. As stated above, this project is developed in the Operations Department of B&W.
Due to the fresh nature of this company, this report had to be sketched and created from scratch. Nevertheless, it’s important to mention that Farfetch had already established itself
and designed its revenues and overall costs. Given the similarities between both company and BU, the layout of the operational information could be sent from Farfetch to B&W, in order to help meet the unique requirements that the BU focuses on. Moreover, the expertise and processes of Farfetch could be used to fill in any lack of experience that both B&W and its new partnered-up brands would have. The relevance of this report will help B&W not only in measuring its profits, but also study the brands performance. Moreover, it may also be extended and scalable to the other departments of the company, detailing other costs that may be important to consider.
1.3 Project Goals
According to what was delineated above, this project has the following goals:
1. Understand all the operations’ processes and structure and allocate revenues and costs; 2. Build a thoroughly automated full-size profitability reporting model
3. Study deviations from the target and deepen the analysis of some costs
The first goal serves as a starting point to understand the B&W organization and get deeper knowledge regarding the current operation, mapping out all the revenues and operational costs. It is necessary to understand where the variable and fixed costs come from and define the allocation parameters in the direct costs of the processes, by identifying the various cost drivers and activities throughout all the departments involved.
Secondly, building the Profit & Loss report is the focus here. It is very important to ensure that this report is constructed in the same way that the data was collected and classified. Moreover, it must have scalability to study each brand independently to come up with an internal rentability brand tool. This can be useful to study every brands’ necessities and define what is most crucial to study.
Lastly, once the deviations are identified, it is vital to conceptualize a deeper analysis on defining which actions will have to be taken to keep the costs on track or, better, decrease them. This is done by scrutinising each brands’ specific costs and identifying metrics that are important to measure in this business. The result must be an analysis over the metrics that can identify possible cost decrease.
Putting all the puzzle pieces together will allow to build a fully-fledged reporting system that is automatically updated and on schedule with the costs. Moreover, it will be flexible and scalable enough to outbring customised analysis for each brand.
1.4 Methodology
The present project was divided into three main steps: (i) structure all the revenues and costs involved, as well as allocation of costs; (ii) the development of an automated profitability report as a whole and; (iii) finally advice on possible deviations and opportunities to control and/or reduce costs.
Initially, it was essential to understand how the Operations Department was structured. Since a lot of departments were involved, there were a lot of processes to consider. After achieving the general mapping, there were two types of data to gather and understand: revenues and costs. Conceptualizing the sources of revenue and cost allocation was the step to be taken next. On the one hand, it is important to know how B&W generates revenue from the brands commission per sale. Depending on the specifications of each brand, the value obtained for this category can differ a lot. On the other hand, there will be an allocation of the costs to the
different departments of B&W. In other words, to different centre of costs. Altogether, this allowed the creation of the structure of the Profit & Loss Statement, making it flexible enough to have the measured profits and losses for all the periods. Last but not least, one of the most important objectives was also to, having the bigger perspective, calculate KPI measures in order to state possible deviations and, consequently, analyse them on possible workarounds to decrease the costs. The study will mostly focus on studying the impact of returns policies on profitability, understanding how different payment methods deliver cost and credit efficiency and, finally, calculating the efficient number of workforce agents in the customer service department.
1.5 Dissertation’s structure
The substance of this dissertation is briefly structured into further four different sections. To begin with, section 2 includes a literature review on the main subjects relevant for the project. This review starts by describing the relationship between luxury fashion and e-commerce. Moreover, this section will focus on detailing the financial development, focused on how to allocate costs and build the accounting models.
Section 3 will provide an overview of the current operations’ fulfilment process and organization. After that, there will also be an overview of what Farfetch is currently accounting on its P&L Statement. Furthermore, this Section also focuses on identifying all the revenue sources and costs of the B&W Operations.
Section 4 contains the implemented management control - expose the new accounting ABC system, followed by the P&L Statement structure and reporting, finally concluding with an analysis over the optimization of agents in the CS Department.
Finally, section 5 presents the main conclusions, outlining the important steps taken and the final model with cost analysis. Future work and further development is also presented.
2 Literature review
In this section, an overview of the most relevant and up-to-date literature on the subjects pertinent to the implementation of the project is provided. Firstly, it is given an introduction over the concept of e-commerce, followed by the development of revenue models and metrics. After that, the e-tailing business in the luxury fashion world is addressed. Next, a slightly more detailed description over cost concepts. Finally, the last section focuses on how service companies have embraced the costing systems and how it could relate to performance measurement.
2.1 E-commerce, Revenue Models and Metrics
Over the last decades, the essence of Electronic commerce was still emerging as a new way to do business. Initially, only a few companies had really established solid footholds online and were mainly focused on selling in physical stores and taking orders in calls (Schneider 2015). E-commerce started off as a development of Electronic Data Interchange (EDI) and Electronic Funds Transfer (EFT) technologies that allowed companies to exchange information, place orders and make electronics payments through computers. More specifically, according to Mohapatra (2013), this allowed businesses to share different documents, for example bill of materials, warehouse receipts, purchase orders or invoices electronically. This first-generation commercial transaction exchange begun revolutionizing itself over time. The next phase was characterized by using Internet as a commercial tool of goods and services (Tian and Stewart 2007). E-commerce, which was considered as an aid to the business, became a strategic tool for organizations due to the growth and predominance of the Internet. Later on, aided by the National Science Foundation (NSF) the commercial restrictions and regulations on the use of the network were lifted, allowing the e-commerce to grow (Tian and Stewart 2007). Consequently, new technologies were introduced over time, such as Automated Teller Machines, telephone banking, credit cards and the well-known Enterprise Resource Planning Systems (ERP) (Mohapatra 2013). It’s important to underline the fact that, together with the Internet’s growth, the change in consumers’ behaviour also contributed to the emergence of electronic commerce (Gray and Zappalà 2006)
The fast growth of electronic commerce was possible due to three main reasons (Du, Lederer, and Wu 2010): (i) easy and unceasing access to personal computers; (ii) the expansion of broadband connections and; (iii) the continuous development of the Internet. The term “electronic commerce” has been conceptualized in various ways. Generally, it is assumed that it means shopping on the World Wide Web (WWW). However, according to Schneider (2015), e-commerce includes many other activities, whether trading between different businesses or internal processes that are used to support buying, selling, hiring and so on. Supporting this versatility, according to Niranjanamurthy et al. (2013), e-commerce refers to anything that occurs online – including even small businesses that provide personal services such as nail salons. Additionally, e-commerce creates new paths to reach global customers. In
contrast, customers gain a wider product range overview and more control of the information (Clark, Johnston, and Shulver 2012). Complementing this, Mohapatra (2013, p. 8) states that “E-commerce is a short version of the term Electronic Commerce. It implies transactions related to online buying and selling of products or services. These transactions are done using electronic systems such as the Internet and other computer networks.” However, (Evans 2001) broadens the concept even more, by stating that it also enables and supports changes internally in bigger scales. This means that e-commerce can also improve internal operational practices in an online basis and make them more flexible and global. Consequently, this would enable the companies to work closely with their suppliers and, thus, becoming at the same time more responsive and provide a better Customer Service. To top it all off, E-commerce “can greatly raise productivity, improve the efficiency of economic operations, lower economic operating costs and make possible things that were impossible before” (Qin et al. 2014, p. 1). Knowing that embracing e-commerce in current business creates a competitive advantage (Evans 2001), it is also important to be aware of the advantages and disadvantages of e-commerce – which are shown in Table 1.
Table 1- Advantages and downsides to e-commerce, adapted from (Niranjanamurthy et al. 2013, Mirescu 2010)
Advantages Disadvantages
Reduces time devoted to various activities, and eases accessibility to stores anywhere, from either the store perspective or customers’.
The cost of investment can be higher than what some geographical zones or areas of activity can achieve in terms of customers Ousting of intermediaries from the
economic activities Security issues connected to transactional fraud processes Instant purchase of digital goods and 24/7
store availability
Inability to test out the product beforehand Dissolution of geographical barriers –
possibility of international trading
Fragile control over customer expectations – from the moment the order is placed until it is received by the customer
Possibility of selling low volume goods Website downtimes that can harm the business and carry substantial losses
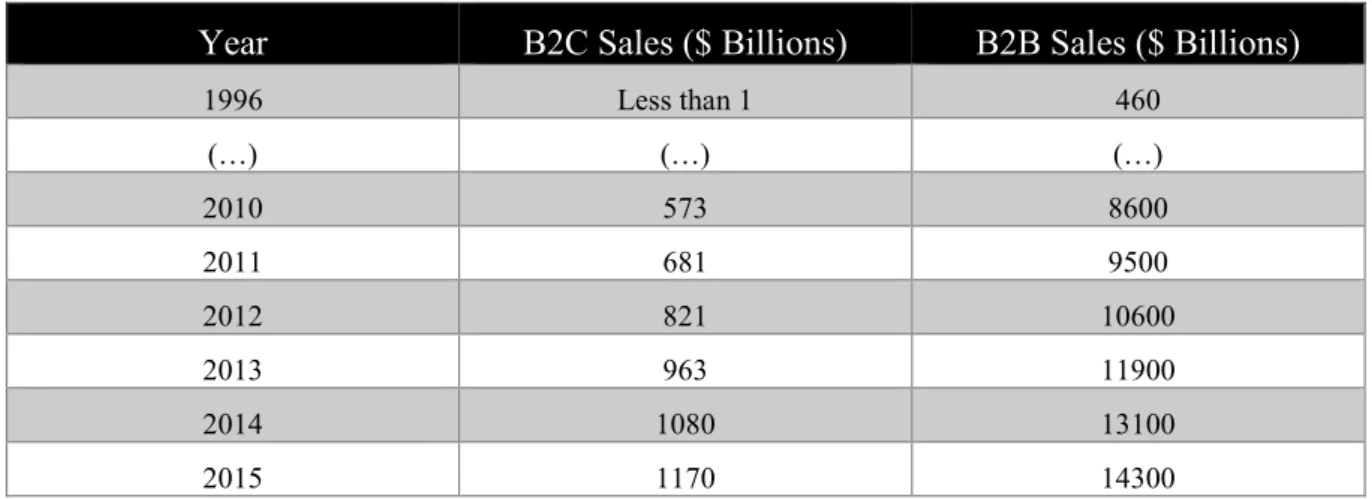
It is also possible to grasp the growth of e-commerce by analysing its transactions. Either for Business-to-Business (B2B), or Business-to-Customer (B2C), the growth of actual and estimated global online sales is growing, according to Schneider (2015). Table 2 summarizes those values.
Table 2 - B2C and B2B sales over time, adapted from (Schneider 2015)
Year B2C Sales ($ Billions) B2B Sales ($ Billions)
1996 Less than 1 460 (…) (…) (…) 2010 573 8600 2011 681 9500 2012 821 10600 2013 963 11900 2014 1080 13100 2015 1170 14300
Since one of the most important things in business is its profitability, it is also important to have an overview on how companies earn their revenue in e-commerce. Selling on the web might be different from selling physically, but companies are still exposed to strategies that are used to generate revenue - the so-called Revenue Models. According to Schneider (2015), there are various models that focus on generating revenue:
Web Catalog model– The seller establishes a brand image, later using that as a trademark to sell through printed information mailed to customers, who place the orders mainly through the web site;
Digital Content model – Companies that sell written information or rights to access the information they own. In other words, firms sell subscriptions to clients that either give access to all information or just a specific part (or it can be a combination of both approaches);
Advertising-Supported model – Firms that use online advertising messages (ad sites) as the sole revenue source to support the operations. This can also apply to other types of business, such as broadcasting.
Advertising-Subscription Mixed model – Levers the amount of advertising on websites depending on how much fee the subscribers pay.
Fee-for-Service model – Companies charge a fee for the various services available on the internet. The fee will be based on the value of the service provided. In this specific case, it can also be a fee for every sale made, when it comes to outsourcing companies. Schneider (2015) also states that some of the initiatives on e-commerce are undertaken to focus on reducing costs. Most companies tend to dedicate themselves to finding ways to cut costs and operate more efficiently. The potential earnings impact of cost reductions will depend on how the company wants to define its flexibility as a business. Intrinsically related to this is the need for most firms to outsource their processes, which is a strategy that is mentioned in this section further ahead. The costs can be various, for example purchasing activities – which are all the activities that include operational subjects, such as selecting specific products, placing orders and customer service. Moreover, it can also include costs related to logistics activities (receiving warehousing, inventory control, transport allocation, and so on) and business process support activities, which are composed by processes done by administration, human resources and technology development categories.
Taking all of this into account, although it is important to gather and define what are the revenues and costs, it is also imperative to know how to measure the values obtained. E-commerce metrics yield information regarding key attributes in E-E-commerce initiatives. They are important because they provide comparability and a rigorous research procedure when taking into account the values (Straub 2002). Zhu and Kraemer (2002, p. 281) states that “Good metrics earn credence and subsequently relieve researchers from repeated efforts at construct and instrumentation development. Metrics enable research to accumulate in a subject area as direct comparisons become possible between persons, time periods, industries, cultures, or geographic regions”. Some of the most used metrics in e-commerce to achieve the desired results are:
Conversion Rate (CR) – The percentage of the website’s visitors who make a purchase. It’s calculated as the total number of website visitors who make a purchase divided by the total number of visitors);
Average Order Value (AOV) – Average amount a customer spends when they order through the website. Summing the value of all orders divided by the number of orders is the formula for this metric;
Customer Lifetime Value (CLTV) – The value of an average customer during their entire relationship with the company. This is calculated by projecting the profit
expected to receive from a certain customer over time and take the net present value of those projected cash flows.
Gross Merchandising Value (GMV) – Total value of merchandise sold over a given period through the website. It is obtained prior to the deduction of any fees or expenses.
All in all, although the e-commerce has expanded and contracted over the years, it is now a pillar of hope for most companies. It was possible to witness the evolution of e-commerce from a novelty to its current place as an important component of a global business activity (Schneider 2015).
2.2 Luxury: Embracing E-tailing
Despite fashion being one of the world’s most important industries to drive a significant part of the global economy (Amed et al. 2017), luxury itself has burgeoned over time. Because of its uniqueness, it represents a specific niche that is characterized neither as a product, nor as a service, not even as a concept, but as “an identity, a philosophy and a culture” (Okonkwo 2009, pg. 302). On the other hand, luxury can also be a term traditionally connected with wealth, power, premium quality and exclusivity (Brun et al. 2008). This concept adapted itself over time, recreating the social stratification in a democratic way to whom was rich enough to achieve it (Kapferer and Bastien 2009). In a way, luxury products were an expression of the indirect social stratification (Okonkwo 2007) and were consumed for their psychological values instead of their practical utility (Doss and Robinson 2013).
Whereas luxury initially pronounced its function in segregating and stratifying the social classes, nowadays it takes a subtler role creating social status. Consequently, luxury transformed itself into an imposition of social stature displayed by the change of wealth into a “culturally sophisticated product” (Kapferer and Bastien 2009). This paradigm reversion results in the combination of various factors sought by customers, such as quality, aesthetics, scarcity, uniqueness, premium price all combined with functionality (Hines and Bruce 2007). Moreover, Abtan et al. (2014) also states that factors such as craftmanship, sustainability, brand reputation and emotional connection are empowering the experience of luxury over simple ownership as a growing trend.
The customer should be able to perceive enough value in the product worth the premium value that is paid (Tynan, McKechnie, and Chhuon 2010) and recognize it as fashionable and stylish (Ko and Megehee 2012). This leads to an increase of competition. As customers find it more important to crave the experience of the brand and not the products themselves (Epsilon 2014), the appearance of brands in such a short time leads to an even higher struggle to maintain the original image and identity while controlling the business globalization (Choo et al. 2012). The luxury shoppers are more knowledgeable about brands, more sophisticated and, thus, more demanding (Abtan et al. 2014, Brun et al. 2008). After the economic depression at the end of the twentieth century, luxury brands were forced to expand on the online world, because, whilst physical stores sales were decreasing, e-commerce attained an unceasingly double digit growth (Okonkwo 2009). Consequently, the technology has changed the shopper’s behaviour and the way business is made in the luxury fashion management (Okonkwo 2007), launching the evolution of the e-tailing concept.
E-commerce and luxury fashion retail are not fully complementary. E-commerce, stated by Okonkwo (2009), is a very unique and particular distribution channel since it lacks any physical and technological boundaries, consequently offering the consumers information about brands and product without any time or space restraints (Kourdoughli and Larraufie 2014). Luxury brands feared that, by joining up with e-tail concept, their identity and brand
image would dissolve over time. The upsurge panoply of product offerings and accessibility and the struggle in reproducing the high-end luxury feel were reasons that Okonkwo (2009) mentioned to explain the resistance embracing commerce. Contrary to these fears, e-commerce allowed for a vaster range of goods in smaller quantities to be available online – this is known as a long tail strategy (Clemons and Nunes 2011). E-tail is able to take advantage of the long tail market because it benefits from low communication costs and no geographical limitations (Bin and Qiang 2007). This allows customers to get their perfect fit according to their unique characteristics and tackle competition in the mass market. According to Okonkwo (2009), accessibility and convenience are now highly regarded among the luxury customers’ expectations. More importantly, online customers want a pleasant, interactive and engaging website experience that still emanates the prestigious integrity, exclusivity and trustworthiness atmosphere of a brand (Bjørn-Andersen and Hansen 2011, Lee 2012), as the customer still wants to feel like their choices are driven by their human senses (smell, touch and vision) and not their rationality (Okonkwo 2009).
The aftermath of this evolution gave birth to E-tailing – Electronic Retailing – which is the selling of retail goods over the internet, and a B2C transaction. The multichannel resolution for e-tailing is important, as research suggests that omnichannel customers tend to spend twice as much (Abtan et al. 2014). In order to leverage the costs of initial investments, the fashion companies can practice e-commerce outsourcing and, indirectly, gain access to superior expertise and strategic flexibility, increasing the project success rate at the same time (Hasty and Pentina 2009, Sun, Li, and Zhao 2015). Through outsourcing, the paths that are unveiled for the companies can vary, including outsourcing e-commerce related activities, totally or partially (Okonkwo 2007, Sun, Li, and Zhao 2015). Given the exceedingly dynamic environment of E-tailing, strategic outsourcing can be the most beneficial approach when the company has just started (Hasty and Pentina 2009).
Overall, the role of luxury in the world, the growth of the luxury market, its penetration in the online market and the reversion of the customer paradigm, it is without a doubt that the interest in social and interactive digital technologies has been increasing (Bjørn-Andersen and Hansen 2011). Being able to pinpoint the right channel for marketing, understanding purchasing motivations of luxury shoppers, and addressing the differences in benefits between shopping physically and online will be the key focus for the success of luxury brands (Deloitte 2015).
2.3 Financial Ratios and Cost Concepts
Management accounting is recognised as a tool to assist people in decision-making, to formulate plans and operate controls (Hussain and Gunasekaran 2001). Strategy, finance and project management are intrinsically related – by mapping out the various phases of the project, the financial analysis can pinpoint important highlights. The firm’s strategy must be oriented by mission and milestones, but the strategy must be driven by finances (Garrison, Noreen, and Brewer 2003). These financial analyses are carried out with the use of tools, which can vary depending on which is the better fit from both strategic and financial point of view (Callahan, Stetz, and Brooks 2007). Some examples of these tools are the balance sheets, income and expense statements, and financial analysis of which the DuPont method is an example. The main focus of this method is to see how financial operations drive value (Callahan, Stetz, and Brooks 2007, Garrison, Noreen, and Brewer 2003), and some people refer to it as value drivers model, whereas others as financial levers model. Although the differences between them is arguably an issue of semantics, they both provide the necessary financial information to apply into a project. This information, however, can be used differently according to the target assumed (Garrison, Noreen, and Brewer 2003), namely for a cross-company ratio analysis (comparing two similar businesses), cross-industry ratio
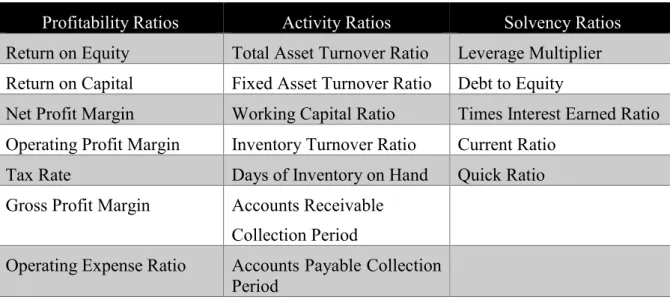
analysis (comparing company to industry alike) and cross-trend ratio analysis (financial ratio analysis). Callahan, Stetz, and Brooks (2007) warn that it is indispensable to be aware of the changes in the accounting depending on the period chosen - the financial statement of a certain period might not match another statement’s method. Consequently, they should be reported differently so that the trend analysis doesn’t suffer distortion. Furthermore, the ratios used can be grouped according to the type of information that they deliver. They can be profitability, activity and solvency ratios, as seen in Table 3.
Table 3 - Types of financial ratios, adapted from (Callahan, Stetz, and Brooks 2007)
Profitability Ratios Activity Ratios Solvency Ratios
Return on Equity Total Asset Turnover Ratio Leverage Multiplier Return on Capital Fixed Asset Turnover Ratio Debt to Equity
Net Profit Margin Working Capital Ratio Times Interest Earned Ratio Operating Profit Margin Inventory Turnover Ratio Current Ratio
Tax Rate Days of Inventory on Hand Quick Ratio Gross Profit Margin Accounts Receivable
Collection Period
Operating Expense Ratio Accounts Payable Collection Period
Garrison, Noreen, and Brewer (2003) state that profitability ratios calculate the amount of money earned by the business. This profitability analysis is spread in many ratios, and they can usually help determine the origin of the problem. For example, Return on Equity (RoE) shows the amount of income represented by percentage of the owner investment in a year. The next category, known as activity ratios, are the ones responsible to measure the amount of assets (monetary equivalent value) needed to support operations (Zeller 1990). Assets can either be fixed (plant structure, equipment, etc.) or variable (inventory and so on). Total asset turnover ratio (TATR) is an activity ratio that indicates the frequency of sales or revenues cycle deployment, depending on the assets. Finally, there are ratios that are used to determine how leveraged and/or solvent the business is (Callahan, Stetz, and Brooks 2007). The leverage multiplier ratio (LM) is calculated by dividing averages of total assets and total equity. The DuPont financial analysis allows us to take a closer look at the firm’s finances and determine the current situation, as well as analyse how things can be controlled to improve the financial picture (Soliman 2008).
When it comes to cost analysis, it is necessary to cross-check information given by the previous analysis and check which costs should and should not be considered. Callahan, Stetz, and Brooks (2007) state that cost is concerned with analysing its source and its behaviour, its effect on finance and the process considered to achieve an optimal management of it. Essentially, cost is the quantification of resources, expressed in monetary values, that must be consumed to obtain an object or complete an activity (Callahan, Stetz, and Brooks 2007). Whereas product costs provide information needed to create external financial statements, cost behaviour aids a company look into the future by seeing how costs may change based on changing variables (Wielman 2009). In order to grasp the full meaning behind the costs, it is vital to understand how they can be classified and its importance to the project management.
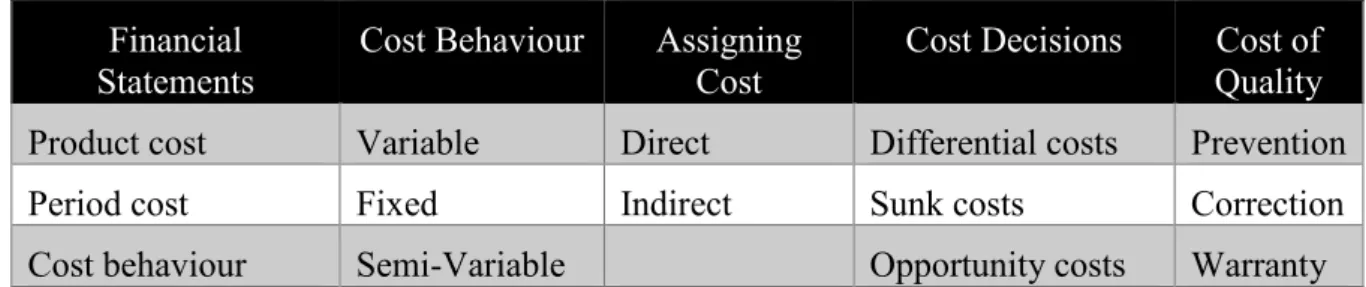
Table 4 - Cost classifications, adapted from (Garrison, Noreen, and Brewer 2003)
Financial Statements
Cost Behaviour Assigning Cost
Cost Decisions Cost of Quality
Product cost Variable Direct Differential costs Prevention Period cost Fixed Indirect Sunk costs Correction Cost behaviour Semi-Variable Opportunity costs Warranty As shown in Table 4, financial statements are fed by the information that comes from product and period costs. Cost behaviour studies the prediction of future costs when creating budgets or planning future activities. The behavioural costs can be considered fixed (structural) – those that are not dependent on the activity of the company in the short term, as they aren’t affected by the volume change in production (Bornia 2010). Furthermore, there are variable which are a function of sales, production or service volumes, such as raw material, packaging and commission sales (Durán 2004). The assigning costs are classified depending on how related they are to certain activities or cost objects. According to Viceconti and Neves (2010), the direct costs are those that can be allocated directly to fabricated products, since there is an objective measure associated to its fabrication. In contrast, the indirect costs need to be defined with the help of driver cost parameter (Bornia 2010) and are not directly linked to an object or activity (Callahan, Stetz, and Brooks 2007). Regarding cost decisions, just as the name suggests, they are used to discern between opportunities or goals and objectives established. Lastly, quality costs focus on preventing mistakes and solving problems.
The way businesses are conducted influence how the classification of costs can be interpreted. On the one hand, if it is a service industry, all the expenses are categorized as direct client expenses and are considered period costs during the period they were incurred. On the other hand, for the retail industry, it is introduced a new element, called cost of goods sold. This variable indicates the cost of what is being sold, beyond the direct client costs that were mentioned in the service industry (Callahan, Stetz, and Brooks 2007).
2.4 Service Costing Systems and Performance Measurement
With rising prices and increased competition, service companies are finding that knowing the costs of their products and services is vital to their health, if not to their existence. However, many of these companies have found their cost accounting systems less than satisfactory (Dearden 1977). Cost accounting has its origin in the manufacturing industry, hence most approaches or terminologies refer to it and not specifically to services (Baum 2013). Cost accounting is part of internal management accounting and designed for providing information to managers to assist them in making decisions (Lanen et al. 2010). Documentation, information, planning and control, and conflict resolution and decision making are the functionalities presented by the cost accounting (Mowen and Hansen 2011). Furthermore, the costing systems are usually divided into three categories, namely cost element accounting, cost centre accounting and cost object accounting. The cost accounting should always measure the cost of products or services (Baum 2013). According to Lanen et al. (2010), the accounting reporting must assign its costs and income not only to cost centres but also to responsible people within the organization. Additionally, according to Lanen et al. (2010), when it comes to cost centres, most companies try to manage and limit them through the delineated budget, which shouldn’t be exceeded. Unused budget will not be reported as savings, rather, it will be spent as the cost centre for the responsible person to achieve a lower budget, in case they request a higher or same budget next year (Baum 2013). This will lead to a suboptimal behaviour in terms of costs consciousness, and the evaluation of performance measurement of the cost centres of the responsible person will be affected. Contrarywise,
people accountable for revenue centres have no responsibility for costs, just for bad pricing policies or too much spending according to the companies’ profitability (Mowen and Hansen 2011). Lanen et al. (2010) states that, due to this nature, the cost consciousness behaviour will be higher, as it adds financial value to companies’ overall performance. However, it is not advised to measure the performance uniquely through financial KPI’s, but also quality and alignment of other objectives (Lanen et al. 2010). With both centres weighting, the investment centre dedicates itself to deciding the right investments and, therefore, calculate and plan in terms of return on investment (RoI) and economic value added (EVA) calculations before the investment is made (Baum 2013). However, this allocation in cost centres depend strongly on the gathered data. The blind usage of data, or misplaced data, can lead to incorrect decisions in the future. The quality of data can lead to one of the main limitations of cost accounting – the lack of publicity of the cost accounting versus financial statements leads to a lack of understanding for recording the need quality (Kubr 2002). Overtime, there have been developed many costing systems.
The traditional management accounting systems (TMAS) were developed for goods because services have traditionally only been seen (at that time) as a small part of a bigger problem solution offered to consumers (Hussain and Gunasekaran 2001). Nowadays, researchers consider that services can be as important as goods, sometimes being difficult to distinguish differences between them (Hussain and Gunasekaran 2001). Therefore, as stated by Whitt and Whitt (1988), service firms need management accounting systems for two main reasons: i) increased competition demands improved planning and control; ii) professional service firms have grown in size and organization complexity and, consequently, need systems comparable to those used by manufacturers. Hence, these systems must be applicable to service firms. Management accounting is starting to reject standard cost systems, traditional variance analysis and use of financial accounting for internal decision making – instead, non-financial measures are supplementing these systems on how to evaluate performance (Hussain and Gunasekaran 2001). According to Hussain and Gunasekaran (2001), businesses that understand and can quantify costs are in the best position to handle them – the prime objective is to minimize them, rather than minimize service through value-added activities.
In order to keep up with the current pace of technological and economic innovation, the most important goals that a financial accounting should focus on, mentioned by Gardner and Lammers (1988), are the product development and pricing, achieving cost reductions, evaluate performance and finally compare industry costs. However, as mentioned before, the swift advancement of information technologies and the ever growing competition helped make conventional management accounting systems irrelevant (Hussain and Gunasekaran 2001). Moreover, Gering (1999) states that traditional accounting has a tendency to provide information that is accurate but often late, irrelevant or misleading. Consequently, TMAS were initially created with the focus of serving the accountancy function, ignoring the needs when it came to decision-making moments. According to Bornia (2010), the principles of costing methods are intrinsically connected to the objectives of cost accountability and management, namely stock evaluation, aid to control and, as mentioned before, aid in decision-making. Companies tend to maintain a cost calculation system mainly because of two main needs: (i) in a fiscal point of view, where cost accounting integrates bookkeeping procedures required by law; (ii) in a managerial perspective, where allocation features all types of costs in order to improve and provide support for management information (Júnior, Oliveira, and Costa 1999). The determination of costs of goods and departments, control of production costs, elimination of waste (process improvement) and optimization of costs are also some of the objectives that Júnior, Oliveira, and Costa (1999) cite as imperative to determine costs.
After detecting all the essential costs and understanding what they are, it is necessary to recognise how they can affect the organization in all its structure. For that, the next section
will focus on developing an analysis over the Activity based costing model, discussing its strengths and weaknesses.
Activity based costing model (ABC)
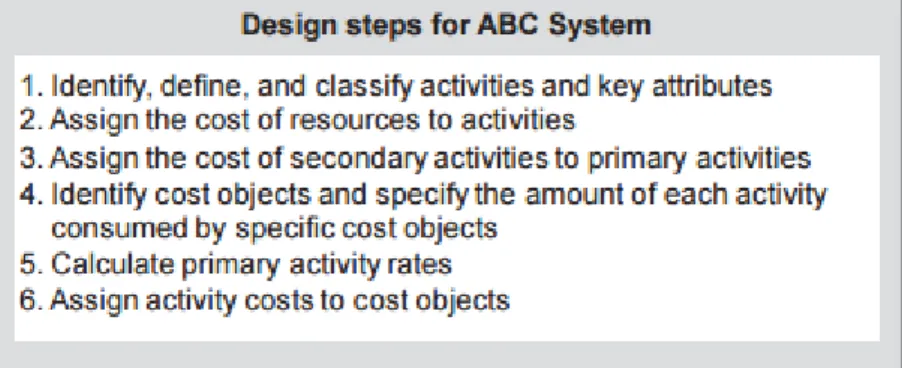
Popularised by Cooper and Kaplan (1992), the ABC model can be described as a methodology enabling and managing the financial information in the firm’s value chain to be used for active decision making. The ABC costing system is usually required whenever there are changes in strategy, information management or if the current cost accounting is not sufficient (Baum 2013). The overall objective is to reduce costs and improve customer value (Mowen and Hansen 2011). ABC is a technique for assigning the direct and indirect costs of an organization to the activities consuming the organization’s resources and subsequently tracing the costs of performing these activities to the products, customers, or distribution channels consuming the activities (LaLonde and Pohlen 1996). This assignment is done with the cost drivers. A cost driver is an activity or predictor (activity measurer) which, due to a cause-and-effect relationship, drives costs (Mowen and Hansen 2011) These driver costs need to be identified for each unit-based individual business. Moreover, the activities also need to be classified into primary and secondary activities – primary are those which are assigned as final cost objects, whereas secondary are assigned as intermediate cost objects (Mowen and Hansen 2011). The strength of this model reveals itself for companies with a large portfolio and high product complexity. It reengineers efforts (continuous improvement), as the system provides information about the relationship between activities and cost drivers (Baum 2013). ABC emphasizes tracing over allocation (Mowen and Hansen 2011). This system makes it possible to identify factors that cause an activity, assets or identify the activity and evaluate the performance and results achieved (Mowen and Hansen 2011). However, the implementation of an ABC system is a very time consuming and cost-intensive, and organisational barriers in terms of territorial, hierarchical or corporate culture can often block it (Babad and Balachandran 1993) According to Kaplan and Anderson (2007), “ABC systems (are) expensive to build, complex to sustain, and difficult to modify”. Additionally, in terms of information technology, a professional ERP system must be available (Mowen and Hansen 2011).
Figure 4 - ABC design steps adapted from (Mowen and Hansen 2011)
With the growing interest over this area, the allocation of costs in service companies is developing more accurate approaches overtime. The aim here is, depending on the various accounting methods, obtain an approach that is adapted to the own necessities of the company and reveals cost transparency for a management firm.
3 Overview of Current Revenues and Costs
3.1 Business OverviewThe first phase of this project starts by analysing the functional areas of the company, in order to identify sources of revenue and allocate costs in the current processes and activities (cost pools). Although B&W represents a new-fangled service, the operational flows of both Farfetch and this BU are tangled together. Moreover, Farfetch already prepares profitability reports when conducting its day-to-day business. This creates an advantage for B&W as it can use it to its favour, because most common operational concerns were previously identified. However, there are still some details that are unique for B&W processes that must be taken into account.
Before the identification process, it is important to have a brief overview on how the fulfilment in this company works. This will help understand how Farfetch and B&W departments work altogether for the operational workflow, and also exploit concerns or lack of information that is still not being accounted for. To maintain a degree of confidentiality, the company data presented in section is not actual. However, they do fairly represent the true amounts.
3.1.1 Order fulfilment process
The ordering process starts with the placement of an order through the website. Ordering entails clients’ choice of one or more items to buy, selecting the desired delivery option among those available to their shipping location and, lastly, the confirmation of the payment method. If these steps are accomplished successfully, a portal order will be inserted automatically in the database, starting the pipeline. The order processing flow can be seen in Figure 5.
The portal order is then split into many boutique orders, according to the boutiques where the items were purchased from (Figure 6). The internal management system, which was created by Farfetch, registers the orders’ information whenever it is placed. This system allows internal users and boutiques to inspect what orders need to be processed and which step of the processing they are in.
Figure 6 - Order hierarchy
Regarding the order flow in Figure 5, the steps mentioned can be further described below. Step 1 – Check Stock
The boutique is responsible for this step. From when the order is placed until the boutique confirms that there is stock available, the order remains intact in step 1. This step aims to verify if the item is available physically. Since an in-store sale can occur at the same time as an online one, a synchronised inventory is necessary. If there is no stock available at the time, and if the service is available for the brand, then the order is cancelled and the client is refunded.
Step 2 – Approve payment
This step occurs in parallel with the first one, since this is an internal responsibility. Farfetch processes the payment request. This processing can be treated differently depending on the customer’s transaction history - it can be either approved or refused. In case the order is dubious, the Fraud team will be responsible to verify if it’s authentic and look for anomalies. The order is cancelled if there are suspicions of fraud.
Step 3 – Decide Packaging
After the approval of step one (stock checked) and step two (payment approved) the boutique is now responsible for choosing the adequate packaging for the selected items’ size and shape. Moreover, it is also responsible for printing the documentation needed to go along the parcel. The parcel can also include additional personalized details, such as gifts, to maximize the customer experience.
Step 4 – Create Shipping Label
The creation of Air Way Bills (AWB) is usually done automatically. Nevertheless, in some cases, the Delivery Support team might need to intervene and correct the misspellings zip codes entered by the customer. Plus, an order can be stopped at this step by customer request or legislation restrictions (such as reaching the maximum daily import value).