Printed version ISSN 0001-3765 / Online version ISSN 1678-2690 http://dx.doi.org/10.1590/0001-3765201620150057
www.scielo.br/aabc
Green method by diffuse re
fl
ectance infrared spectroscopy and spectral region selection for
the quanti
fi
cation of sulphamethoxazole and trimethoprim in pharmaceutical formulations
FABIANA E.B. DA SILVA1
, ÉRICO M.M. FLORES2,4
, GRACIELE PARISOTTO2
, EDSON I. MÜLLER2
and MARCO F. FERRÃO3,4
1
Departamento de Farmácia, Universidade Federal do Pampa, Campus Uruguaiana, Br 472, Km 07, Prédio 700, 97500-970 Uruguaiana, RS, Brasil
2
Departamento de Química, Universidade Federal de Santa Maria, Campus Camobi, Avenida Roraima 1000, Cidade Universitária, Bairro Camobi, Prédio 18, Sala 2107, 97105-900 Santa Maria, RS, Brasil
3
Departamento de Química Inorgânica, Universidade Federal do Rio Grande do Sul, Av. Bento Gonçalves, 9500, 91501-970 Porto Alegre, RS, Brasil
4
Instituto Nacional de Ciência e Tecnologia de Bioanalítica/INCT-Bioanalítica, Cidade Universitária Zeferino Vaz, s/n, Bairro Barão Geraldo, Caixa Postal 6154, 13083-970 Campinas, SP, Brasil
Manuscript received on January 27, 2015; accepted for publication on March 9, 2015
ABSTRACT
An alternative method for the quantifi cation of sulphametoxazole (SMZ) and trimethoprim (TMP) using diffuse refl ectance infrared Fourier-transform spectroscopy (DRIFTS) and partial least square regression (PLS) was developed. Interval Partial Least Square (iPLS) and Synergy Partial Least Square (siPLS) were applied to select a spectral range that provided the lowest prediction error in comparison to the full-spectrum model. Fifteen commercial tablet formulations and forty-nine synthetic samples were used. The ranges of concentration considered were 400 to 900 mg g-1
SMZ and 80 to 240 mg g-1
TMP. Spectral data were recorded between 600 and 4000 cm-1
with a 4 cm-1
resolution by Diffuse Refl ectance Infrared Fourier Transform Spectroscopy (DRIFTS). The proposed procedure was compared to high performance liquid chromatography (HPLC). The results obtained from the root mean square error of prediction (RMSEP), during the validation of the models for samples of sulphamethoxazole (SMZ) and trimethoprim (TMP) using siPLS, demonstrate that this approach is a valid technique for use in quantitative analysis of pharmaceutical formulations. The selected interval algorithm allowed building regression models with minor errors when compared to the full spectrum PLS model. A RMSEP of 13.03 mg g-1
for SMZ and 4.88 mg g-1
for TMP was obtained after the selection the best spectral regions by siPLS.
Key words: chemometrics, diffuse reflectance infrared Fourier transform spectroscopy, green analytical method, high performance liquid chromatography, interval partial least squares (iPLS), synergy partial least squares (siPLS).
Correspondence to: Marco Flôres Ferrão E-mail: marco.ferrao@ufrgs.br
INTRODUCTION
Quantitative analysis of pharmaceutical samples by spectroscopy is typically accomplished by uni-variate regression methods. Infrared (IR)
performance of quantitative IR work. Thus, modern infrared spectroscopy has gained acceptance as a reliable tool for quantitative analysis (Settle 1997). Different accessories with diffuse or attenuated reflectance operating in mid-infrared and refl ectance or transmittance mode operating in near infrared enabled the analysis of samples in many different forms such as solutions, powders and intact tablets (Kipouros et al. 2006, Armenta et al. 2005, Boyer et al. 2006, Silva et al. 2009, 2012, Ferreira et al. 2013). In some instances, previous sample treatment is unnecessary and the results are obtained in real time (Lin et al. 2006). Quantitative analysis involving infrared spectroscopy has been applied to pharmaceutical samples in association with multivariate methods (Bunaciu et al. 2010). Partial Least Square (PLS) regression is the most popular multivariate calibration technique to build prediction models using spectroscopic signals (Lavine and Workman 2010). This association is very important now, since infrared spectroscopy technology may be a quick, non-destructive and environmentally friendly method in comparison to traditional analyses methods. In addition, this procedure is considered low time-consuming and requires only few milligrams of sample (Ferrão and Davanzo 2005). There are a whole series of problems in quantitative analysis for which multivariate calibration is appropriate, such as treatment for spectra with strong band overlapping. However, some spectral regions may contain information due to other analytes, non-modeled interferences, background variations and interactions, which degrade model accuracy (Hemmateenejad et al. 2007).
Recent applications have been published showing that spectral region selection using appropriate algorithms can signifi cantly improve the performance of these full-spectrum calibration techniques, avoiding non-modeled interferences and building a well-fi tted model (Lee et al. 2012, Nørgaard et al. 2005, Friedel et al. 2013). In practice,
multivariate regression model optimization is based on the identifi cation of a complete data subset that will produce the lowest prediction error (Chen et al. 2008). Several approaches have been proposed for selection of optimal set of spectral regions for multivariate calibration such as genetic algorithms, interval PLS (iPLS) and synergy PLS (siPLS) (Silva et al. 2009, Friedel et al. 2013, Leardi and Nørgaard 2004, Navea et al. 2005, Bogomolov and Hachey 2007, Menezes et al. 2014, Ruschel et al. 2014). Interval PLS allows the construction of models with a spectral interval, and Root Mean Square Error of Cross Validation (RMSECV) values can be used as the criterion to evaluate the prediction ability of this interval. However, the exclusion of intervals with higher RMSECV values can cause the loss of useful information. Thus, advanced regression algorithms like siPLS can be applied to
fi nd favorable interval combinations for calibration. Spectroscopy procedures involving multivariate calibration have received increasingly wider applications in pharmaceutical analysis (Bodson et al. 2006, Blanco et al. 2007, Garcia-Reiriz et al. 2007, Müller et al. 2011, Li et al. 2012, Ferreira et al. 2013). However, mid-infrared (MIR) in combination with multivariate calibration is under-utilized in pharmaceutical analysis in comparison to other spectroscopic techniques (Lundstedt-Enkel et al. 2006, Moros et al. 2007).
of SMZ and TMP in pharmaceutical preparations has been described using the spectrophotometric method based on red-colored product formation by diazotization of sulphonamides (Nagaraja et al. 2002), the fl ow injection systems (Tomšů et al. 2004), high performance liquid chromatography (Akay and Ozkan 2002, Goulas et al. 2014), second derivative spectrophotometry (Granero et al. 2002), adsorptive stripping voltammetry (Carapuça et al. 2005) and multivariate methods (Ni et al. 2006, Cordeiro et al. 2008).
Pharmacopoeial methods list HPLC as the offi cial assay procedure for quality control in phar-maceutical preparations (USP 2007). In the present work, DRIFTS quantification of commercial tablets containing SMZ and TMP were presented. Interval Partial Least Square (iPLS) and Synergy Partial Least Square (siPLS) were applied to select a spectral range that provided the lowest prediction error in comparison to the full-spectrum model.
mg of SMZ and TMP per tablet, respectively) from nine manufactures (named commercial samples) were purchased from local drugstore or acquired by means of donation from pharmaceutical industries. SMZ and TMP certifi ed reference materials were acquired from Brazilian Pharmacopoeia (batches 1010 and 1011 for SMZ and TMP, respectively). Methanol, acetonitrile and triethylamine were HPLC grade. For building of the clusters by hierarchical cluster analysis (HCA), the Euclidian distance and incremental linkage for were used. To carry out the HCA Pirouete® (Infometrix) software was used. For the selection of the calibration and the validation sets was employed The calibration set was constructed with thirty- two synthetic samples and nine commercial samples and the prediction set was constructed using seventeen synthetic samples and six commercial samples. Synthetic and commercial samples were prepared by powder mixing in a cryogenic mill Spex Certiprep (model 6750 Freezer Mill, Metuchen, EUA). A time period of 2 min was enough to mix each sample, which was ground up to particle sizes smaller than 80 μm.
TABLE I
Synthetic samples used in calibration and prediction sets.
Samples SMZ (mg g -1
) TMP (mg g -1
) Excipients (mg g -1
)
1c 400 120 480
2c
400 140 460
3c
400 160 440
4c
400 180 420
5c
400 200 400
6c
400 240 360
7c
600 80 320
8c 600 120 280
9c
600 140 260
10c
600 160 240
11c
600 180 220
12c
600 200 200
13c
600 240 160
14c
700 80 220
15c 700 120 180
16c
700 140 160
Figure 1 - Sulphamethoxazole (A) and trimethoprim (B) structural formulas.
MATERIALS AND METHODS
MATERIALSAND SAMPLE PREPARATION
APPARATUSAND SOFTWARE
A Nicolet Magna 550 spectrometer (Nicolet Instrument Co., Madison, WI) was used for all the experiments. All spectra were recorded from 4000 cm-1 to 600 cm-1 with 16 scans and spectral resolution of 4 cm-1. This instrument was equipped with an EasiDiff® diffuse refl ectance sampling accessory (Pike Technologies Inc., USA). For DRIFTS data
acquisition, 34.0 ± 0.3 mg of solid sample was placed onto the accessory and its spectrum was recorded without any dilution in KBr (Wu et al. 2010). For the background spectrum, we used only KBr grade spectroscopic. For each sample, three spectra were acquired and the average spectrum was used for building the multivariate models.
Data were handled using Matlab software 6.5 version (The Math Works, Natick, USA). For PLS multivariate calibration models, the “PLS Toolbox” 2.0 version was used (Eigenvector Technologies, Manson, USA). The iToolbox for Matlab was used for the variable selection and the multivariate model development (Nørgaard et al. 2000). Software program was run on an IBM-compatible Intel Pentium 4 CPU 3 GHz and 2 Gbytes RAM microcomputer. The spectral band was divided into 10, 25 and 50 intervals for evaluation of the models generated from iPLS and siPLS algorithms. The differential compaction degree and particle size may lead to baseline variations and artefacts because of physical light scattering, therefore, multiplicative scatter correction (MSC) was employed to reduce this scattering effect. The spectra of samples were preprocessed by mean centering. A statistical F test (α = 0.5%) was introduced in order to show if there were significant differences between prediction errors of the constructed models.
HPLC REFERENCE METHOD
SMZ and TMP content was carried out using HPLC procedure according to the method described in the United States Pharmacopoeia (USP 2007). This procedure was chosen as reference and it was performed with a HPLC system consisting of Agilent 1100 Series system. Commercial tablets were fi nely powdered. A mass corresponding to 160 mg of sulphamethoxazole and 32 mg trimethoprim for each formulation was accurately weighed and dissolved in 100 mL of methanol. The sample preparations were subjected to sonication using an ultrasonic bath for fi fteen minutes. An aliquot of 5 Samples SMZ (mg g -1
) TMP (mg g -1
) Excipients (mg g -1
) 17c
700 160 140
18c
700 200 100
19c 700 240 60
20c
800 80 120
21c
800 120 80
22c
800 140 60
23c
800 160 40
24c
800 180 20
25c
800 200 0
26c 850 80 70
27c
850 120 30
28c 850 140 10
29c
850 150 0
30c
900 80 20
31c
900 90 10
32c
900 100 0
33p
500 125 375
34p
500 175 325
35p 500 220 280
36p
650 100 250
37p
650 150 200
38p
650 175 175
39p
650 220 130
40p
750 100 150
41p
750 125 125
42p 750 150 100
43p
750 175 75
44p
750 220 30
45p
825 100 75
46p
825 125 50
47p
825 175 0
48p
875 100 25
49p 875 125 0
C
synthetic samples used in calibration set. p
mL of each sample was added to 50 mL volumetric
fl asks and the mobile phase was used to complete the volume. All these determinations were performed in triplicate for synthetic and commercial samples.
MULTIVARIATE ANALYSIS
Multivariate chemometric methods were applied to obtain quantitative information from the measurements. Partial Least Square Regression was applied to DRIFTS data to build calibration models, enabling prediction of SMZ and TMP amounts in pharmaceutical preparations. The Root Mean Square Error (RMSE) was calculated according to the equation 1 (Geladi et al. 2004):
(
)
21 ˆ n i i i y y RMSE n = − =
∑
(1)Where: ŷi is the predicted value for the test set sample i, yithe measured value for the test set sample i, and n is the number of observation in the tested set. Root Mean Square Error of Cross-Validation was used to evaluate the error of the proposed calibration models and to select the number of latent variables. Root Mean Square Error of Prediction (RMSEP) was used to evaluate the prediction ability between different PLS models (Brereton 2003). Performance of the obtained cali-bration models was checked through relative Stan-dard Error of Prediction (RSEP) as calculated by:
100 ) ( ) ˆ ( 1 2 1 2 x y y y RSEP n i i n i i i
∑
∑
= = − = (2)Where: ŷi is the predicted value for the test set sample i, yithe measured value for the test set sample i. The iPLS models were built with the spectrum divided into 10, 25 and 50 intervals. The iPLS routine generated graphical information indicating
the optimal number of latent variables used in each interval model, and RMSECV values. In this case, the subinterval that presented the lowest RMSECV values was selected. Synergy PLS models were constructed with the spectrum set divided into 10, 25 and 50 intervals and combinations from two to fi ve intervals. The combined subintervals that presented the lowest RMSECV values were selected. The systematic error (“bias”) and the Standard Deviation of Validation (SDV) were calculated from equations 3 and 4, respectively (ASTM E1655-05 2005):
n
y
y
bias
n i i i∑
=−
=
1)
(
(3)(
)
[
]
1
1 2−
−
−
=
∑
=n
bias
y
y
SDV
n i i i
(4)Thereafter, the t-test was applied, according to equation 5 (ASTM E1655-05 2005):
SDV
n
bias
t
sist=
(5)The systematic error was not considered significant for the tsist values lower than critical value at alpha = 0.05 and df = n-1.
Results obtained by DRIFTS for SMZ and TMP quantification in commercial tablets were compared with the interval permitted by Brazilian Pharmacopoeia (93-107% declared value).
RESULTS AND DISCUSSION
SELECTIONOF CALIBRATIONAND VALIDATION SAMPLES
in their formulations can vary considerably as per manufacturer products. If careful considerations are made when selecting the representative calibration sample set that will cover these variations, the universal model should be achievable. A Hierarchical Cluster Analysis (HCA) was then performed for a representative calibration and prediction sets for different samples (synthetic and commercial samples).
FULL-SPECTRUM PLS MODEL
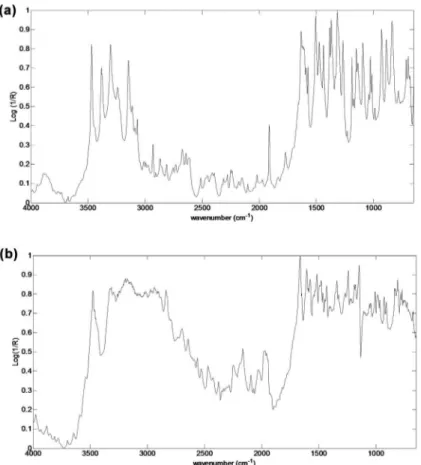
Figure 2 shows the SMZ and TMP spectra used for the preparation of the synthetic samples. These
spectra show signals (SMZ signals: N-H stretch 3482, 3395 and 3315 cm-1, =C-H stretch 3160 cm-1, overtone aromatic p-disubstituted 1771 cm-1, C=N stretch isoxazole ring 1634 cm-1, C=C aromatic
stretch 1475 cm-1, O=S=O stretch 1317 and 1189 cm-1, C-H aromatic p-disubstituted 840 cm-1; TMP signals: N-H stretch 3475 and 3319 cm-1, C-H
stretch 2935 and 2848 cm-1, C=C aromatic stretch
1480 cm-1, C-O stretch 1243 and 1046 cm-1, C-H aromatic substituted 838 cm-1) corresponding to the aromatic rings (in this case heteroaromatic) for the
pharmaceutical compounds used.
Figure 2 - DRIFTS spectra of sulphamethoxazole (A) and trimethoprim (B).
Initially, in order to have a measurement of the quality of the variable selection algorithms, as well as the effects that pretreatment, models were built using DRIFTS full-spectrum information. Full-spectrum PLS models were obtained with
When the results with and without pretreatment were compared, the number of latent variables increase for the models without pretreatment. The RMSECV and RMSEP values also increased for the models without pretreatment. These results demonstrate the necessity of pretreatments of the spectral data to build a multivariate regression models. On this basis in other tables will be presented only the results that employ them preprocessed spectral data.
SULPHAMETHOXAZOLEiPLS MODELS
The principle behind the interval PLS algorithm is to split the spectrum into smaller equidistant regions and develop models for each subinterval. Thereafter, the subintervals RMSECV are compared to full-spectrum RMSECV values. The results are shown in Table III.
Interval PLS plots RMSECV values for each interval selected and the RMSECV values for the full-spectrum model using eight latent variables are shown in Figure 3. Interval of number 9 for model PLS with 10 intervals (iPLS10) produced
the lowest RMSECV but did not produce RMSEP lower than the full-spectrum PLS model. Problems associated with overfitting were present in this model, which led to higher errors than the ones generated by the global model. This fact can be due to the lack of robustness of these models which, despite producing RMSECV in the same order as the global model, did not have enough information to build models with low prediction errors (Faber and Rajkó 2007).It is possible that the most important spectral information for the regression are not contiguous. In this case the selection of a single range is insuffi cient, leading to increased error in prediction (Friedel et al. 2013). Moreover, the calibration using the full spectrum may include non-informative spectral regions making the obtained model more vulnerable to noise. In this case, a judicious selection of spectral regions would improve the predictive ability of the PLS model (Lee et al. 2012). Therefore, variable selection by siPLS was implemented to verify if the combination of more than one interval would result in models with better predictive capacity.
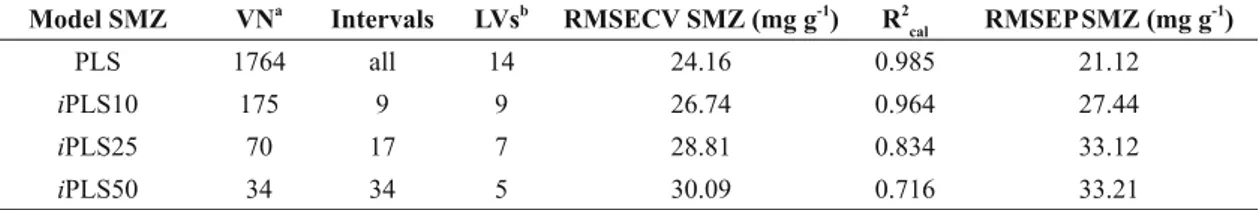
TABLE II
Statistical results to iPLS calibration models and full-spectrum PLS model without pretreatment for the SMZ. Model SMZ VNa
Intervals LVsb
RMSECV SMZ (mg g-1
) R2
cal RMSEPSMZ (mg g -1
)
PLS 1764 all 14 24.16 0.985 21.12
iPLS10 175 9 9 26.74 0.964 27.44
iPLS25 70 17 7 28.81 0.834 33.12
iPLS50 34 34 5 30.09 0.716 33.21
a
VN: total number of variables. b
LVs: latent variables.
TABLE III
Statistical results to iPLS calibration models and full-spectrum PLS model for the SMZ. Model SMZ VNa Intervals LVsb RMSECV SMZ (mg g-1) R2cal RMSEPSMZ (mg g-1)
PLS 1764 all 8 23.29 0.999 16.99
iPLS10 175 9 9 21.74 0.979 20.91
iPLS25 70 17 2 27.46 0.954 31.85
iPLS50 34 34 2 29.86 0.634 34.21
a
VN: total number of variables. b
SULPHAMETHOXAZOLEsiPLS MODELS
The siPLS algorithm principle is to split the data set into a number of intervals (variable-wise) and to calculate all possible PLS model combinations of two, three or more intervals. Thereafter, the combined subinterval RMSECV is compared to
full-spectrum RMSECV values. The spectrum was divided into 10, 25 or 50 intervals combined in up to 5 subintervals. The best results were achieved when the spectrum was split into ten intervals and the intervals of number 6, 7 and 10 were selected, as shown in Table IV. For this siPLS model, results showed good correlation between Figure 3 - Cross-Validated Prediction Errors (RMSECV) values for full-spectrum model
and interval models (bars) for the SMZ determination using PLS and iPLS algorithms (dotted line and numbers above interval numbers refer to full-spectrum RMSECV and latent variables used in each model, respectively).
TABLE IV
Statistical results to siPLS calibration models and full-spectrum PLS model for the SMZ. Model SMZ VNa
Intervals LVsb
RMSECV SMZ (mg g-1
) R2
cal RMSEP SMZ (mg g -1
)
PLS 1764 all 8 23.29 0.988 16.99
siPLS10 350 6 and 8 7 14.97 0.997 13.25
siPLS10* 525 6, 7 and 10 4 15.28 0.996 13.03
siPLS10 700 3, 6, 7 and 9 10 13.79 0.999 23.43
siPLS10 875 1, 5, 6, 8 and 9 7 15.06 0.997 13.57
siPLS25 140 15 and 20 7 13.16 0.995 27.86
siPLS25 210 15, 20 and 22 6 13.75 0.996 22.88
siPLS50 70 30 and 39 5 16.32 0.974 25.43
siPLS50 105 30, 34 and 47 6 12.60 0.990 17.86
a
VN: total number of variables. b
reference and predicted values indicated by a correlation coeffi cient of 0.994, as shown in Figure 4. The selected intervals included the regions of 1,960 – 2,300 cm-1 (interval 6) and 1,620 – 1,960 cm-1 (interval 7). Both intervals correspond to harmonic bands by aromatic ring (Colthup et al. 1990). Interval 10 (600 - 939 cm-1) corresponds to
out-of-plane N-H bending vibration. On the whole, the combination of intervals 6, 7 and 10 by siPLS algorithm, reduced RMSECV and RMSEP values. Therefore, it was possible to fi nd a narrow region for SMZ determination with small prediction errors; reduced variable numbers (525 variables compared to 1,764 used in the full-spectrum model) and reduced latent variables (4 LV compared to 8
LV used in the full-spectrum model) resulting in a more robust model with better predictive power. Average prediction results, and RMSEP for the selected siPLS calibration models, are shown in Table V. The siPLS model using intervals 6, 7 and 10 resulted in low Relative Standard Error of Prediction (RSEP = 1.77%), suggesting that the method used is accurate as also shown in Table V. The errors calculated for the prediction samples showed random behavior as shown by this model with insignifi cant systematic error (bias = 1.77 and tsist <tcrit). For a subset of commercial samples, no signifi cant trend was observed (bias = 1.29 and tsist <tcrit), which shows that the systematic error for the model may be considered insignifi cant.
Figure 4 - Reference HPLC values versus predicted SMZ values for siPLS model using intervals 6, 7 and 10 and 4 latent variables.
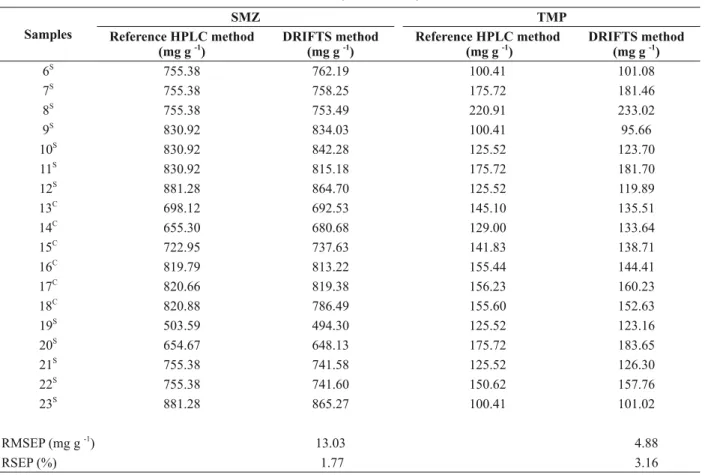
TABLE V
Results of average prediction values for the better siPLS models.
Samples
SMZ TMP
Reference HPLC method (mg g -1
)
DRIFTS method (mg g -1
)
Reference HPLC method (mg g -1
)
DRIFTS method (mg g -1
) 1S
503.59 499.04 175.73 169.99
2S
503.59 500.52 220.91 217.80
3S
654.67 650.59 100.41 93.37
4S
654.67 657.72 150.62 159.36
5S
TRIMETHOPRIMiPLS MODELS
Figure 5 shows the central iPLS plots, the RMSECV values for each interval selected (bars) and the RMSECV values for full-spectrum model (line) using four latent variables. Table VI shows the statistical indicator for TMP iPLS calibration models using the spectrum subdivided into 10, 25 and 50 intervals. The models were developed from the division of the spectrum into 10 and 25 selected intervals in a similar region (941-1280 and 1110-1250 cm-1), showing that this region is
suffi cient to create a model for drug quantifi cation. For these regions does not occur a significant increase in RMSECV value compared to the value of the global model, but the RMSEP value and the number of variables have been reduced. As in the previous case, siPLS was implemented to verify if
the combination of more than one interval would result in models with better predictive capacity.
TRIMETHOPRIMsiPLS MODELS
The algorithm siPLS was implemented using the spectrum subdivided into 10, 25 or 50 intervals combined in up to 5 subintervals. Table VII shows the statistical indicators for TMP siPLS calibration models. The results showed a good correlation between reference and predicted values, indicated by a correlation coeffi cient of 0.983, as shown in Figure 6.
The lowest RMSEP value was obtained when the spectrum was split into 25 intervals and intervals 15 and 17 were combined. For this siPLS model, the results showed a good correlation between reference and predicted values, indicated Samples
SMZ TMP
Reference HPLC method (mg g -1
)
DRIFTS method (mg g -1
)
Reference HPLC method (mg g -1
)
DRIFTS method (mg g -1
) 6S
755.38 762.19 100.41 101.08
7S
755.38 758.25 175.72 181.46
8S
755.38 753.49 220.91 233.02
9S
830.92 834.03 100.41 95.66
10S
830.92 842.28 125.52 123.70
11S 830.92 815.18 175.72 181.70
12S
881.28 864.70 125.52 119.89
13C
698.12 692.53 145.10 135.51
14C
655.30 680.68 129.00 133.64
15C
722.95 737.63 141.83 138.71
16C
819.79 813.22 155.44 144.41
17C
820.66 819.38 156.23 160.23
18C 820.88 786.49 155.60 152.63
19S
503.59 494.30 125.52 123.16
20S
654.67 648.13 175.72 183.65
21S
755.38 741.58 125.52 126.30
22S
755.38 741.60 150.62 157.76
23S
881.28 865.27 100.41 101.02
RMSEP (mg g -1) 13.03 4.88
RSEP (%) 1.77 3.16
S
synthetic samples. C
commercial samples.
Figure 5 - Cross-Validated Prediction Errors (RMSECV) values for full-spectrum model and interval models (bars) for the TMP determination using PLS and iPLS algorithms (dotted line and numbers above interval numbers refer to full-spectrum RMSECV and latent variables used in each model, respectively).
TABLE VI
Statistical results to iPLS calibration models and full-spectrum PLS model for the TMP. Model TMP VNa
Intervals LVsb
RMSECV TMP (mg g-1
) R2
cal RMSEPTMP (mg g -1
)
PLS 1764 all 4 12.22 0.959 10.61
iPLS10 175 9 5 13.19 0.952 6.87
iPLS25 70 21 6 12.92 0.954 8.66
iPLS50 35 28 4 11.26 0.965 10.13
a
VN: total number of variables. b
LVs: latent variables.
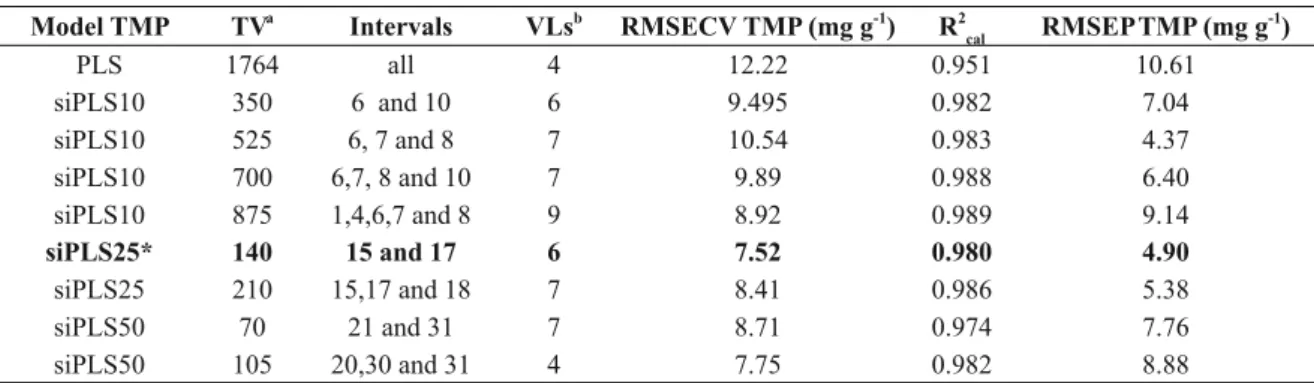
TABLE VII
Statistical results to siPLS calibration models and full-spectrum PLS model for the TMP. Model TMP TVa
Intervals VLsb
RMSECV TMP (mg g-1
) R2
cal RMSEPTMP (mg g -1
)
PLS 1764 all 4 12.22 0.951 10.61
siPLS10 350 6 and 10 6 9.495 0.982 7.04
siPLS10 525 6, 7 and 8 7 10.54 0.983 4.37
siPLS10 700 6,7, 8 and 10 7 9.89 0.988 6.40
siPLS10 875 1,4,6,7 and 8 9 8.92 0.989 9.14
siPLS25* 140 15 and 17 6 7.52 0.980 4.90
siPLS25 210 15,17 and 18 7 8.41 0.986 5.38
siPLS50 70 21 and 31 7 8.71 0.974 7.76
siPLS50 105 20,30 and 31 4 7.75 0.982 8.88
a
VN: total number of variables. b
by a correlation coefficient of 0.983, as shown in Figure 5. The selected intervals included the regions of 2100 to 2230 cm-1 (interval 15) and 1830 to 1960 cm-1 (interval 17). Both intervals include harmonic bands vibrations of the pyrimidine ring presented in structure of TMP (Colthup et al. 1990). The siPLS model combined intervals 15 and 17 allowing better predictive ability when compared to iPLS models and full-spectrum PLS model. Therefore, it was possible to fi nd a narrow region for TMP determination with small prediction errors and reduced variable numbers. Average prediction results, RMSEP and RSEP (%) for the selected siPLS calibration model are shown in Table V. This siPLS model combining three intervals resulted in low prediction errors (RSEP = 3.16%). The systematic error obtained for the model was not signifi cant. The errors calculated for the prediction samples showed random behavior (bias = 1.26 and tsist <tcrit). For a subset of commercial samples, no signifi cant trend was observed (bias = -0.09 and tsist <tcrit), which shows that the systematic error for the model may be considered insignifi cant.
CONCLUSIONS
Using the PLS regression algorithm combined with DRIFTS data it was possible to develop multivariate models for simultaneous determination of SMZ and TMP in commercial pharmaceutical products. Assay results, expressed as the percentage of the label claim, were found to be 95.8 to 103.9% for SMZ and 95.7 to 106.4% for TMP. These results were in agreement with the content of SMZ and TMP in powder mixtures according to the USP 30 requirements (93 to 107%) for the solid preparations. The variable selection techniques used in this work, produced models with better predictive ability compared to full-spectrum PLS models. The siPLS algorithm proved to be most appropriate, combining the spectral regions containing the most relevant information for each analyte quantifi ed. The proposed method is simple, solvent-free and allows potential applications for simultaneous, fast and reliable determination of SMZ and TMP in solid pharmaceutical dosage forms.
ACKNOWLEDGMENTS
The authors would like to thank Prati Donaduzzi Ltd. (Brazil) for supplying samples and Conselho Nacional de Desenvolvimento Científico e Tecnológico (CNPq), Coordenação de Aperfeiçoa-mento de Pessoal de Nível Superior (CAPES), INCT-Bioanalítica, Fapergs and ANVISA for
fi nancial support and donations.
RESUMO
Um método alternativo para quantifi cação de sulfametoxazol (SMZ) e trimetoprima (TMP), empre-gando espectrometria por refl etância difusa no infra-vermelho por transformada de Fourier (DRIFTS) e regressão por mínimos quadrados parciais (PLS) foi desenvolvido. Regressão por mínimos quadrados parciais por intervalo (iPLS) e por sinergismo de intervalos (siPLS) foram aplicadas para selecionar as faixas espectrais que produziram modelos com menores erros na previsão, em comparação ao modelo que emprega todo o espectro. Quinze comprimidos de formulações comerciais e quarenta e nove amostras sintéticas foram usados. As faixas de concentração consideradas foram de 400-900 mg g-1 para o SMZ e de 80-240 mg g-1
para a TMP. Os espectros por refl etância difusa no infravermelho por transformada de Fourier (DRIFTS) foram adquiridos na faixa 600-4000cm-1
com resolução de 4 cm-1. O presente procedimento foi comparado com cromatografi a líquida de alta efi ciência (HPLC). Os resultados obtidos para os erros quadráticos médios de previsão (RMSEP), durante a validação dos modelos para as amostras de sulfametoxazol (SMZ) e trimetoprima (TMP) usando siPLS, demonstram que esta abordagem trata-se de uma técnica válida para análise quantitativa de formulações farmacêuticas. Os modelos de regressão, obtidos a partir dos intervalos selecionados pelo algoritmo, apresentaram menores erros quando comparados ao modelo PLS global. Para as melhores regiões selecionadas pelo siPLS , Os valores RMSEP de 13,03 mg g-1 para SMZ e de 4,88 mg g-1 para TMP foram obtidos a partir da seleção das melhores regiões espectrais pelo siPLS.
Palavras-chave: quimiometria, espectrometria por refl e-tância difusa no infravermelho por transformada de Fourier, metodologia ambientalmente amigável, croma tografi a
líquida de alta efi ciência, mínimos quadrados parciais por intervalo (iPLS), mínimos quadrados parciais por sinergismo de intervalos (siPLS).
REFERENCES
AKAY C AND OZKAN SA. 2002. Simultaneous LC deter-mination of trimethoprim and sulphamethoxazole in pharmaceutical formulations. J Pharm Biomed Anal 30:1207-1213.
ASTM. 2015. Standards Practices for Infrared, Multivariate, Quantitative Analysis, ASTM International E1655-05, West Conshohocken: Pennsylvania, USA, 2005.
ARMENTA S, GUARRIGUES S, DE LA GUARDIA M AND RONDEAU P. 2005. Attenuated total reflection-fourier transform infrared analysis of the fermentation process of pineapple. Anal Chim Acta 545: 99-106.
BLANCO M, CASTILLO M, PEINADO A AND BENEYTO R. 2007. Determination of low analyte concentrations by near-infrared spectroscopy: effect of spectral pretreatments and estimation of multivariate detection limits. Anal Chim Acta 581: 318-323.
BODSON C, DEWÉ W, HUBERT P AND DELATTRE L. 2006. Comparison of FT-NIR transmission and UV-vis spectrophotometry to follow the mixing kinetics and to assay low-dose tablets containing riboflavin. J Pharm Biomed Anal 41: 783-790.
BOGOMOLOV A AND HACHEY M. 2007. Application of SIMPLISMA purity function for variable selection in multivariate regression analysis: A case study of protein secondary structure determination from infrared spectra. Chemom Intell Lab Syst 88: 132-142.
BOYER C, BREGERE B, CROUCHET S, GAUDIN K AND DUBOST JP. 2006. Direct determination of niflumic acid in a pharmaceutical gel by ATR/FTIR spectroscopy and PLS calibration. J Pharm Biomed Anal 40: 433-437.
BRERETON RG. 2003. Chemometrics data analysis for the laboratory and chemical plant. J Wiley & Sons, Chichester, 1st
ed., 489 p.
BUNACIU AA, ABOUL-ENEIN HY AND FLESCHIN S. 2010. Application of Fourier transform infrared spectrophotometry in pharmaceutical drugs analysis. Appl Spectrosc Rev 45: 206-219.
CARAPUÇA HM, CABRAL DJ AND ROCHA LS. 2005. Adsorptive stripping voltammetry of trimethoprim: mechanistic studies and application to the fast determi-nation in pharmaceutical suspensions. J Pharm Biomed Anal 38: 364-369.
COLTHUP NB, DALY LH AND WIBERLEY SE 1990. Introduction to Infrared and Raman Spectroscopy, 3rd
ed., Academic Press, London, 547 p.
CORDEIRO GA, PERALTA-ZAMORA P, NAGATA N AND PONTAROLLO R. 2008. Determination of sulfamethoxazole and trimethoprim mixtures by multivariate electronic spectroscopy. Quim Nova 31: 254-260.
FABER NM AND RAJKÓ R. 2007. How to avoid over-fitting in multivariate calibration – the conventional validation approach and na alternative. Anal Chim Acta 595: 98-106. FERRÃO MF AND DAVANZO CU. 2005. Horizontal attenuated
total reflection applied to simultaneous determination of ash and protein contents in commercial wheat flour. Anal Chim Acta 540: 411-415.
FERREIRA MH, BRAGA JWB AND SENA MM. 2013. Development and validation of a chemometric method for direct determination of hydrochlorothiazide in pharmaceutical samples by diffuse reflectance near infrared spectroscopy. Microchem J 109: 158-164. FRIEDEL M, PATZ CD AND DIETRICH H. 2013. Comparison
of different measurement techniques and variable selection methods for FT-MIR in wine analysis. Food Chem 141: 4200-4207.
GARCIA-REIRIZ A, DAMIANI PC AND OLIVIERI AC. 2007. Different strategies for the direct determination of amoxicillin in human urine by second-order multivariate analysis of kinetic-spectrophotometric data. Talanta 71: 806-815.
GELADI P, SETHSON B, NYSTRÖM J, LILLHONGA T, LESTANDER T AND BURGER J. 2004. Chemometrics in spectroscopy. Spectrochim Acta B Atom Spectrosc 59: 1347-1357.
GOULAS V, ANISIMOVA ANDREOU T, ANGASTINIOTI MODITI C AND TZAMALOUKAS O. 2014. A rapid HPLC method for the determination of sulphonamides and trimethoprim in feed premixes. J Anim Feed Sci 23: 185-189.
GRANERO G, GARNERO C AND LONGHI M. 2002. Second derivative spectrophotometric determination of trime-thoprime and sulfamethoxazole in the presence of hydroxypropyl-β-cyclodextrin (HP-β-CD). J Pharm Biomed Anal 29: 51-59.
HEMMATEENEJAD B, AKHOND M AND SAMARI F. 2007. A comparative study between PCR and PLS in simultaneous spectrophotometric determination of diphenylamine, aniline, and phenol: Effect of wavelength selection. Spectrochim Acta Part A Mol Biomol Spectrosc 67: 958-965.
KIPOUROS K, KACHRIMANIS K, NIKOLAKAKIS I, TSERKI V AND MALAMATARIS S. 2006. Simultaneous quantification of carbamazepine crystal forms in ternary mixtures (I, III, and IV) by diffuse reflectance FTIR spectroscopy (DRIFTS) and multivariate calibration. J Pharm Sci 95: 2419-2431.
LAVINE B AND WORKMAN J. 2010. Fundamental review of chemometrics. Anal Chem 82: 4699-4711.
LEARDI R AND NØRGAARD L. 2004. Sequential application of backward interval partial least squares and genetic algorithms for the selection of relevant spectral regions. J Chemom 18: 486-497.
LEE HW, BAWN A AND YOON S. 2012. Reproducibility, complementary measure of predictability for robustness improvement of multivariate calibration models via variable selections. Anal Chim Acta 757: 11-18.
LI P, DU G, CAI W AND SHAO X. 2012. Rapid and nondes-tructive analysis of pharmaceutical products using near-infrared diffuse reflectance spectroscopy. J Pharm Biomed Anal 70: 288-294.
LIN Z, ZHOU L, MAHAJAN A, SONG S, WANG T, GE Z AND ELLISON D. 2006. Real-time endpoint monitoring and determination for a pharmaceutical salt formation process with in-line FT-IR spectroscopy. J Pharm Biomed Anal 41: 99-104.
LUNDSTEDT-ENKEL K, GABRIELSSON J, OLSMAN H, SEIFERT E, PETTERSEN J, LEK PM, BOMAN A AND LUNDSTEDT T. 2006. Different multivariate approaches to material discovery, process development, PAT and environmental process monitoring. Chemom Intell Lab Syst 84: 201-207. MENEZES CM, COSTA AB, RENNER RR, BASTOS LF, FERRÃO MF AND DRESSLER VL. 2014. Direct determination of tannin in Acacia mearnsii bark using near infrared spectroscopy. Anal Method 6: 8299-8305.
MOROS J, GARRIGUES S AND DE LA GUARDIA M. 2007. Comparison of two partial least squares infrared spectrometric methods for the quality control of pediculosis lotions. Anal Chim Acta 582: 174-180.
MÜLLER ALH, FLORES EMM, MÜLLER EI, SILVA FEB AND FERRÃO MF. 2011. Attenuated total reflectance with Fourier transform infrared spectroscopy (ATR/FTIR) and different PLS Algorithms for simultaneous determination of clavulanic acid and amoxicillin in powder pharmaceutical formulation. J Braz Chem Soc 22: 1903-1912.
NAGARAJA P, SUNITHA KR, VASANTHA RA AND YATHIRAJAN HS. 2002. Iminodibenzyl as a novel coupling agent for the spectrophotometric determination of sulfonamide derivatives. Eur J Pharm Biopharm 53: 187-192.
NAVEA S, TAULER R AND JUAN A. 2005. Application of the local regression method interval partial least-squares to the elucidation of protein secondary structure. Anal Biochem 336: 231-242.
NI Y, QI Z AND KOKOT S. 2006. Simultaneous ultraviolet– spectrophotometric determination of sulfonamides by multivariate calibration approaches. Chemom Intell Lab Syst 82: 241-247.
Raman spectroscopic quantifications of the crystallinity of lactose in whey permeate poder. Int Dairy J 15: 1261-1270. NØRGAARD L, SAUDLAND A, WAGNER J, NIELSEN JP,
MUNCK L AND ENGELSEN SB. 2000. Interval partial least-squares regression (iPLS): a comparative chemometric study with an example from near-infrared spectroscopy. Appl Spectrosc 54: 413-419.
O’NEIL MJ. 2006. The Merck Index: an encyclopedia of chemicals, drugs and biological, 14th
ed., Merck & Co, Whitehouse Station, New Jersey.
RUSCHEL CFC, HUANG CT, SAMIOS D AND FERRÃO MF. 2014. Análise Exploratória Aplicada a Espectros De Reflexão Total Atenuada no Infravermelho com Transformada de Fourier (ATR-FTIR) de Blendas de Biodiesel/Diesel. Quím Nova 37: 810-815.
SETTLE FA. 1997. Handbook of Instrumental Techniques for Analytical Chemistry. Prentice-Hall, New Jersey.
SILVA FEB, FERRÃO MF, PARISOTTO G, MULLER EI AND FLORES EMM. 2009. Simultaneous determination of sulphamethoxazole and trimethoprim in powder mixtures by attenuated total reflection-Fourier transform infrared
and multivariate calibration. J Pharm Biomed Anal 49: 800-805.
SILVA MAM, FERREIRA MH, BRAGA JWB AND SENA MM. 2012. Development and analytical validation of a multivariate calibration method for determination of amoxicillin in suspension formulations by near infrared spectroscopy. Talanta 89: 342-351.
TOMŠŮ D, CATALÁ ICARDO M AND MARTÍNEZ CALATAYUD J. 2004. Automated simultaneous triple dissolution profiles of two drugs, sulphamethoxazole-trimethoprim and hydrochlorothiazide-captopril in solid oral dosage forms by a multicommutation flow-assembly and derivative spectrophotometry. J Pharm Biomed Anal 36: 549-557. USP. 2007. The United States Pharmacopeia: USP30-NF25.
Rockville: The United States Pharmacopeial Convention, WU Z, TAO L, ZHANG P, LI P, ZHU Q, TIAN Y, DU G, LV M,