INTERNATIONAL RESEARCH JOURNAL OF PHARMACY
www.irjponline.com ISSN 2230 – 8407
Research Article
A VALIDATED REVERSE PHASE HIGH PERFORMANCE LIQUID CHROMATOGRAPHIC METHOD FOR THE DETERMINATION OF DOXOFYLINE IN PURE AND PHARMACEUTICAL FORMULATIONS
Lanka Venkateswararao, Golkonda Ramu and Chintala Rambabu*
Department of Chemistry, Acharya Nagarjuna University, Nagarjuna Nagar-522 510 Andhra Pradesh, India
Article Received on: 07/12/12 Revised on: 11/01/13 Approved for publication: 01/02/13
*E-mail: rbchintala@gmail.com
ABSTRACT
A novel reverse phase high performance liquid chromatographic method (RP-HPLC) was developed and validated for the determination of doxofylline (DXF) in pharmaceutical formulations. Agilent 1100 series HPLC instrument equipped with variable wavelength programmable UV-Visible detector and a chromosil C18 (250mm x 4.6mm, 5μm) column with an auto injector was used for the present investigation. A volume of 20µL of working standard of concentration 25µg/mL was injected into the chromatographic system, the component was separated by using the mobile phase of the mixture of potassium dihydrogen phosphate buffer of pH 5.5 and acetonitrile in the ratio 75:25(v/v) at a flow rate of 1.0 mL/min and the detection of the components was carried out at a wavelength of 275nm. Chemstation software was used for the data acquisition through out the analysis. The system suitable parameters such as number of theoretical plates, tailing factor and resolution were found to be satisfactory. The retention time of the component was found to be at 4.814 minutes. The proposed method was validated in terms of precision, accuracy, linearity, limit of detection, limit of quantification, robustness and ruggedness. The developed method was found to be rapid, simple and sensitive hence it could be used as an alternative method in assay of the doxofylline in any pharmaceutical industries.
KEYWORDS: Assay, Method development, RP-HPLC, System suitability, Validation
INTRODUCTION
Doxofylline (DXF) is a new generation long acting oral methyxanthine derivative drug used in the treatment of asthma.1 It is mainly used for maintenance therapy in patients suffering with Asthma and Chronic Obstructive Pulmonary Disease (COPD). DXF is a theophylline derivative. It has antitussive and bronchodilator 2 effects, and acts as a phosphodiesterase inhibitor3.In animal and human studies, it has shown similar efficacy to theophylline but with significantly fewer side effects4. Unlike other xanthines,
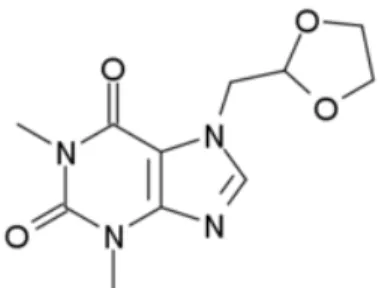
doxofylline lacks any significant affinity for adenosine receptors and does not produce stimulant effects. This suggests that its antiasthmatic effects are mediated by another mechanism, perhaps its actions on phosphodiesterase. It is chemically known as 7-(1,3-dioxolan-2-ylmethyl)-1,3-dimethylpurine-2,6-dione with molecular formula and molecular weight C11H14N4O4 and 266.25 g/mol respectively.
The chemical structure of the DXF is given in Figure 1.
Figure 1: The chemical structure of doxofylline molecule
An extensive literature survey was carried out and found that one LC-MS/MS method5 and four RP-HPLC methods 6-9 for the determination of DXF in human serum and plasma respectively. Several RP-HPLC methods 10-16 and UV-Spectrophotometric methods17-19 were reported for the determination of DXF in commercial dosage form, raw material and in tablets. Acid degradation study of doxofylline by RP-HPLC and LC-MS/MS20 was studied by Gupta et al. The main objective of the present investigation is to develop a simple, precise and accurate reverse phase isocratic liquid
chromatographic method and can be applied this method for the determination of the amount of doxofylline present in different pharmaceutical formulations.
METHODS AND MATERIALS Experimental
Agilent 1100 series HPLC instrument equipped with variable wavelength programmable UV-Visible detector and a Chromosil C18 column (250 mm x 4.6 mm, 5μm) was used for the present investigation. Mettler Toledo (XS1O5) balance and Loba ultrasonic bath sonicator were also used for weighing and degassing respectively. Elico SL 159 UV-Visible spectrophotometer was used for spectral studies. Chemstation software was used for the data acquisition throughout the analysis
Chemicals and reagents
A reference sample of DXF was obtained from Cipra Labs Hyderabad. The pharmaceutical formulations were purchased from the local market. The chemicals and solvents such as potassium dihydrogen phosphate, acetonitrile and water used for the present investigation were of AR and HPLC grade respectively. About 1.36 gm of potassium dihydrogen phosphate was accurately weighed, dissolved in 1000mL HPLC grade water, sonicated for five minutes, filtered through a 0.45µm filter and finally the pH of the solution was adjusted to 5.5 by adding 0.1N potassium hydroxide solution drop wise using calibrated pH meter. A mixture of buffer and acetonitrile in the ratio 75:25 (v/v) was prepared by adding 250 mL of acetonitrile to 750 mL of buffer, the resulting solution was sonicated and filtered through 0.45µm filter and used as mobile phase.
Preparation of standard solution
Preparation of sample solution
Doxofylline is available in different brand names like Synasma (Ranbaxy), Doxobid (Dr.Reddy’s), Doxosal (Salveolife) and Doxoril (Macleods). The average weight of two tablets of DXF (Synasma 400mg of each tablet) was determined, grounded to fine powdered and amount of the powder equivalent 25 mg of DXF was accurately weighed, transferred to 100 mL volumetric flask and dissolved in minimum amount of methanol then made up to mark with mobile phase, sonicated for 3 minutes and filtered through 0.45µm filter. About 4mL of the filtrate was further diluted to 10 mL with mobile phase to get the final concentration of the drug 100µg/mL.
Method development
The chromatographic analysis was carried out under the isocratic mode. The data were acquired at 275nm and
processed by use of Chemstation software. A volume of 20µL of working standard solution (100µg/mL) was injected into the column and the mobile phase was allowed to flow a rate of 1.0 mL/min and the chromatograms were recorded. Different trails were performed by changing one parameter (i.e. concentration of the working standard, injection volume, composition of the mobile phase, flow rate and detection wavelength) at a time keeping other parameters as constant. The chromatograms were recorded in each and every trail. Finally the chromatogram obtained under the chromatographic conditions such as 20µL volume of the working standard 100 µg/mL, mobile phase of composition of 75:25 (v/v) of buffer and acetonitrile at a flow rate of 1.0 mL/min and detection wavelength at 275nm was found to obey the system suitable conditions.
Table-1: System suitability parameters
Concentration (µg/mL) Retention Time (min) Theoretical Plates Tailing Factor Area of Peak
Blank 0.00 0.00 0.00 0.00 0.00
Standard 100.00 4.81 2514.00 0.97 4343308.89
†Acceptability criteria: Number of theoretical plates should be more than 2000, tailing factor should be less than 2.0 and resolution (not applicable for the present method) should be more than 2.0
Table-2: Precision of the developed method
Sample ID Retention Time (min) Area of Peak Tailing Factor
1 4.81 4343308.89 0.99
2 4.82 4341404.35 1.00
3 4.82 4363600.27 0.98
4 4.82 4346388.74 1.02
5 4.81 4355416.52 1.00
6 4.81 4350673.06 1.00
Mean 4.82 4350131.97 1.00
S.D. 0.004 8322.883 0.013
%R.S.D†. 0.077 0.191 1.331
†Acceptability criteria for precision: %R.S.D. should be less than 2.0
Table-3: Intra –Day and Inter-Day Precision (100 µg/mL)
Statistical Parameters Intra-Day Precision* Inter-Day Precision*
Mean 4350131 4356246
S.D. 8322 10126
%R.S.D. 0.191 0.232
*Statistical parameters were evaluated for n=6
Table-4: Linearity between the area of the peak and concentration of the doxofylline
S.No. Concentration (µg/mL) Mean Peak Area
1 10 415956.78
2 25 896670.99
3 50 1957171.58
4 100 4372852.23
5 200 8042749.88
6 300 12335156.95
Slope 41064.00
Intercept -15497.00
Squared Correlation Coefficient 0.9997
†Acceptability criteria: Correlation coefficient should be more than 0.828
Table-5: Accuracy studies at three different concentrations
Spike Level Sample-ID Amount of Drug Taken Amount of Drug Found % of Recovery %Mean Recovery %RSD
50 1 50 49.72 99.44
2 50 49.89 99.78
3 50 50.84 101.68 100.3 1.203
100 1 100 99.87 99.87
2 100 100.57 100.57
3 100 99.82 99.82 100.08 0.419
150 1 150 148.82 99.21
2 150 151.04 100.69
3 150 150.83 100.55 100.15 0.0716
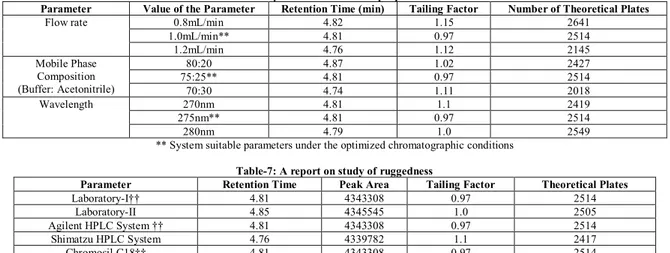
Table-6: Study of robustness of the proposed method
Parameter Value of the Parameter Retention Time (min) Tailing Factor Number of Theoretical Plates
Flow rate 0.8mL/min 4.82 1.15 2641
1.0mL/min** 4.81 0.97 2514
1.2mL/min 4.76 1.12 2145
Mobile Phase Composition (Buffer: Acetonitrile)
80:20 4.87 1.02 2427
75:25** 4.81 0.97 2514
70:30 4.74 1.11 2018
Wavelength 270nm 4.81 1.1 2419
275nm** 4.81 0.97 2514
280nm 4.79 1.0 2549
** System suitable parameters under the optimized chromatographic conditions
Table-7: A report on study of ruggedness
Parameter Retention Time Peak Area Tailing Factor Theoretical Plates
Laboratory-I†† 4.81 4343308 0.97 2514
Laboratory-II 4.85 4345545 1.0 2505
Agilent HPLC System †† 4.81 4343308 0.97 2514
Shimatzu HPLC System 4.76 4339782 1.1 2417
Chromosil C18†† 4.81 4343308 0.97 2514
Symmetric C18 4.82 4342977 0.95 2518
†† Laboratory, HPLC System and Column actually followed in the analysis
Table-8: Results of pharmaceutical formulation analysis
Sample-ID Area of Peak % of Assay†
1 4409038.8 100.82
2 4331218.7 99.05
3 4322151.4 98.84
Mean 4354136 99.572
SD 47762 1.092
%RSD 1.097 1.097
†Acceptability criteria: Mean percent of assay should be present in between 98.0 – 102.0%
Figure 2: Typical chromatogram of blank at detection wavelength 275nm
Figure 3: Typical chromatogram of working standard at detection wavelength 275nm
Figure 5: Linearity plot of peak area against concentration of the drug.
RESULTS AND DISCUSSION System suitability
A volume of 20µL of working standard solution (100µg/mL) was injected into the chromatographic system, chromatogram was recorded and system suitability parameters like number of theoretical plates and tailing factor were obtained from the analysis of chromatogram using Chemstation software, and found to be 2514 and 0.97 respectively. Retention time of the component and area of the peak were found to be 4.814 min., 4343308.89 respectively. Typical chromatograms for blank and working standard solution were presented in Figure 2 and Figure 3 respectively. The results were summarized in Table-1.
Precision
Precision was expressed in terms of percent of relative standard deviation (%R.S.D.) and was calculated from the mean and standard deviation of area of six peaks. A volume of 20µL of working standard of concentration 100 µg/mL was injected into the column six times, the chromatograms was recorded. Statistical parameters such as mean, standard deviation (S.D.) and percent of relative standard deviation (%R.S.D.) were calculated and presented in Table-2
Intra Day and Inter-Day Precision
Intraday precision is the degree of repeatability of an analytical method in the same day under normal operational conditions. Whereas inter day precision of the method was reproducibility of the method on different days, different laboratories, between two different analysts. To study the intraday precision, six replicate measurements for working standard solution of doxofylline were made and the respective chromatograms were obtained. To find inter day precision, six replicate measurements were made for working standard solution on two different days and result was expressed in terms of relative standard deviation (% RSD). The % RSD was calculated in each case and found to be 0.191 and 0.232 respectively. The results were found to be within the acceptable criteria and were shown in Table-3. Linearity
To determine the linearity of the proposed method, a series of six different concentrated solutions of the standard DXF including working concentration were prepared and about 20µL of each solution was injected in duplicate into the HPLC system, chromatograms were recorded under the optimum chromatographic conditions. A plot (Figure 5) between mean peak area and concentration was found to be linear in the range of concentration 10-300 µg/mL. The slope, intercept and correlation coefficient were calculated by least square regression method and were presented in Table-4. Accuracy
To find out the accuracy of the developed method a known amount of standard drug was added to the fixed amount of pre-analyzed tablet solution at three different concentration levels in triplicate. Percent recoveries were calculated by comparing the area before and after the addition of the standard drug. Satisfactory results were obtained presented in Table-5.
Limit of detection and Limit of quantification
Limit of detection (LOD) and limit of quantitiation (LOQ) of the developed method was evaluated from the study of signal by noise ratio method. To determine LOD the sample was dissolved in mobile phase and injected into the system until peak was diapered. After 0.25 µg/mL dilution the peak was not clearly observed. So it confirms that 0.25 µg/mL was the limit of detection. The limit of quantification was evaluated by determining the least concentration of the drug that can be quantified and found to be 0.825µg/mL.
Robustness
The study of robustness was performed by slight modification in chromatographic conditions such as flow rate of the mobile phase, pH of the buffer and composition of the mobile phase. The working standard solution of DXF was analyzed under these new experimental conditions. Only one parameter was changed while the others were kept unaltered. The system suitability parameters were evaluated as per the test method in all the cases and found to be within limits shown in Table-6
Ruggedness
Ruggedness is the degree of reproducibility of results obtained by the analysis of the same sample under a variety of normal test conditions. Ruggedness of the proposed method was performed by injecting six replicate injections of sample solution and the percent of assay was determined under different columns, different systems, and different labs over a period of one week. The results were presented in Table-7.
Analysis of pharmaceutical formulations
Pharmaceutical formulations were analyzed by the developed method by preparing a sample solution of 100.0µg/mL. The assay of the drug present in the each tablet was calculated by comparing the area of the peak of test with the standard. A typical chromatogram for the sample was given in Figure 4. The results were presented in Table-8.
CONCLUSIONS
solutions (Figure 3, 4). The system suitability parameters were evaluated and found within the limits. A plot was drawn between concentration of the component and the instrument response, it was found to be linear (Figure 5) in the concentration range 10µg/mL to 300µg/mL with good correlation coefficient (r=0.9997). Precision and accuracy of the developed method were expressed in %RSD and % of recovery of the active pharmaceutical ingredient respectively. The proposed RP-HPLC method for the estimation of DXF in dosage forms was found to be more sensitive and highly precise. The percent of recovery of the drug (accuracy) indicates that the proposed method was selective. Hence the developed RP –HPLC method may be used as an alternative method for routine analysis of the raw materials and formulations.
ACKNOWLEDGEMENTS
The authors are very much thankful to Acharya Nagarjuna University for giving Ph.D. registration and Cipra Labs Ltd. Hyderabad for providing laboratory facilities
REFERENCES
1. Cirillo R, Barone D, Franzone JS, "Doxofylline, an antiasthmatic drug lacking affinity for adenosine receptors",Arch Int Pharmacodyn Ther, 1988, 221–237
2. Poggi R, Brandolese R, Bernasconi M, Manzin E, Rossi A, "Doxofylline and respiratory mechanics. Short-term effects in mechanically ventilated patients with airflow obstruction and respiratory failure", Chest, 1989;96(4): 772–778.
3. Dini F.L, Cogo R, "Doxofylline: a new generation xanthine bronchodilator devoid of major cardiovascular adverse effects", Curr Med Res Opin,2001;16(4): 258–268
4. Sankar J, Lodha R, Kabra SK, "Doxofylline: The next generation methylxanthine", Indian J Pediatr, 2008;75(3):251–254.
5. Nimmagadda Sreenivas, Lakshmi Narasu M, Prabha Shankar B, Ramesh Mullangi, Development and validation of a sensitive LCMS/ MS method with electrospray ionization for quantitation of doxofylline in human serum-application to a clinical pharmacokinetic study, Biomed Chromatography,2008;6:654-661.
6. Gannu R, Bandari S, Sudke SG, Rao YM, Shankar BP, Development and Validation of a Stability-Indicating RP-HPLC Method for Analysis of Doxifylline in Human Serum. Application of the Method to a Pharmacokinetic Study, Acta Chromatographica, 2007;19: 149-157. 7. Tagliaro F, Dorizzi R, Frigerio A, Marigo M, Non-extraction HPLC
method for simultaneous measurement of dyphylline and doxofylline in serum, Clinical Chemistry, 1990;36: 113-115.
8. Kan Quan-cheng, Li Duo-lu,SHI Xiu-qin, HPLC determination of doxophylline and pharmacokinetic study in serum of patients with chronic obstructive pulmonary disease, Chinese Journal of Pharmaceutical Analysis, 2009;5:65- 74.
9. Lagana A, Bizzarri M, Marino M, Mancini, Solid phase extraction and high performance liquid chromatographic determination of doxophylline in plasma Biomedical Chromatography, 1990;4: 205–207.
10. Ashu Mittal and Shikha Parmar, Development and validation of rapid HPLC method for determination of doxofylline in bulk drug and pharmaceutical dosage forms. J Ana Chem, 2010;65: 293-297. 11. Lakshmi Sivasubramanian, Sarika V, Manikandan K, LakshmiKS,
RP-HPLC and HPTLC Methods for Determination of Doxofylline in Bulk and Formulations. Journal of Pharmacy Research, 2011;4(3): 643-644. 12. Gadapa Nirupa, Siva Kumar A,Upendra M. Tripathi, Novel LC Method
Development and Validation for Simultaneous Determination of Montelukast and Doxofylline in Bulk and Pharmaceutical Dosage Forms, Journal of Chemistry, 2010;65(3):293-297.
13. Sivasubramanian, Lakshmi, Sarika, Manikandan V, Lakshmi KS, RP-HPLC and HPTLC Methods for Determination of Doxofylline in Bulk and Formulations, Journal of Pharmacy Research, 2011;4(3):643-644. 14. Mittal, Ashu, Parmar, Shikha, Development and validation of rapid
HPLC method for determination of doxofylline in bulk drug and pharmaceutical dosage forms. Journal of Analytical Chemistry, 2010;65(3): 293-297.
15. Amit Kumar De, Ashok Kumar Bera, Biswajit Pal, Development and Validation of Same RP-HPLC Method for Separate Estimation of Theophylline and Doxofylline in Tablet Dosage Forms. Journal of Current Pharmaceutical Research, 9 (1), 2012;9(1): 55-58.
16. Venkatesan S, Giriraj P, Myvizhi S, Kathiravan P, Singh R, A simple HPLC method for quantitation of Doxofylline in tablet dosage form. Int J Chemical Pharm Sci., 2010;72: 235-237.
17. Joshi HR, Patel AH, Captain AD, Spectrophotometric and Reversed-Phase High-Performance Liquid Chromatographic Method for the Determination of Doxophylline in Pharmaceutical Formulation, Pharm Analysis, 2010;2:289-296.
18. Kamila MM, Mondal N, Ghosh LK, Development and validation of spectrophotometric method for estimation of antiasthmatic drug doxofylline in bulk and pharmaceutical formulation, Indian J Chem Tech, 2007;14: 523-525.
19. Umadevi B, Vetrichelvan.T, Development and validation of UV Spectrophotometric determination of Doxofylline and Ambroxol Hydrochloride in bulk and combined tablet formulation. Int J Curr Pharm Res., 2011;3: 89-92.
20. Gupta A, Rawat S, Gandhi.M, Yadav JS, Method development and acid degradation study of doxofylline by RP-HPLC and LC-MS/MS. Asian J Phar Ana., 2011;1:10-13.
Source of support: Nil, Conflict of interest: None Declared