Espacios. Vol. 32 (1) 2011. Pág. 31
Manufacturing integration with R&D and marketing: still a
cross-functional gap?
Integración entre fabricación e I&D: sigue existiendo una brecha entre funciones?
Ely Laureano Paiva* y Teniza da Silveira**
Recibido: 14-04-2010 - Aprobado: 12-09-2010 Contenido 1. Introduction 2. Theoretical References 3. Methodology 4. Results 5. Conclusions References ABSTRACT:
A growing number of studies attempt to analyze the dynamics of integration among different functional areas.
Manufacturing, R&D and marketing integration is a constant concern in management research since the classic articles of Shapiro and Crittenden thirty years ago. This study analyzes manufacturing, R&D and marketing integration, using a survey methodology. We compare how the manufacturing’s actions are integrated to the activities along the value network. Companies from food and machinery industries composed the sample. We analyzed the levels of integration into each industry and from a cross-industry approach. The results suggest the existence of a lack of integration between manufacturing and marketing when compared to the level of manufacturing integration with other functional areas, especially R&D.
Keywords: cross-functional integration; capabilities; market
dynamism; survey.
RESUMEN:
Un número creciente de estudios intenta analizar la dinámica de la integración entre diversas áreas funcionales. La integración de fabricación, R&D y marketing es una preocupación constante en la investigación de gerencia desde los artículos clásicos de Shapiro y de Crittenden hace treinta años. Este estudio analiza la integración de fabricación, R& D y marketing, usando una metodología survey. Comparamos cómo las acciones de la fabricación se integran a las actividades a lo largo de la red del valor. Las compañías de la industria del alimento y de la maquinaria compusieron la muestra. Analizábamos los niveles de integración en cada industria y entre industrias. Los resultados sugieren la existencia de una carencia de integración entre la fabricación y marketing cuando comparados al nivel de integración con otras áreas funcionales, especialmente de la fabricación con R&D.
Palabras claves: integración funcional, capacidades,
1. Introduction
Studies that analyze the dynamics of knowledge integration among different functional areas, hierarchical levels and among different organizations are usual in management research . Since both processes can enhance organizational performance and competitiveness, companies need to create capabilities to attain it. In accordance with this scenario, we have carried out a study with the food and machinery industries, that analyses capability creation from a cross-functional perspective. More specifically, we investigated the integration between manufacturing, R&D and marketing. We claim that when function actions are focused in a specific part from a value network there is a higher level of integration with this one. Therefore, capability creation in this case suggests to be a result from an asymmetric effort along the value network.
The article presents the following structure. Firstly, we present the theoretical references. Secondly, the research methodology is discussed. Thirdly, we present the results. Fourthly, we present the our first conclusions.
2. Theoretical References
Manufacturing integration with other functional areas and other external actors like suppliers and clients is a current topic in OM research. Nevertheless a few articles explore this issue in an integrated approach. Swink et al. (2007) was one of the first articles showing the relationship between corporate strategy, competitive priorities and performance.
This research aims to explore the three levels of cross-functional integration related to the strategic, tactical and operational levels (Parente, 1997). Nevertheless, diversely from Swink et al. (2007), we analyzed manufacturing integration with marketing and R&D areas.
2.1 Cross-functional Integration
Integration between manufacturing and marketing has been studied along the last decades (Abernathy, 1976, Shapiro, 1977, Hutt and Speh, 1984, Crittenden, 1992; Malhotra and Sharma, 2002; Hausman et al., 2002; O’Leary and Flores, 2002). Nevertheless, despite the importance given to the interactions among marketing and others functions in market orientation literature (Kohli and Jaworski, 1990, Narver and Slater, 1990, Slater and Narver, 1994, 1995), there is no much empirical evidence about how these interactions has developed. More recently, Maltz and Kohli (2000) analyzed the relative effectiveness of the integrating mechanisms commonly used in reducing conflict between marketing and other functions, including manufacturing. Cross-functional team use appears as an useful mechanism in reducing conflict between marketing and manufacturing, while other five mechanisms (i.e. multifunctional training, social orientation, spatial proximity, compensation variety and formalization) did not appear as effective ones.
Parente (1998) identified different focus in manufacturing-marketing integration research. The first focus is related to the level approach: strategic, tactical or operational. According to her, the contacts between the actors are more direct than in the other levels at the operational level, because short time adjustments are needed in this context. While in the tactical level individual characteristics are not at the center of the interaction, at the strategic level individual and functional integrations are the spotlight. The author suggested future studies related to the transaction and communication processes related to the strategic, tactical and operational levels. Song, Montoya-Weiss and Schmidt (1997) identified that evaluation criteria, reward structures, and management expectations affects positively cross-functional cooperation during the New Product Development (NDP) process. In a similar way, Shapiro (1977) in his seminal article on manufacturing and marketing integration identified quality assurance, breadth of product line and NPD, among others aspects, as critical issues for cross-functional integration.
2.2 Strategy and Integration within Networks
a main source of competency. Furthermore, capabilities have been one of the main focus in the literature on operation strategy presently (Hayes and Pisano, 1996; Zahra and Das. 1993; Stalk et al., 1992). From the marketing strategy point of view, the literature has stressed the competitiveness focus not just on customers, but also on cross-functional coordination, competitors, and profitability aspects, what is called market orientation (Kohli and Jaworski, 1990, Kohli, Jaworski and Kumar, 1993).
At the same time, strategy literature has studied the emergence of companies’ networks and the influence of this type of configuration on competitiveness (Tapscott, 1999; Venkatraman and Subramaniam, 2001). Oliver and Liebeskind (1997) studied the biotechnology industry. identifying inter-organizational and
intra-organizational networks. In the first case the networks are created among different companies. In the second case, the network is created internally among company’s functional areas. However, few studies on
operations strategy have analyzed the role of operations in companies’ networks and, more specifically, its integration with other functional areas.
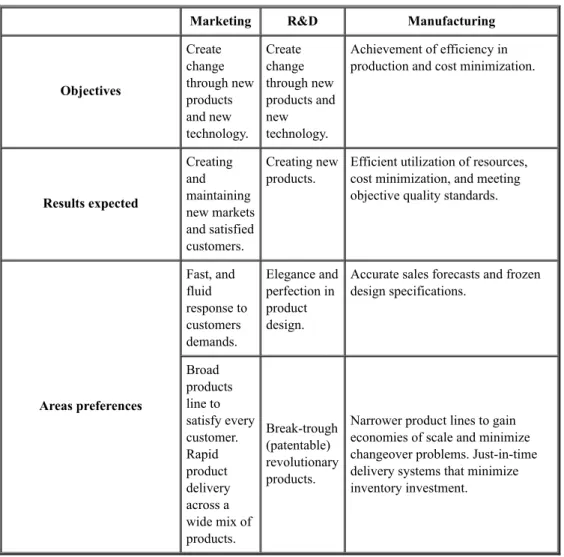
Table 1 – Propensity for conflict between functional areas in the NPD process: different goals
Marketing R&D Manufacturing
Objectives Create change through new products and new technology. Create change through new products and new technology. Achievement of efficiency in production and cost minimization.
Results expected Creating and maintaining new markets and satisfied customers. Creating new products.
Efficient utilization of resources, cost minimization, and meeting objective quality standards.
Areas preferences Fast, and fluid response to customers demands. Elegance and perfection in product design.
Accurate sales forecasts and frozen design specifications. Broad products line to satisfy every customer. Rapid product delivery across a wide mix of products. Break-trough (patentable) revolutionary products.
Narrower product lines to gain economies of scale and minimize changeover problems. Just-in-time delivery systems that minimize inventory investment.
Source: Adapted from Song, Montoya-Weiss and Schmidt (1997)
Complementarily, Hayes (2002) argued that in a new economy era operations management have changed in many aspects. Hayes shows that in the current context unit of analysis is not the operating unit but a network of independent parts where companies develop on-going relationships with suppliers, customers and
“complementors”, seeking sometimes to develop complementary products and to manage ever changing processes and networks. Similarly, Venkatraman and Subramanian (2001) claim that strategy is changing from portfolio of capabilities to portfolio of relationships in the “knowledge economy”. For them, current context is characterized by internal and external networks, companies’ position in networks of expertise and economies of scale, scope and expertise.
Porter (1986) proposed the value chain, identifying primary and secondary activities. De Toni and Forza (1992) adapted this proposal to operations. The main differences were the inclusion of R&D as a primary activity.
Marketing, R&D, inbound logistic, production, outbound logistic and services are the primary activities in the Value Chain (VN). These activities preferentially add value to the products. Organizational systems are related to human resources orientation, leadership and other issues related to the managers’ profile.
Management systems include all the managerial systems used in the VN – TQM, JIT, strategic planning, ISO etc. Technologies consider all types of technology related to hardware or software throughout the VN. This last group is named secondary activities. All of them support the primary activities listed above. Added to the primary and secondary activities, the competitive criteria (quality, cost, flexibility and delivery) focused by the company will define the decisions along the VN. Presently, the idea of networks has been extended also to the value creation (Brandenburger and Stuart, 1996). In this way, we claim that companies create value in their products/services from their VN, where internal and external networks are developed in order to integrate knowledge and to improve company’s performance.
Therefore, one of the main aspects related to the VN is the creation of added value in products or services. Porter (1986) stated that the links among each part of the value chain are able to build the needed conditions for a competitive advantage. Similarly, Brandenburger and Stuart (1996) argued that there is no asymmetry in the importance of suppliers, firms and buyers in the added value creation when we analyze companies’ competitiveness. On the other hand, for Ghemawat (2000), the most important aspect for competitiveness is not the links among the parts of the value chain, but the development of competencies in specific parts of the VN. Coca-Cola’s is an example, whose the source of competitive advantage is its distribution system
compared to competitors. Other authors also have stressed specific parts of the VN. Fine (2000) stressed out the importance of environmental dynamism over the supply chain and competitiveness. Also, services have been currently identified as one of the main focus for added value creation and competitive advantage creation (Wise and Baungartner, 1999; Chase and Garvin, 1989). Shortly, while Porter and Branderburger and Stuart (1996) bring an idea of strategic alignment, Ghemawat (2000) follows an idea asymmetric focus in the VN activities.
2.3 Capabilities and Cross-Functional Integration
Different authors consider the role of the knowledge integration into the companies as the support for a capability building process (Zahra and Das, 1993; Grant, 1996; Teece et al., 1997). To Grant (1996), knowledge integration is more important for competitiveness than just the knowledge itself.
Companies have tried to reinforce knowledge integration with managerial practices like NPD with cross-functional teams, TQM, and other policies related to human resources (Roth et al.. 1994; Nonaka and Konno, 1998). Therefore, one of the companies’ current challenges is to create decision making processes, which allow the existing knowledge integration in all hierarchic levels of the organization - from directory to shop-floor. This integrated knowledge creation may decrease company’s time decision and responsiveness, because strategic process will be based on a shared strategic view. These issues lead us to a central issue suggested by Mendelson and Pillai (1999): “Rapid changes in business conditions require organizations to shorten their response times in a commensurate manner.” (p. 8)
According to Grant (1996), knowledge integration needs three characteristics to support competitiveness: efficiency, scope and flexibility. The idea of cross-functionality is more related to the first aspect, because it deals with access and use of the specialist knowledge from organizational members. Through
cross-functional activities, companies will be able to maintain continuos exchange process based on experience and information from their employees and functional areas. Therefore, this organizational orientation also will be able to develop a shared strategic view and to create an internal network.
Considering the current competitive environment, dynamic capabilities are also related to added value creation across the VN. Therefore, we may consider that the strategic decisions in manufacturing are not restricted to the shop-floor but they are integrated to R&D, marketing, supply-chain, outbound logistic, services, or in other words, to the whole VN. Activities deployed from these decisions will create internal and external company’s networks, involving relationships with suppliers, clients, and internally among company’s functional areas such as manufacturing, marketing and R&D. In some specific situations, R&D also includes external networks. Cooperative R&D activities may occur involving suppliers, clients and even competitors (Oliver and Liebeskind, 1997).
Choi et al. (2002) pointed out that usually studies related to supply networks analyze three dimensions: formalization, centralization and complexity. Formalization is associated with rules, procedures, norms and values standardization. Centralization analyzes power concentration or dispersion across the supply
networks. Finally, complexity analyzes three sub-dimensions in the supply network: horizontal complexity, vertical complexity and spatial complexity. This study follows a different orientation. The analysis is based on the degree of integration among manufacturing and other network parts. This integration will lead to knowledge integration and, consequently, capability creation.
– Study Hypothesis
Based on the prior theoretical references presented, we list the four hypotheses below. Two hypotheses (1 and 3) focus on the internal view of the VN, while the other two (2 and 4) discuss the VN’s external aspects. The first two hypotheses analyze the strategic level of manufacturing and marketing integration, evaluating strategic information exchange. We claim that information is the main resource for knowledge integration. The last two analyze operational issues, evaluating manufacturing and marketing integration related to the problem-solving processes.
Hypothesis 1
- The frequency that manufacturing and marketing exchange strategic information is lower comparing to manufacturing exchange with other functional areas.
Hypothesis 2
- Assuming that external environment influence cross-functionality, companies from different industries present asymmetric levels of exchange of strategic information along the VN.
Hypothesis 3
- The frequency that manufacturing and marketing interact in order to solve operational problems is lower comparing to the interaction among manufacturing and other functional areas.
Hypothesis 4
- Assuming that external environment influences cross-functionality, companies from different industries present asymmetric levels of interaction between manufacturing and other functional areas in order to solve problems along the VN.
3. Methodology
We have carried out the research in two steps. The first one was a qualitative study and the second one was a survey, which are discussed bellow.
3.1 Qualitative Analysis - Cases background
With the objective of answering the first questions above, we present three case studies following an exploratory approach.
Company Alpha has its product focus is on manufacturing automation especially for the automotive industry. It presented an expressive increment in its revenues during the last three years (more than 100%). Presently, the main part of its revenues comes from US and Europe. Beta, the second company is a manufacturer of components for agricultural machines and heavy transport equipment. Today, it is expanding its revenues. One important triumph is to become a John Deere’s global supplier. Delta is a strong global competitor in port loading equipment. It bought a German company in order to have access to advanced technologies and it has established agreements with other companies located in countries such as the United States with the objective of expanding its activities.
All the companies identified the sharp focus on specific markets as fundamental for their competitiveness. The integrated management of all parts of the VN is a key aspect for Alpha and Delta companies.
Considering that both companies work with make-to-order production, flexibility and delivery are key aspects. Consequently, a capability related to the VN’s integration is fundamental. On the other hand, Beta produces following mass production logic. To this company, the production system itself is one of the most important parts of the VN in order to achieve the needed cost and quality patterns.
The three companies consider that services are another key aspect in the VN for competitiveness. In any choice - Brazilian or global markets, they believe that their companies need to provide a reliable service within 24-48 hours in any region of the world. The second and the third companies achieve this pattern in their global sales while Alpha provides any type of service in 24 hours in the Brazilian territory.
R&D is also another activity from the VN stressed by all the companies. Alpha and Delta seek to develop commercial agreements in order to access new technologies. Examples include strategic alliances (Alpha), acquisition (Delta) and even sporadic activities (Delta). Beta identifies that its R&D is able to develop suitable products to its clients even without strategic alliances.
The other VN activities were not pointed out as the most important for competitiveness. Just Beta considers the importance of its own production system. Beta and Delta produce internally only what is necessary and sometimes they buy all the components externally. For them, the VN’s key part is the supply chain. From their suppliers, they will be able to provide reliable delivery and product quality.
Therefore, the cases indicated that for Alpha and Delta, internal and external networks along the VN are simultaneously key aspects for competitiveness. On the other hand, Beta having more standardized products stressed preferentially the focus on internal networks.
3.3 Methodology design for the quantitative research
We used a survey methodology to collect the data in order to test the first findings from the case studies. We mailed twice the questionnaires to the sample. We present the results after the second mail. We used a five-scale questionnaire to evaluate managers’ answers. The questions are listed at the end of the article. The steps followed during this research were: (a) framework validation with other researchers and with three companies; (b) first mail of the definitive questionnaire to the chosen sample; and (c) second mail to no responder companies.
3.4 Sample
We sent the questionnaire to 366 companies located in Brazil from food and machines industries. These companies were chosen from Sebrae’s (Brazilian service for companies support) database. All the companies have more than 100 employees. CEOs, vice-presidents, manufacturing directors, and manufacturing
managers answered the quesions. We received 99 valid questionnaires. (Table 2) Table 2 – Return rate for each industry
[inicio] [siguiente] *Fundação Getulio Vargas – EAESP, São Paulo/SP. Email: [email protected]
**Universidade Federal do Rio Grande do Sul, Porto Alegre/RS, Brazil. Email: [email protected]
Vol. 32 (1) 2011
Espacios. Vol. 32 (1) 2011. Pág. 32
Manufacturing integration with R&D and marketing: still a
cross-functional gap?
Integración entre fabricación e I&D: sigue existiendo una brecha entre funciones?
Ely Laureano Paiva y Teniza da Silveira Recibido: 14-04-2010 - Aprobado:
4. Results
4.1 Validity and Reliability Analysis
We performed a Confirmatory Factor Analysis (CFA) in order to verify validity and reliability. Different authors have presented several limitations in the traditional Exploratory Factor Analysis method, such as: some items load simultaneously in the factors analyzed, the correlation of some items is not possible to be explained theoretically, Cronbach’s alpha presents limitations under some circumstances, and
unidimensionality is checked only after the reliability analysis (Heck, 1998; Ahire et al., 2000; Jiang et al., 2000; Das et al., 2000).
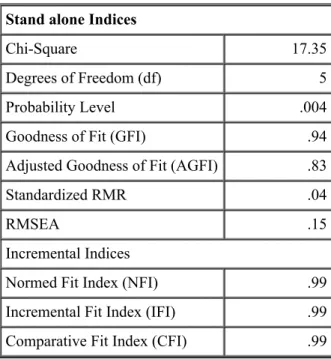
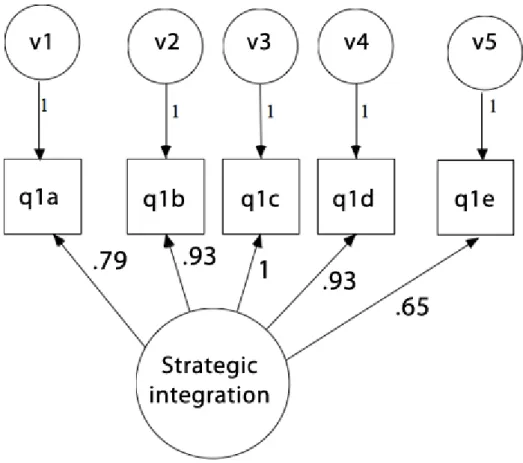
Our analysis is based on three central dimensions: reliability, unidimensionality and convergent validity. We analyzed the constructs through two separate CFA, following a nested approach. According to Burt (1971), this orientation reduces the possibility of a misinterpretation, which can be present in more in complex models. Figures 1 and 2 present the set of items analyzed for the constructs. Figure 1 presents the variables related to Strategic Integration construct. GFI, CFI and NFI present recommendable values (above .97). However, the model presents two aspects that indicate some caution in the construct evaluation: despite chi-square is equal to 16.74, the probability level is significant (.005); also, AGFI and RMSEA are out of the values recommended (.83 and .15). Those results can be related to the relatively small size of the sample (99 cases). Usually, the minimum sample size recommended in this type of analysis is 200 cases (Hair et al., 1998).
Table 3 – General statistics for goodness-of-fit of Figure 1 Stand alone Indices
Chi-Square 17.35
Degrees of Freedom (df) 5
Probability Level .004
Goodness of Fit (GFI) .94
Adjusted Goodness of Fit (AGFI) .83
Standardized RMR .04
RMSEA .15
Incremental Indices
Normed Fit Index (NFI) .99
Incremental Fit Index (IFI) .99
Comparative Fit Index (CFI) .99
Figure 2 analyzes the construct of Problem-solving Integration. In this case, the model shows a Chi-squared equal to 5.74 and the model is not significant (p<.33) as expected (Hair et al., 1998). GFI, AGFI, CFI and NFI also indicate values above .98, as it is recommended (Figure 2). Convergent validity can be assessed through the individual items loading in both the models. The loading varies from .65 to .93 in the first model. At the same time, items loading are from .65 to 1.06 in the second model. Therefore, the two analysis
presented items loading within expected values.
Table 4 – General statistics for goodness-of-fit of the Figure 2 Stand alone Indices
Chi-Square 5.74
Degrees of Freedom (df) 5
Probability Level .33
Goodness of Fit (GFI) .98
Adjusted Goodness of Fit (AGFI) .93
Standardized RMR .03
RMSEA .05
Incremental Indices
Normed Fit Index (NFI) .99
Incremental Fit Index (IFI) 1.00
Comparative Fit Index (CFI) 1.00
Based on the validity and reliability analysis, we may identify the two constructs:
- Construct 1: Strategic Information Integration evaluates the extent that manufacturing is integrated to the other activities in the VN in a strategic approach. This integration takes place through the exchange of strategic information during the process of new products/services development. The variables are: manufacturing/supplier (q1a), manufacturing/R&D (q1b), manufacturing/marketing (q1c),
manufacturing/services (q1d), manufacturing/customers (q1e).
- Construct 2: Problem-solving Integration evaluates the extent that manufacturing is integrated to the other activities in the VN in an operational approach. This integration takes place through cooperative activities in the VN in order to solve existing problems. The variables are: manufacturing/supplier (q2a),
manufacturing/R&D (q2b), manufacturing/marketing (q2c), manufacturing/services (q2d), manufacturing/customers (q2e).
4.1 Strategic Information Exchange Results
Considering capability as a result from knowledge integration, the extent that manufacturing actions are integrated to a specific activity from the VN indicates a high level of integration with this activity. Therefore, capability creation in this case should be a result from an asymmetric effort. On the other hand, whether companies have the first concern to integrate the VN, we expected similar levels of commitment among all the parts of the VN. We used a paired-means analysis and MANOVA to evaluate the manufacturing’s integration with each part of the VN.
The paired-means T test analyzes the Proposition 1 within the samples from each industry. This test is recommendable when we analyze different variables from the same sample (Malhotra, 1999). In this case, we compared indexes for the variable means from each VN’s activity pair by pair. We used an expanded proposal of the VN, including marketing & sales as an original primary activity (Porter, 1986).
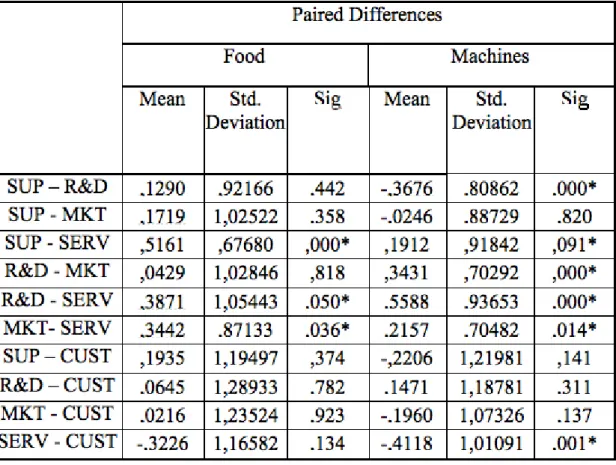
The VN’s parts analyzed were supply (Q1a), R&D (Q1b), marketing & sales ( Q1c), services (Q1d) and customers (Q13e). We evaluate manufacturing’s integration in each one of the VN’s activities, measuring how often manufacturing exchange strategic information with the other VN’s parts. The results presented in the tables below follow two approaches: within the same industry (Tables 5) and cross-industry (Table 6).
The results in the tables 5 and 6 suggest that R&D is a key VN’s activity in the machines industry, comparing with the other VN’s activities such as supply, services and marketing (Table 5).
Table 5 - Paired Samples Test for food industry – Strategic Integration in Food and Machines Industry
Statistically signficant.
On the other hand, this pattern of integration is not identifiable in the food industry. Services seem to deserve a low degree of manufacturing’s integration in both the cases, when we compare it to the other VN´s parts specially in the food industry. This finding suggests that, even service is getting increasing attention as in the three cases presented, this activity does not have received the same level of manufacturing’s commitment comparing to the others VN’s activities in the samples studied. These results confirm the proposition one, indicating asymmetric patterns between manufacturing and other VN´s parts. Specially in machines industry, manufacturing presents higher levels of integration with R&D comparing to other activities.
Table 6 – Manova Test Between-Subjects Effects – Strategic Integration Dependent
Variable MeansFood MachinesMeans Sig.
SUP 3.87 3.67 .342
R&D 3.77 4.01 .270
MKT 3.67 3.67 .982
SERV 3.33 3.46 .550
CUSTOMER 3.64 3.86 .344
In order to test the second proposition, we used a MANOVA test, comparing the levels of manufacturing integration with each VN’s activity in food and machines industries. The test of variance showed that just R&D presents statistically significant differences. Therefore, the sample characteristics allow MANOVA analysis. The results show that machines industry has a greater level of manufacturing’s integration with R&D comparing to food industry even that it is not statistically significant. This result partiality reinforces the idea of capability creation from R&D and manufacturing integration. Therefore, this result does not
The different levels of environmental dynamism between the two industries studied may explain the
asymmetric patterns found in the first analysis. One mature industry, as food, usually presents longer product life cycles comparing to others other more dynamics like machines, especially whether food industry
includes commodities products (for instance, in Brazil includes products like rice, soy and flours). The short product life cycles leads R&D from a position of secondary activity to an increasing insertion as a primary activity in the VN. The opposite occurs in a mature industry. Hayes (2002) describes this situation in the new economy context, when product development is increasingly more important than process development. The results showing a weak focus in the service activities may reveal an overemphasis just in existing
competencies and a potential negligence in other functions or activities, what may weaken companies’ competitiveness in the future.
4.2 Problem-solving Results
Finally, the last propositions related to the manufacturing integration throughout the VN were analyzed through the specific variables. They measure how often manufacturing interact with the others VN partners in order to solve problem. (Q2a, Q2b, Q2c and Q2d). We include also a variable to evaluate the level of interaction between manufacturing and customers (Q2e).
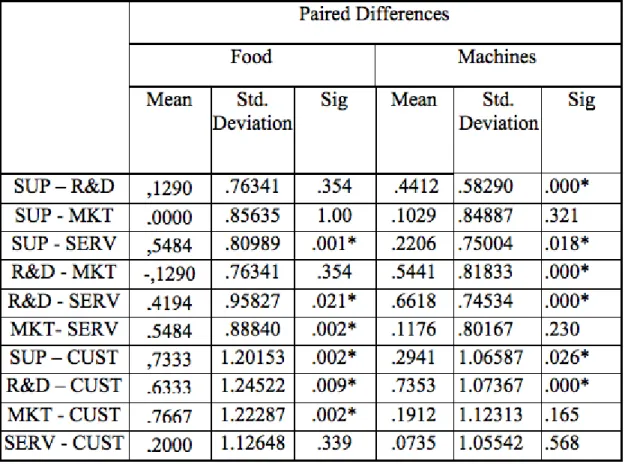
Table 7 - Paired Samples Test for Food and Machines Industry – Opertional Integration in Food and Machines Industr
Statistically signficant.
Comparing the integration patterns in the VN´s activities into each industry and between them, closed results were found. Food industry has the same levels of manufacturing commitment for problem solving in any part of the VN, while machines industry has a clear focus in manufacturing and R&D. At the same time,
manufacturing and marketing is in the same level of integration comparing with the other VN´s parts. A test of variance did not show any difference between the samples’ variables in order to perform a MANOVA analysis. Again, the results suggest that in machines (more dynamic industry), manufacturing and R&D are more integrated comparing to food industry.
Dependent
Variable MeansFood MachinesMeans Sig.
SUP 3.90 3.809 .652 R&D 3.800 4.250 .015* MKT 3.933 3.706 .270 SERV 3.367 3.588 .313 CUSTOMER 3.167 3.515 .136 (*) Statistically significant.
5. Conclusions
Based on the results presented, we may state that there is not a clear evidence that asymetric integration along the VN’s parts or focus in a external or internal part of the VN are the company’s orientation in order to create their capabilities. Therefore, a complementary view between external and internal networks may be more indicated when we analyzed capability creation along the VN. Manufacturing and R&D are highly integrated in more dynamic situations, which indicates the need for constant new products development. Even that manufacturing and marketing integration is considered a key aspect for capability creation,, the results suggest that this is not a priority compared to the levels of integration with other activities from the VN in the sample analyzed. Also, services were not highly integrated to manufacturing and this fact is a potential cause of loss of competitiveness whether these companies keep this orientation. Therefore, although literature have stressed the importance of manufacturing and marketing integration, the results suggest that still there is a lack of integration between these two areas when compared to manufacturing and R&D integration.
A limitation of this study is that the results are based on data from one source in each company, and this can be a source of bias in the results. For further research, we suggest the measurement of the impact of the knowledge integration in the VN on organizational performance what allows to access objectively the competitiveness. Additionally, it can be further investigated what type of managerial approaches such as integrated incentive systems, IT technologies or work teams can be adopted to reduce the lack of integration between manufacturing and marketing. Finally, we consider that the need of exploring
manufacturing/marketing interface and practice is still present.
References
Abernathy, W. J. (1976); “Production Process Structure And Technological Change”, Decision Sciences, 7, 607-619.
Brandenburger, A.M.; Stuart Jr., H.W. (1996); “Value-Based Business Strategy”, Journal of Economics & Management Strategy, 5(1), 5-24.
Choi, T.Y.; Hong, Y. (2002); “Unveiling The Structure of Supply Networks: Case Studies in Honda, Acura, and Daimlerchrysler”, Journal Of Operations Management, 20(5).
Crittenden, V. L. (1992); “Close The Marketing/Manufacturing Gap”, Sloan Management Review, Spring, 33(3), 41-52.
De Toni, A.; Forza, R.F., (1992); “Manufacturing Strategy In Global Markets: An Operations Management Model”, International Journal of Operations & Production Management, 12(4), 7-18.
Fine, C. H. (2000); “Clockspeed-Based Strategies for Supply Chain Design”, Production And Operations Management, 9(3), 213-221.
Ghemawat, P. (2000); Strategy and the Business Landscape; New York; Prentice Hall, 176 p.
Grant, R.M. (1996); “Prospering In Dynamic-Competitive Environments: Organizational Capability As Knowledge Integration”, Organization Science, 7(4), 375-387.
Hayes, R.H. (2002); “Challenges Posed to Operations Management by The New Economy”, Production And Operations Management, 11(1), 21-32.
Hayes, R.H.; Pisano, G.P. (1996); “Manufacturing Strategy: at The Intersection of Two Paradigm Shifts”, Production And Operations Management, 5 (1), 25-41.
Hausman, W.; Montgomery, D.; Roth, A. (2002); “Why Should Marketing and Manufacturing Work Together? Some Exploratory Empirical Results”, Journal Of Operations Management, 20 (3), 241-257. Huang, J.; Newell, S. (2003); “Knowledge Integration Processes and Dynamics within the Context Cross-Functional Projects”, International Journal of Project Management, 21 (3), 167-176.
Hutt, M. D.; Speh, T. W. (1984); “The Marketing Strategy Center: Diagnosing the Industrial Marketer’s Interdisciplinary Role”, Journal of Marketing, 48 (4), 53-61.
Instituto Brasileiro De Geografia e Estatística. 1999, Industrial Data – 97/98.
Kohli, A. K.; Jaworski, B.J. (1990); “Market Orientation: The Construct, Research Propositions, and Managerial Implications”, Journal of Marketing, 54,1-18.
Kohli, A. K.; Jaworski, B. J.; Kumar, A. (1993); “Markor: A Measure Of Market Orientation”, Journal of Marketing Research, 30 (4), 467-477.
Lawrence, P. R.; Lorsch, J. W. (1986); Organization and Environment: Differentiation and Integration; Boston, MA; Harvard Business Press Books, 279 p.
Liebeskind, J.P. (1996); “Knowledge, Strategy, and The Theory of the Firm”, Strategic Management Journal, 17 (Special Issue), 93-107.
Malhotra, N. K. (1999); Marketing Research: An Applied Orientation; Upper Saddle River, NJ; Prentice Hall Inc., 825 p.
Malhotra, M.K. ; Sharms, S. (2002); “Spanning The Continuum Between Marketing And Operations”, Journal Of Operations Management, 20(3), 221-240.
Maltz, E.; Kohli, A. (2000); “Reducing Marketing’s Conflict With Other Functions: The Differential Effects of Integrating Mechanisms”, Journal of The Academy of Marketing Science, 28(4), 479-492.
Mendelson, H.; Pillai, R. R. (1999); “Industry Clokspeed: Measurement and Operational Implications”, Manufacturing & Service Operations Management, 1(1), 1-20.
Narver, J.C.; Slater, S.F. (1990); “The Effect of a Market Orientation on Business Profitability”. Journal of Marketing, 54 (4), 20-35.
Nonaka, I.; Konno, N. (1998); “The Concept Of “Ba”: Building A Foundation for Knowledge Creation”, California Management Review, 40(3), 41-53.
O’Leary-Kelly, S.; Flores, B. (2002); “The Integration of Manufacturing and Marketing/Sales Decision: Impact On Organization Performance”, Journal Of Operations Management, 20(3) 221-240.
Oliver, A. L.; Liebeskind. J. P. (1997); “The Levels of Networking For Sourcing Intellectual Capital in Biotechnology”, International Studies of Management & Organization, 27 (4), 76-103.
Parente, D.H. (1998); “Across the Manufacturing-Marketing Interface: Classification of Significant Research”, International Journal Of Operations And Production Management, 18(12), 1205-1222.
Porter, M. E. (1986); Competitive Advantage; New York, NY; Free Press, 559 p.
Roth, A.; Marucheck, A.S.; Kemp, A.; Trimble, D. (1994); “The Knowledge Factory for Accelerated Learning Practices”, Planning Review, 22 (3), 26-33.
Shapiro, B. P. (1977); “Can Marketing And Manufacturing Coexist?”, Harvard Business Review, 55 (2), .104-114.
Skinner, W. (1969); “Manufacturing - Missing Link In Corporate Strategy”, Harvard Business Review, 47 (3), 5-14.
Slater, S.F.; Narver, J.C. (1994); “Does Competitive Environment Moderate The Market Orientation-Performance Relationship?”, Journal of Marketing, 58 (1), 46-55.
Song, M.; Montoya-Weiss, M.; Schmidt, J. (1997); “Antecedents and Consequences of Cross-Functional Cooperation: A Comparison of R&D, Manufacturing, and Marketing Perspectives”, Journal Of Product Innovation Management, 14 (1), 35-47.
Stalk, G.; Evans, P.; Shulman, L. (1992); “Competing on Capabilities: The New Rules of Corporate Strategy”, Harvard Business Review, 70 (2), 57-69.
Swamidass, P.; Baines, T.;Darlow, N. (2001); “The Role of Manufacturing and Marketing Managers In Strategy Development”, International Journal Of Operational & Production Management, 21(7), 933-948. Swink, M.; Narasimhan, R.; Wang, C. (2007); “Managing Beyond the Factory Walls: Effects of Four Types of Strategic Integration on Manufacturing Plant Performance”, Journal of Operations Management, 25(1), 148-164.
Tapscott, D. (1999), Creating Value In The Network Economy; Boston, MA; Harvard Business Press Books, 288 p.
Teece, D.; Pisano, G.; Shuen. A. (1997); “Dynamic Capabilities and Strategic Management”, Strategic Management Journal, 18(7), 509-533.
Venkatraman, N.; Subramaniam, M. (2001); Theorizing The Future of Strategy: Questions For Shaping Strategy Research in The Knowledge Economy, en: The Handbook of Strategy and Management; London, England; Sage Publications, 461-474.
Viceconti, P.E. (1977), O Processo De Industrialização Brasileira, Revista De Administração De Empresas, Novembro/Dezembro, 1977, P 33-43.
Wheelwright, S.C. (1984); “Manufacturing Strategy: Defining the Missing Link”, Strategic Management Journal, 5 (1), 77-91.
Wheelwright, R.; Hayes. R.H. (1985); “Competing through Manufacturing”, Harvard Business Review, 63 (1), 99-109.
Wise, R.; Baumgartner. P. (1999); “Go Downstream”, Harvard Business Review, 77(5), 133-141.
Zahra, E.; Das, S.R. (1993); “Innovation Strategy and Financial Performance In Manufacturing Companies: An Empirical Study”, Production and Operations Management, 2(1), 15-37.
Itens
Q1a – Indicate how often manufacturing exchange strategic information related to new products or services with Suppliers
Q1b - Indicate how often manufacturing exchange strategic information related to new products or services with R&D
Q1d - Indicate how often manufacturing exchange strategic information related to new products or services with Services
Q1e - Indicate how often manufacturing exchange strategic information related to new products or services with Customers
Q2a - Indicate how often manufacturing develops cooperative activities for problem solving with the Suppliers
Q2b - Indicate how often manufacturing develops cooperative activities for problem solving with the R&D Q2c - Indicate how often manufacturing develops cooperative activities for problem solving with the Marketing and Sales
Q2d - Indicate how often manufacturing develops cooperative activities for problem solving with the Services
Q2e - Indicate how often manufacturing develops cooperative activities for problem solving with the Customers
Scale
Never Rarely Sometimes Frequently Always
1 2 3 4 5
[anterior] [inicio]
Vol. 32 (1) 2011