ORIGINAL PAPERS
© Copyright by Wydawnictwo ContinuoCross-cultural adaptation and validation of the PRISMA-7 scale
for European Portuguese
Luiz MigueL Santiago
1–3, A–G, RaqueL SiLva
1, A, C–F, DeniSe veLho
4, D, E,
ORCID: 0000-0002-9343-2827 ORCID: 0000-0001-6995-6463 ORCID: 0000-0003-1341-1047inêS RoSenDo
1, 2, 5, D–G, JoSé auguSto SiMõeS
2, 4, 5, D–GORCID: 0000-0001-8838-6021 ORCID: 0000-0003-2264-7086
1 Faculty of Medicine, university of Coimbra, Portugal
2 university Clinic of general and Family Medicine, Faculty of Medicine, university of Coimbra, Portugal 3 CEISUC – Centre for Health Studies and Investigation of the University of Coimbra, Portugal
4 Faculty of health Sciences, university of Beira interior, Covilhã, Portugal
5 CinteSiS – Centre for Research in health technologies and Service, Porto, Portugal
A – Study Design, B – Data Collection, C – Statistical Analysis, D – Data Interpretation, E – Manuscript Preparation, F – Literature
Search, G – Funds Collection
Background. Frailty is an age-associated biological syndrome and a predictor of multimorbidity outcomes, whose early
rec-ognition allows for the identification of those older patients at risk. The PRISMA-7 scale allows for the identification of frail older people.
Objectives. To make a cross-cultural adaptation and validation of the PRISMA-7 to the European spoken Portuguese language. Material and methods. Cross-cultural adaptation by translation of the PRISMA-7 scale into European Portuguese, debriefing and
back--translation to English. Application for intra-observer reliability assessment and validation by simultaneous and concurrent application of the Katz scale.
Results. Cronbach’s alpha coefficient was of 0.420 and 0.409 after a re-test. Spearman’s Rank Order Correlation of 0.969 in the re-test
operation in a sample of 64 older people (35 female). More than 3 affirmative answers were found for older people (p < 0.001), for a higher number of self-reported drugs taken, (p = 0.001), self-reported years of education (p = 0.001), higher values for those with less years of studies were found in the validation of the translated PRISMA-7 scale, in a purposive sample of 127 older people, 72 (56.7%) female. No differences were found between gender (p = 0.414) and for number of self-reported diseases (p = 0.258). A Spearman cor-relation of ρ = 0.477 (p < 0.001) between the total of the two scales was found.
Discussion. This comprehensive tool enables health care providers to discuss and architect more effective and efficient measures for
these patients’ care, regardless of gender, socio-demographic factors, number of self-reported drugs taken and diseases.
Conclusions. The PRISMA-7 scale is now recommended to identify frail older people in the Portuguese community. Key words: frailty, frail elderly, disease susceptibility, general practice.
Summary
This is an Open Access article distributed under the terms of the Creative Commons Attribution-NonCommercial-ShareAlike 4.0 International (CC BY-NC-SA 4.0). License (http://creativecommons.org/licenses/by-nc-sa/4.0/).
Santiago LM, Silva R, Velho D, Rosendo I, Simões JA. Cross-cultural adaptation and validation of the PRISMA-7 scale for European Por-tuguese. Fam Med Prim Care Rev 2020; 22(1): 59–66, doi: https://doi.org/10.5114/fmpcr.2020.92507.
Background
The ageing population poses new challenges for health and social care services [1–6]. The increase in life expectancy is inversely associated with healthy life expectancy, implying a longer lifespan with disability and, therefore, increased use of health care, multimorbidity and frailty [2, 7]. The group of frail older people is increasing due to ageing and an increase in life expectancy [6]. A high percentage of emergency patients are frail older patients, and they are the fastest growing group in primary care [6, 8, 9].
Frailty is an age-associated biological syndrome with mul-tisystem down-dysregulation, reduced physiological reserves [7–11] and capacity to maintain homeostasis [1, 12–17], loss of cognitive function [18], functional decline [5, 6], increased risk of being institutionalised [19] and vulnerability to stressors [9–11, 13–15, 20], risk of falls, disability, dependence [4, 18], activity limitations, imminent death, hospitalisation, prolonged recovery and relapse [1, 8, 16, 19, 21–25]. Frail older patients present a long clinical course of disease with intermittent epi-sodes of decline and experiencing a lack of coping strategies when dealing with change and disruptions [2, 19]. Very old patients evaluate their health problems based on impact [26].
Interactions between physiological changes due to ageing, poly-pharmacy, multimorbidity and functional impairment are often complex [21].
Frailty is more prevalent in developing countries and is as-sociated with socio-demographic variables, such as gender and age [14]. The incidence of frailty increases with age, lower edu-cation and income, poor health, multimorbidity and disability and is higher in women and in Afro-Americans [11].
A high percentage of frail older patients suffering from mul-timorbidity and recurrent acute illnesses is treated in special-ised acute care units [5, 6, 8, 21]. After discharge, older patients have a higher risk of mortality, and approximately one-third of older patients experience a loss of independence in self-care ac-tivities, including personal and instrumental activities of daily living, which are related with poor nutrition, loss of sphincter control, and decreased self-care and low mobility during hospi-talisation [18, 21]. Functional decline is associated with worse outcomes of health-related quality of life, less living at home, more re-hospitalisations and higher health costs, which result in the use of more expensive and intensive services and higher mortality [18, 21, 27].
Frailty is a predictor and an outcome of multimorbidity needing to be diagnosed early [1, 23]. Functional status
assess-Family Medicine & Primar
y Car
e R
evie
w 2020; 22(1)
ment in geriatric practice is important for early diagnosis, as it has implications in prognosis, as well as in optimising care, plan-ning interventions and preventing the progression of frailty [17, 18, 23, 28].
Several frailty instruments evaluate weakness, slowness, low physical activity, unintentional weight loss, accumulation of deficits and exhaustion, which are aspects of the clinical pheno-type of frailty that should be diagnosed with no delay [8–10, 13, 14, 16, 21–24, 27].
Comprehensive geriatric assessment, treatment and rehabili-tation is associated with decreased mortality, less functional de-cline at discharge, reduced care needs and a higher probability of living at home [3, 5, 8, 13, 21]. Thus, to adequately prevent hos-pitalisation, we need to study ambulatory older people with an adequate instrument to prevent delay of functional decline [29].
The Program on Research for Integrating Services for the Maintenance of Autonomy (PRISMA) was developed in Canada in 2005 [29]. The PRISMA model includes the PRISMA-7 ques-tionnaire, validated to screen for frailty, which allows services to be adapted to clients’ needs [29, 30]. PRISMA-7 identifies risk factors for functional decline through seven dichotomous items [29, 31].
In the Canadian study, PRISMA-7 had 78% sensitivity and 75% specificity with a cut-off point of three or more positive answers for identification of functional decline in older patients, and 61% sensitivity and 91% specificity with a cut-off point of four or more positive answers [30]. Due to the good perfor-mance of PRISMA-7 in comparison with other frailty assessment instruments, the Royal College of General Practitioners and the British Geriatrics Society recommend PRISMA-7 for frailty iden-tification [29, 31].
The Katz scale is an index of independence in daily life ac-tivities, developed by Sidney Katz, and is one of the mostly used instruments in geriatric evaluation [32]. The scale measures hi-erarchically related activities of daily living and allows for the evaluation of independence in the execution of six daily life functions [32]. The Katz scale allows for the monitoring of the evolution of disability through ageing, as well as of the progno-sis, intervention planning and evaluation of the effectiveness of performed treatments [32].
Daily life activities are influenced by one’s culture and are determined by behaviour, cultural norms and values, making cross-cultural validation of scales important in research [28].
Objectives
This study aims to make the cross-cultural adaptation and validation of the PRISMA-7 scale, assessing its psychometric properties concurrently with another well-known health related scale, the Katz scale.
Material and methods
The study was made in accordance to an health ethics com-mitee aproved protocol.
according to the “Program of Research to integrate Services for the Maintenance of Autonomy (PRISMA)” being over 85 years, being a male, suffering from health limiting problems, needing regular help for daily activities or being restricted at home, need-ing help to move around or to perform daily hygiene are factors to punctuate in a dichotomous instrument, valuing more than three positive answers as frailty. The scale is shown in Table 1.
The study’s first phase was the cross-cultural adaptation to Portuguese language of the PRISMA-7 scale, which was then back-translated from English [30] to European Portuguese. The original English scale consists of seven dichotomous questions, since the intended answer is a yes or no response, as shown in Table 1.
The translation was made by two people, fluent in techni-cal English language, whose mother tongue is Portuguese. This
translation was then retranslated into English by a bilingual Portuguese/English teacher, who did not have any information about the concepts and objectives of the questionnaire. The purpose of the retranslation was to verify the popular use of the source language and to correct any ambiguous meanings of the original questionnaire. A debriefing was then undertaken by three medical doctors to verify the compatibility of the Portu-guese wording to the English original.
Table 1. PRISMA-7 original English version [30]
Questions Answer
Yes No P1: Are you older than 85 years?
P2: Are you male?
P3: In general, do you have any health problems that require you to limit your activities? P4: Do you need someone to help you regularly? P5: In general, do you have any health problems that require you to stay at home?
P6: If you need help, can you count on someone close to you?
P7: Do you regularly use a cane, a walker, or a wheelchair to move about?
□ □ □ □ □ □ □ □ □ □ □ □ □ □
Subsequently, in the second phase of the study, the Portu-guese version of the PRISMA-7 scale was applied in two different moments to evaluate the scale’s intra-observer reliability (test/ /re-test). An epidemiological scale was simultaneously applied in the first moment. Both scales were self-administered, with a guarantee of anonymity and confidentiality after informed consent to persons older than 64 years, of whom 35 were fe-male, selected from the ambulatory care on the island of São Miguel, azores, and in Portugal central mainland in the city of Coimbra. For test/re-test reliability analysis, Chronbach’s alpha coefficient was used, and Spearman’s Rank Order Correlation was used to calculate the strength of the relationship between the results obtained in the two different moments. The Mann– –Whitney U Test was used to test differences between the re-sults obtained in the two different moments, and the chi-square test for Independence was used to explore the relationship be-tween socio-demographic variables [33]. We also performed a study on the level of literacy and the perceptibility of the scale.
The study’s third phase aimed to validate the PRISMA-7 scale with the Katz scale. The questionnaire was applied to 127 older people in the same health units. Simultaneously, an epidemio-logical scale was also self-administered, guaranteeing anonymity and confidentiality after informed consent. For analysis of the results, the Mann–Whitney U Test was used to test for differ-ences between socio-demographic variables and the number of affirmative answers on the PRISMA-7 scale, Pearson’s correlation was used to explore the strength of the relationship between PRISMA-7 and the Katz scale, and the chi-square test for Inde-pendence was used to explore the relationship between socio-demographic variables. A p < 0.001 value was used to address statistical difference [33], and a cut-off value of three affirma-tive answers was defined for study use. The presence of three or more affirmative answers will allow for the diagnosis of frailty.
Results
Study phase 1: The cross-cultural adaptation to Portuguese was made according to the methodology previously described and ended with the results shown in Table 2.
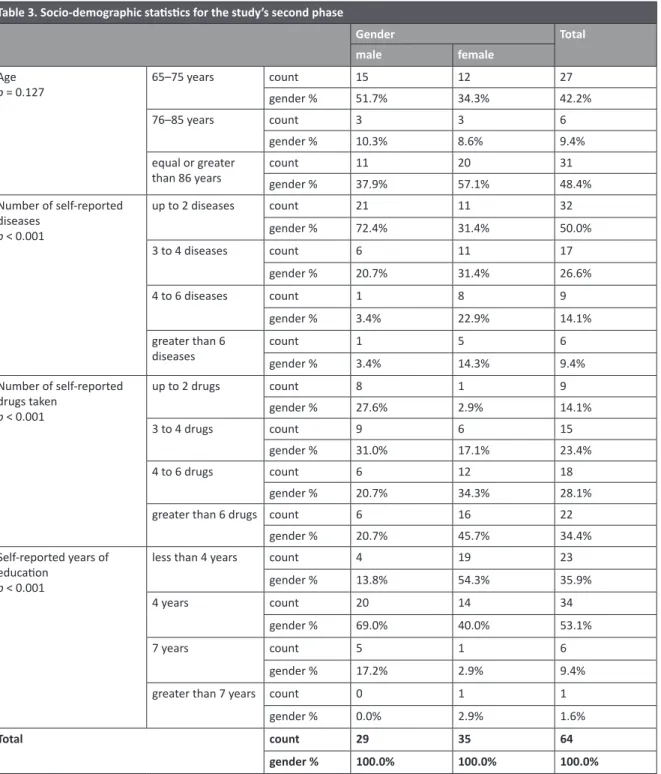
Study phase 2: Table 3 shows the socio-demographic char-acteristics of the purposive phase 2 sample of 64 older people, of whom 35 (54.7%) were female. Women were older than men, reported more simultaneous diseases and medications and had less years of education. These last three items showed a statistical difference.
Family Medicine & Primar
y Car
e R
evie
w 2020; 22(1)
Cronbach’s alpha coefficient, scale mean and variation and cor-rected item total correlation. All items had 64 answers, except for items 1 and 3, which had 63 answers. Item 6 had the low-est scale mean in the tlow-est and the re-tlow-est (1.0938 and 1.1094, respectively). Item 7 had the highest mean in the test and the re-test (1.6563 and 1.6406, respectively). Items 1, 3 and 5 had the lowest difference in the scale variation between test and re-test. Item 6 had the highest difference in the scale variation
Table 2. Translation of PRIMA 7 into Portuguese spoken in Europe
Questões Resposta
Sim Não Tem mais de 85 anos?
É do sexo masculino?
Em geral, tem algum problema de saúde que o/a obrigue a diminuir ou limitar as suas atividades? Precisa da ajuda de alguém regularmente?
Em geral, tem algum problema de saúde que o/a obrigue a ficar em casa? Se precisar de ajuda, tem alguém próximo para o/a ajudar?
Utiliza regularmente bengala, andarilho ou cadeira de rodas?
□ □ □ □ □ □ □ □ □ □ □ □ □ □ Table 3. Socio-demographic statistics for the study’s second phase
Gender Total
male female age
p = 0.127 65–75 years countgender % 1551.7% 1234.3% 2742.2%
76–85 years count 3 3 6
gender % 10.3% 8.6% 9.4%
equal or greater
than 86 years countgender % 1137.9% 2057.1% 3148.4% number of self-reported diseases p < 0.001 up to 2 diseases count 21 11 32 gender % 72.4% 31.4% 50.0% 3 to 4 diseases count 6 11 17 gender % 20.7% 31.4% 26.6% 4 to 6 diseases count 1 8 9 gender % 3.4% 22.9% 14.1% greater than 6
diseases countgender % 13.4% 514.3% 69.4% number of self-reported drugs taken p < 0.001 up to 2 drugs count 8 1 9 gender % 27.6% 2.9% 14.1% 3 to 4 drugs count 9 6 15 gender % 31.0% 17.1% 23.4% 4 to 6 drugs count 6 12 18 gender % 20.7% 34.3% 28.1%
greater than 6 drugs count 6 16 22
gender % 20.7% 45.7% 34.4%
Self-reported years of education
p < 0.001
less than 4 years count 4 19 23
gender % 13.8% 54.3% 35.9%
4 years count 20 14 34
gender % 69.0% 40.0% 53.1%
7 years count 5 1 6
gender % 17.2% 2.9% 9.4%
greater than 7 years count 0 1 1
gender % 0.0% 2.9% 1.6%
Total count 29 35 64
gender % 100.0% 100.0% 100.0%
Table 4 shows the assessment of internal consistency and the strength of the relationship between the results obtained in the two different moments. Cronbach’s alpha coefficient pre-sented a test value of 0.420 and a re-test value of 0.409, and Spearman’s Rank Order Correlation (rho) presented a test value of 1.000 and a re-test value of 0.969.
Table 5 shows the assessment of internal consistency for each item applied in the two different moments, based on
Family Medicine & Primar
y Car
e R
evie
w 2020; 22(1)
in the test and re-test. Cronbach’s alpha coefficient varied be-tween 1.000 and 0.906 (items 1 and 4, respectively).
Perceptibility by the Flesher instrument was 75.11, meaning the scale was relatively easy to understand.
For the study’s third phase, Table 6 shows the socio-demo-graphic characteristics of the purposive sample. We found no differences by gender for the studied variables.
Table 7 shows Katz and PRISMA-7 statistics, class “indepen-dence” being the most frequent (n = 75, 59.1%) for the Katz In-dex. For PRISMA-7, 46 (36.2%) of the respondents had three or more positive answers.
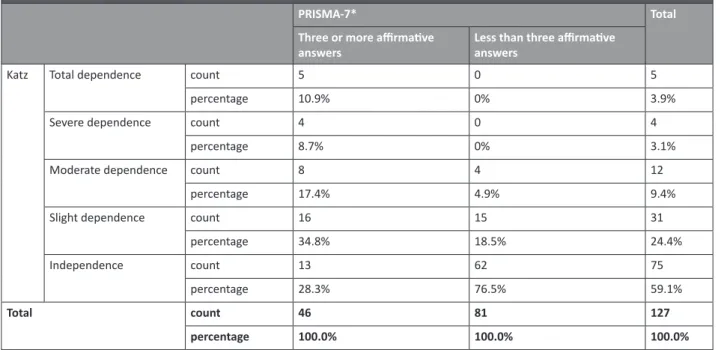
Table 8 shows the distribution of the results on the Katz scale according to the three affirmative answer cut-off on the
Table 4. Test and re-test reliability statistics for the study’s second phase
Test reliability statistics Retest reliability statistics Spearman’s rho in test/re-test Cronbach’s alpha Number of items Cronbach’s alpha Number of items Test Re-test
0.420 7 0.409 7 1.000 0.969
Table 5. Item statistics for the study’s second phase Item Scale mean if item
deleted Scale variance if item deleted Corrected item-total correlation Reliability statisticsCronbach’s alpha Number of items
P1 1.5156 0.254 1.000 1.000 2 P1.1 1.5156 0.254 1.000 P2 1.3906 0.242 0.937 0.968 2 P2.1 1.4219 0.248 0.937 P3 1.2698 0.200 0.919 0.958 2 P3.1 1.2698 0.200 0.919 P4 1.4531 0.252 0.906 0.951 2 P4.1 1.4688 0.253 0.906 P5 1.5000 0.254 0.969 0.984 2 P5.1 1.4844 0.254 0.969 P6 1.0938 0.086 0.918 0.956 2 P6.1 1.1094 0.099 0.918 P7 1.6563 0.229 0.966 0.983 2 P7.1 1.6406 0.234 0.966
Table 6. Socio-demographic statistics for the study’s third phase
Gender Total
male female age
p = 0.360 65–75 years countgender % 2749.1% 3041.7% 5744.9%
76–85 years count 16 22 38
gender % 29.1% 30.6% 29.9%
equal or greater than 86
years countgender % 1221.8% 2027.8% 3225.2% number of self-reported diseases p = 0.192 up to 2 diseases count 24 24 48 gender % 43.6% 33.3% 37.8% 3 to 4 diseases count 19 25 44 gender % 34.5% 34.7% 34.6% 4 to 6 diseases count 6 15 21 gender % 10.9% 20.8% 16.5%
greater than 6 diseases count 6 8 14
gender % 10.9% 11.1% 11.0%
PRISMA-7 frailty scale. We found a statistically significant asso-ciation between the level of dependence and the diagnosis of frailty (p < 0.001). We also found a Spearman’s correlation of ρ = 0.477 (p < 0.001) between the total of the two scales.
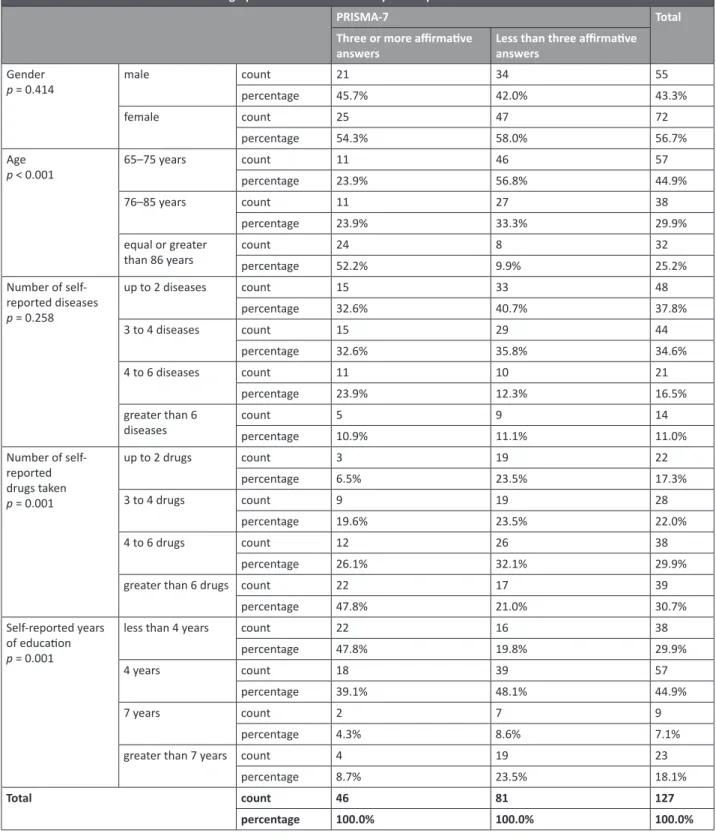
Table 9 shows PRISMA-7 classes and socio-demographic statistics for the study’s third phase. There were more individu-als with less than three affirmative answers (81, 63.8%). In the group of frail individuals (three or more affirmative answers on the PRISMA-7 scale), we found more women (54.3%, ns), more people from the oldest age group (52.2%, p < 0.001), more self-reported multimorbidity, with four or more diseases (34.8%, ns), more self-reported medicines, taking 4 or more drugs (73.9%, ns), and less education, 4 or less years (86.9%, ns).
Family Medicine & Primar
y Car
e R
evie
w 2020; 22(1)
Table 6. Socio-demographic statistics for the study’s third phase
Gender Total male female number of self-reported drugs taken p = 0.946 up to 2 drugs count 10 12 22 gender % 18.2% 16.7% 17.3% 3 to 4 drugs count 13 15 28 gender % 23.6% 20.8% 22.0% 4 to 6 drugs count 14 24 38 gender % 25.5% 33.3% 29.9%
greater than 6 drugs count 18 21 39
gender % 32.7% 29.2% 30.7%
Self-reported years of education
p = 0.004
less than 4 years count 7 31 38
gender % 12.7% 43.1% 29.9%
4 years count 31 26 57
gender % 56.4% 36.1% 44.9%
7 years count 7 2 9
gender % 12.7% 2.8% 7.1%
greater than 7 years count 10 13 23
gender % 18.2% 18.1% 18.1%
Total count 55 72 127
gender % 100.0% 100.0% 100.0%
Table 7. Katz statistics for the study’s third phase
Katz classes Frequency Valid percentage
total dependence 5 3.9% Severe dependence 4 3.1% Moderate dependence 12 9.4% Slight dependence 31 24.4% independence 75 59.1% Prisma 7
Three or more affirmative answers 46 36.2%
Table 8. PRISMA-7 and Katz statistics for the study’s third phase
PRISMA-7* Total
Three or more affirmative
answers Less than three affirmative answers
Katz total dependence count 5 0 5
percentage 10.9% 0% 3.9%
Severe dependence count 4 0 4
percentage 8.7% 0% 3.1%
Moderate dependence count 8 4 12
percentage 17.4% 4.9% 9.4%
Slight dependence count 16 15 31
percentage 34.8% 18.5% 24.4% independence count 13 62 75 percentage 28.3% 76.5% 59.1% Total count 46 81 127 percentage 100.0% 100.0% 100.0% * p < 0.001.
Family Medicine & Primar
y Car
e R
evie
w 2020; 22(1)
Table 9. PRISMA-7 classes and socio-demographic statistics for the study’s third phase
PRISMA-7 Total
Three or more affirmative
answers Less than three affirmative answers gender
p = 0.414 male countpercentage 2145.7% 3442.0% 5543.3%
female count 25 47 72
percentage 54.3% 58.0% 56.7%
age
p < 0.001 65–75 years countpercentage 1123.9% 56.8%46 5744.9%
76–85 years count 11 27 38
percentage 23.9% 33.3% 29.9%
equal or greater
than 86 years countpercentage 2452.2% 89.9% 3225.2% number of self-reported diseases p = 0.258 up to 2 diseases count 15 33 48 percentage 32.6% 40.7% 37.8% 3 to 4 diseases count 15 29 44 percentage 32.6% 35.8% 34.6% 4 to 6 diseases count 11 10 21 percentage 23.9% 12.3% 16.5% greater than 6
diseases countpercentage 510.9% 911.1% 1411.0%
number of self-reported drugs taken p = 0.001 up to 2 drugs count 3 19 22 percentage 6.5% 23.5% 17.3% 3 to 4 drugs count 9 19 28 percentage 19.6% 23.5% 22.0% 4 to 6 drugs count 12 26 38 percentage 26.1% 32.1% 29.9%
greater than 6 drugs count 22 17 39
percentage 47.8% 21.0% 30.7%
Self-reported years of education
p = 0.001
less than 4 years count 22 16 38
percentage 47.8% 19.8% 29.9%
4 years count 18 39 57
percentage 39.1% 48.1% 44.9%
7 years count 2 7 9
percentage 4.3% 8.6% 7.1%
greater than 7 years count 4 19 23
percentage 8.7% 23.5% 18.1%
Total count 46 81 127
percentage 100.0% 100.0% 100.0%
Discussion
According to prior studies for cross-cultural adaptation and validation, the internal consistency assessed by Cronbach’s alpha showed a borderline value, probably because of the length of the questionnaire. It should be highlighted that this scale is more of an objective matrix registry than a scale measuring intrinsic variable subjective values about someone’s opinion on a subject. In the evaluation of the internal consistency of the test, Se-anger et al. [29] obtained a Cronbach’s alpha coefficient value of 0.619, which is higher than that obtained in this study (Cron-bach’s alpha coefficient of 0.420). This difference may be due to differences in sample size and intrinsic characteristics. The study of Seanger et al. [29] does not present the value of the Cronbach’s alpha coefficient for the re-test.
This is a valid European Portuguese version of the PRISMA-7 scale, which is easy to understand.
in the second phase of the study, the Cronbach’s alpha co-efficient denotes internal consistency and reliability, and the Spearman’s Rank Order Correlation indicates a positive associa-tion between the results obtained in the test and re-test of the translation of the PRISMA-7 scale.
in the third phase of the study, most of the older people in-terviewed were aged between 65 and 75 years and had 4 years or less of education. The high number of self-reported drugs taken daily reflected the health status of older people that ac-cess primary health care services.
The identification of frail older people with the PRISMA-7 scale was, significantly, in accordance with the classification of functionality of the Katz scale, since, for dependency
classifica-Family Medicine & Primar
y Car
e R
evie
w 2020; 22(1)
tions on the Katz scale, there was a higher number of individuals with three or more affirmative answers on the PRISMA-7 scale, and simultaneously, for the independence classification on Katz scale, there was a higher number of individuals with less than three affirmative answers on the PRISMA-7 scale.
In both genders, there were similar percentages of three or more affirmative responses, indicating that the PRISMA-7 scale allows for the identification of frail older people regardless of gender.
The PRISMA-7 scale was sensitive to the socio-demographic factors: an increase in age and in the number of self-reported drugs taken daily was associated with an increase in the num-ber of individuals with three or more affirmative answers; a de-crease in the number of self-reported diseases was associated with a decrease in the number of individuals with three or more affirmative answers; and an increase in the number of years of education was associated with a decrease in the number of in-dividuals with 3 or more affirmative answers.
As in the study of Seanger et al. [29], the sample of this study had a diversity of socio-demographic characteristics, al-lowing for the evaluation of its applicability in different age groups.
For the PRISMA-7 class of three or more affirmative an-swers, Seanger et al. [29] obtained a higher percentage of indi-viduals in the age group of 60 to 74 years, while in the present study, the age group with the highest percentage was equal or higher than the age group of 86 years. This may be due to differ-ences in cultural characteristics and the time lapse between the two studies. For educational level and gender, both papers pres-ent a higher percpres-entage of individuals of the female gender and in the group with less than 4 years of education. These results are in accordance with the risk of greater frailty in these groups.
The results indicate that the PRISMA-7 scale has the sensi-tivity to detect people between the ages of 65 and 85 at risk of frailty, and thus it can be used to identify people at risk of frailty early in this age group, widening the target population for which it is intended. In this way, it will allow the timely implementation of health services with the aim of preventing the emergence of fragility syndrome, contributing to the improvement of qual-ity of life and increased independence, which will consequently contribute to the reduction of consumption and expenditures of health services.
The PRISMA-7 scale, being specific for the identification of fragility syndrome, may be an important tool for the follow-up, prognosis and evaluation of the effectiveness of the treatments provided.
In the presence of fragility syndrome, it would be pertinent to verify if the PRISMA-7 scale would also be a useful tool to evaluate caregivers’ perceptions of a person’s frailty. Knowledge of caregivers’ perceptions could contribute to early identifica-tion of the need for community service support.
Conclusions
The PRISMA-7 scale has been adapted and validated to the European spoken Portuguese language. The results of this study suggest the adequacy of the validation process and the effec-tiveness in early identification of frail older patients. The PRIS-MA-7 version for European Portuguese is a simple, easy to apply and reliable tool for discovering and implementing preventive and rehabilitation health services for frail older people. There-fore, it is recommended as a tool to identify frail older people in the community.
Source of funding: This work was funded from the authors’ own resources. Conflicts of interest: The authors declare no conflicts of interest.
References
1. Bieniek J, Wilczyński K, Szewieczek J. Fried frailty phenotype assessment components as applied to geriatric inpatients. Clin Interv
Age-ing 2016; 11: 453–459, doi: 10.2147/CIA.S101369.
2. Bone AE, Morgan M, Maddocks M, et al. Developing a model of short-term integrated palliative and supportive care for frail older people in community settings: perspectives of older people, carers and other key stakeholders. Age Ageing 2016; 45(6): 863–873, doi: 10.1093/ageing/afw124.
3. Bowman C, Meyer J. Formative care: defining the purpose and clinical practice of care for the frail. J R Soc Med 2014; 107(3): 95–98, doi: 10.1177/0141076813512298.
4. Khezrian M, Myint PK, McNeil C, et al. A review of frailty syndrome and its physical, cognitive and emotional domains in the older people. Geriatrics 2017; 2(4): 36, doi: 10.3390/geriatrics2040036.
5. Mazya AL, Garvin P, Ekdahl AW. Outpatient comprehensive geriatric assessment: effects on frailty and mortality in old people with multimorbidity and high health care utilization. Ageing Clin Exp Res 2019; 31(4): 519–525, doi: 10.1007/s40520-018-1004-z.
6. Muntinga ME, Van Leeuwen KM, Schellevis FG, et al. From concept to content: assessing the implementation fidelity of a chronic care model for frail, older people who live at home. BMC Health Serv Res 2015; 15: 18, doi: 10.1186/s12913-014-0662-6.
7. Comans TA, Peel NM, Hubbard RE, et al. The increase in healthcare costs associated with frailty in older people discharged to a post acute transition care program. Age Ageing 2016; 45(2): 317–320, doi: 10.1093/ageing/afv196.
8. Ekerstad N, Karlson BW, Ivanoff SD, et al. Is the acute care of frail older people patients in a comprehensive geriatric assessment unit superior to conventional acute medical care? Clin Interv Ageing 2017; 12: 1–9, doi: 10.2147/CIA.S124003.
9. Lim WS, Wong SF, Leong I, et al. Forging a frailty-ready healthcare system to meet population ageing. Int J Environ Res Public Health 2017; 14: 1448, doi: 10.3390/ijerph14121448.
10. Yang F, Gu D. Predictability of frailty index and its components on mortality in older adults in china. BMC Geriatr 2016; 16: 145, doi: 10.1186/s12877-016-0317-z.
11. Yeolekar ME, Sukumaran S. Frailty syndrome: a review. J Assoc Physicians India 2014; 62: 34–38.
12. Aarts S, Patel KV, Garcia ME, et al. Co-presence of multimorbidity and disability with frailty: an examination of heterogeneity in the frail older population. J Frailty Ageing 2015; 4(3): 131–138, doi: 10.14283/jfa.2015.45.
13. Chen X, Mao G, Leng SX. Frailty syndrome: an overview. Clin Interv Ageing 2014; 9: 433–441, doi: 10.2147/CIA.S45300.
14. Grden CRB, Lenardt MH, Sousa JAV, et al. Associations between frailty syndrome and sociodemographic characteristics in long-lived individuals of a community. Rev Lat Am Enfermagem 2017; 25: e2886, doi: 10.1590/1518-8345.1770.2886.
15. Lourenço RA. [Fragility syndrome in the older people: clinical and biological markers]. Revista HUPE 2008; 7(1): 21–29 (in Portuguese). 16. Sousa-Santos AR, Afonso C, Moreira P, et al. Weakness: the most frequent criterion among pre-frail and frail older Portuguese. Arch
Family Medicine & Primar
y Car
e R
evie
w 2020; 22(1)
17. Wen YC, Chen LK, Hsiao FY. Predicting mortality and hospitalization of older adults by the multimorbidity frailty index. PLoS ONE 2017; 12(11): e0187825, doi: 10.1371/journal.pone.0187825.
18. Pritchard JM, Kennedy CC, Karampatos S, et al. Measuring frailty in clinical practice: a comparison of physical frailty assessment meth-ods in a geriatric out-patient clinic. BMC Geriatr 2017; 17(1): 264, doi: 10.1186/s12877-017-0623-0.
19. Brouwers C, Merten H, Willems M, et al. Improving care for older patients in the acute setting: a qualitative study with healthcare providers. Neth J Med 2017; 75(8): 335–344.
20. Buta BJ, Walston JD, Godino JG, et al. Frailty assessment instruments: systematic characterization of the uses and contexts of highly-cited instruments. Ageing Res Rev 2016; 26: 53–61, doi: 10.1016/j.arr.2015.12.003.
21. Ekerstad N, Ivanoff SD, Landahl S, et al. Acute care of severely frail older people patients in a CGA-unit is associated with less functional decline than conventional acute care. Clin Interv Ageing 2017; 12: 1239–1249, doi: 10.2147/CIA.S139230.
22. Fried LP, Tangen CM, Walstom J, et al. Frailty in older adults: evidence for phenotype. J Gerontol A Biol Sci Med Sci 2001; 56(3): M146– –M156, doi: 10.1093/gerona/56.3.m146.
23. Hanlon P, Nicholl BI, Jani BD, et al. Frailty and pre-frailty in middle-aged and older adults and its association with multimorbidity and mortality: a prospective analysis of 493 737 UK biobank participants. Lancet Public Health 2018; 3(7): e323–e332, doi: 10.1016/S2468-2667(18)30091-4.
24. Lana LD, Schneider RH. [The frailty syndrome in older people: a narrative review]. Rev Bras Geriatr Gerontol 2014; 17(3): 673–680, doi: 10.1590/1809-9823.2014.12162 (in Portuguese).
25. Schoenborn NL, Rasmussen SEVP, Xue QL, et al. Older adults’ perceptions and informational needs regarding frailty. BMC Geriatr 2018; 18: 46, doi: 10.1186/s12877-018-0741-3.
26. Münzer T. Medical challenges at the end of the first ten decades of life. Swiss Med Wkly 2017; 147: w14461, doi: 10.4414/ smw.2017.14461.
27. Duarte M, Paúl C. Prevalence of phenotypic frailty during the ageing process in a Portuguese community. Rev Bras Geriatr Gerontol 2015; 18(4): 871–880, doi: 10.1590/1809-9823.2015.14160.
28. Arik G, Varan HD, Yavuz BB, et al. Validation of Katz index of independence in activities of daily living in Turkish older adults. Arch
Gerontol Geriatr 2015; 61(3): 344–350, doi: 10.1016/j.archger.2015.08.019.
29. Saenger ALF, Caldas CP, Raîche M, et al. Identifying the loss of functional independence of older people residing in the community: Validation of the PRISMA-7 instrument in Brazil. Arch Gerontol Geriatr 2018; 74: 62–67, doi: 10.1016/j.archger.2017.09.008.
30. Hébert R, Durand PJ, Dubuc N, et al. Frail older people patients, new model for integrated service delivery. Can Fam Physician 2003; 49: 992–997.
31. Saenger ALF, Caldas CP, Mota LB. [Cross-cultural adaptation of the PRISMA-7 instrument for use in Brazil: evaluation of conceptual, item, and semantic equivalences]. Cad Saúde Publica 2016; 32(9): e00072015, doi: 10.1590/0102-311X00072015 (in Portuguese). 32. Duarte YAO, Andrade CL, Lebrão ML. [Katz Index on older people functionality evaluation]. Rev Esc Enferm USP 2007; 42(2): 317–325,
doi: 10.1590/S0080-62342007000200021 (in Portuguese).
33. Pallant J. SPSS Survival Manual: a step by step guide to data analysis using SPSS. Philadelphia: Open University Press; 2005. Tables: 9 Figures: 0 References: 33 Received: 23.06.2019 Reviewed: 27.06.2019 Accepted: 12.09.2019 address for correspondence:
Luiz Miguel Santiago, MD, PhD, Assoc. Prof. Faculdade de Medicina da universidade de Coimbra Azinhaga de Santa Comba (Celas)
3000-548 Coimbra Portugal
Tel.: +351 966225773
![Table 1. PRISMA-7 original English version [30]](https://thumb-eu.123doks.com/thumbv2/123dok_br/18144322.871326/2.884.456.800.238.461/table-prisma-original-english-version.webp)