SPACE
-
TIME DEPENDENCE OF JATROPHA GROWTH PARAMETERS GROWN
IN BRAZILIAN SEMIARID
1ANDRÉ QUINTÃO DE ALMEIDA2*, RODOLFO MARCONDES SILVA SOUZA3, SÉRVULO MERCIER SIQUEIRA
E SILVA4, IVAN SOUTO DE OLIVEIRA JUNIOR5, FARNÉSIO DE SOUSA CAVALCANTE5, JOSÉ ALISON DA
SILVA MELO6
ABSTRACT- Jatropha has emerged as a source of power generation in the semiarid region of Brazil. The objective of this study was to evaluate, using geostatistics, the spatial variability of stem diameter, plant height
and seed weight of jatropha (Jatropha curcas L.) grown under rain fed conditions in Serra Talhada,
Pernambuco state, Brazil. At 545, 905 and 1265 days after sowing (DAS), the stem diameter and plant height of 340 plants were measured with a digital caliper and a tape measure. At 545 DAS, the fruits of 306 plants were collected, the seeds extracted and their weights measured with a precision balance. For each date analyzed, the spatial dependence of the plant characteristics was evaluated from the adjustment of the experimental semivariogram. The spherical model was adjusted for modeling the spatial distribution of cultural parameters. The range of plant height reduced by an average of 37% from 545 DAS when compared to 905 and 1265 DAS, while for the stem diameter this parameter remained practically constant. Geostatistics can be employed to assist in future sampling and to identify areas with different patterns that can occur in the jatropha planting.
Keywords: Geoestatística. Krigagem. Jatropha curcas L. Bioenergia.
DEPENDÊNCIA ESPAÇO-TEMPORAL DOS PARÂMETROS DE CRESCIMENTO DO PINHÃO-MANSO CULTIVADO NO SEMIÁRIDO PERNAMBUCANO
RESUMO - O pinhão-manso vem se destacando como fonte de geração de energia na região Semiárida do Brasil. O objetivo deste trabalho foi avaliar, a partir de técnicas geoestatísticas, a variabilidade espacial do
diâmetro caulinar da altura de planta e do peso das sementes de pinhão-manso (Jatropha curcas L.) cultivado
em condições de sequeiro no município de Serra Talhada-PE. Aos 545, 905 e 1265 dias após a semeadura
(DAS), o diâmetro do caule e a altura de 340 plantas foram medidos com um paquímetro digital e uma trena. Aos 545 DAS, os frutos de 306 plantas foram coletados, as sementes extraídas e os respectivos pesos medidos com uma balança de precisão. Para cada data analisada, foi avaliada a dependência espacial das características das plantas, a partir do ajuste do semivariograma experimental. O modelo esférico foi adequado para modelar a distribuição espacial dos parâmetros da cultura. O alcance da altura de planta reduziu em média 37% a partir 545 DAS quando comparado aos 905 e 1265 DAS, enquanto que, para o diâmetro caulinar esse parâmetro permaneceu praticamente constante. A geoestatística pode ser empregada para auxiliar em futuras amostragens
e identificar áreas com diferentes padrões que podem ocorrer no plantio de pinhão-manso.
Palavras-chave: Geostatistics. Kriging. Jatropha curcas L. Bioenergy.
__________________ *Corresponding Author
1Received for publication in 04/22/2015; accepted in 01/21/2016.
2Department of Agricultural Enginering, Universidade Federal de Sergipe, São Cristóvão, SE, Brazil; [email protected]. 3Department of Nuclear Energy, Universidade Federal de Pernambuco, Recife, PE, Brazil; [email protected]. 4Station Experimetal of Arcoverde, Instituto Agronômico de Pernambuco, Arcoverde, PE, Brazil; [email protected].
5Station Experimetal of Caruaru, Instituto Agronômico de Pernambuco, Caruaru, PE, Brazil; [email protected], [email protected].
Rev. Caatinga
INTRODUCTION
Some forecasts estimate that oil reserves are likely to be exhausted within 40 years (CARNIELLI, 2003). With this possible oil shortage, alternative and renewable energy sources have been investigated in various parts of the world. In Brazil, a country with tropical climate, there are several renewable energy sources, with emphasis to those of vegetable origin.
In the Northeastern region of Brazil, jatropha (Jatropha curcas L.) has presented great potential for energy production (DRUMOND et al., 2010), without competing with food production. It is a perennial and monoecious species that belongs to the Euphorbiaceae family. Its origin is not known, but is believed to have originated in Central America; however, it adapts well in several regions of Brazil (PEIXOTO, 1973). Jatropha has stood out for the high oil content, which can be used in biodiesel production, being raw material for manufacturing various products, such as the manufacturing industry of paints, oils, varnishes and cicatrizers from its latex (RATREE, 2004). It takes three to four years to reach productive age, which can span up to 40 years (SUJATHA et al., 2009; MARTINS et al., 2010).
Several studies are being conducted in order to evaluate the productive capacity of jatropha in Brazil (HORSCHUTZ et al., 2012; SIQUEIRA et al., 2012; VERAS et al., 2011; NERY et al., 2009; NERY et al., 2013). Despite the species great production potential in the country semiarid region (DRUMOND et al., 2010), the lack of research results on its cultivation is still great, especially in relation to the spatial dependence of its growth characteristics, such as stem diameter and plant height. Knowledge of the plants’ characteristics is related to crop management, pest control, liming practices, foliar and soil fertilization, among others (VIEIRA, 2009). Grego et al. (2005) reported that the knowledge on the variability of crop attributes in space and time is currently considered the basic principle for precise management of agricultural areas, regardless of their scale.
Geostatistics measures the spatial correlation among variables throughout geographic space by adjusting the theoretical model to an experimental semivariogram. From the semivariogram parameters (i.e., range, sill and nugget effect) and the geostatistical interpolator as kriging, it is possible to estimate the variables measured at unsampled locations (MENG et al., 2009). Thus, geostatistics is an important tool in estimating biometric plant features, being able to help in crop management with
efficiency and at a low cost (SOUZA et al., 2015). Based on this information, the objective of this study was to evaluate the spatial variability of the stem diameter, plant height and seed weight of jatropha grown under rain fed conditions in Serra
Talhada-PE, Brazil.
MATERIAL AND METHODS
The study was conducted at the Lauro Bezerra Ramos Experimental Station of the
Agronomic Institute of Pernambuco - IPA, located in
Serra Talhada, in the Pernambuco semiarid, whose
coordinates are 07º 56’ 58” S, 38º 17’ 41” W and
altitude of 506 m (Figure 1). The soil is of the Cambisol type, with flat topography and sandy texture. The climate is of the BSwh' type, according to Koppen’s classification, and according to the Department of Atmospheric Sciences of the Federal
University of Campina Grande (UFCG-DCA, 2013),
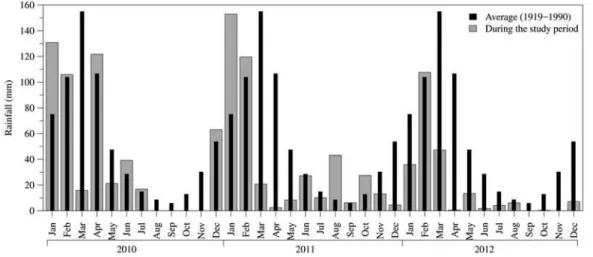
the annual rainfall is 642 mm and the highest values occur between January and March. The distribution of monthly rainfall occurred during the study period (gray bars), as well as the historical average (black bars) of the Serra Talhada meteorological station is shown in Figure 2.
The jatropha (Jatropha curcas L.) plantation
consisted of 20 lines with 17 plants, totaling 340 units (Figure 1). Sowing was held in February 2009, with spacing of (4.0 x 2.0) m, totaling a floor area of
2,720 m2. During the first two years, hoeing was
performed at planting lines, with the aim of controlling the presence of weeds.
The plants were georeferenced by a geodetic GPS brand FOIF model A20. The coordinate system associated was the Universal Transverse Mercator (UTM), Datum SIRGAS 2000 zone 23 S.
In the eighth month of 2010, at 545 days after sowing (DAS), the fruits of 272 plants were harvested manually, on a single collection day. Subsequently, all fruits were peeled and seeds extracted. Immediately after extraction and drying in an oven for 48 hours at 65° C, the dry weight (W) of seeds from each plant was determined on a precision scale (0.01 g).
Figure 1. Study area location and jatropha planting sketch.
The growth parameters (SD and H) in the three different dates (545, 905 and 1265 days after sowing) and fruit seed weight of (at 545 days after sowing) were evaluated by average, maximum and minimum values, standard deviation and coefficient of variation (CV). The variability was classified by
means of CV values, according to Pimentel-Gomes
& Garcia (2002), as low (CV < 10%), medium (10% < CV <20%), high (20% < CV < 30%) and very high (CV > 30%). The data normality hypothesis was
evaluated using the Kolmogorov-Smirnov test.
Figure 2.Distribution of the historical monthly average rainfall (1919-1990) and of the period of study located in Serra Talhada, PE, Brazil.
The adjustment of theoretical semivariogram models was performed by the method of weighted least squares, in which previously the performance of the three semivariogram models was evaluated: spherical, exponential and gaussian, set by equations 1, 2, 3 and 4.
𝛾 ℎ =C0+C 1,5 ℎ 𝐴 −0,5
ℎ 𝐴
3
,0<h<A (1)
𝛾 ℎ =C0+C 1− 𝑒 −ℎ
𝐴 ,0<h<A (2)
𝛾 ℎ =C0+C 1− 𝑒 −ℎ2
𝐴2 ,0<h<A (3)
𝛾 ℎ =C0+C,h>A (4)
wherein: C0 is the nugget, C the variance
dispersion, C0 + C the sill, R the range (m).
The choice between the three adjusted models was made by means of Jack Knifing test, which evaluates the consistency of the data estimated by
kriging interpolator based on adjusted
semivariograms (experimental). In the Jack Knifing
test, the values at each of the points observed (Z(xi))
are removed one by one and a new value is estimated (Z*(x
i)) for each point using the semivariogram
Rev. Caatinga
RE 𝑥𝑖 = 𝑍
* 𝑥
𝑖 − 𝑍 𝑥𝑖
𝜎𝑘 𝑥𝑖
(5)
wherein: σk (xi) is the square root of the
estimation variance.
According to Vieira et al. (2010), the kriging
condition with no trends requires the means (µjk) and
variance (σjk) of the reduced error to be respectively zero and one. Thus, the semivariogram model, among the three adjusted models, was the one which
showed µjk and σjk closer to zero and one,
respectively, and was chosen for kriging interpolation and result presentation.
The spatial dependence degree (SDD) was calculated from the ratio in percentage between the
nugget effect (C0) and the sill, given by the sum of
the nugget effect and structured variation (C), according to equation 6:
SDD(%) =100 𝐶0
C+C0
(6)
package (Ribeiro Júnior and Diggle, 2015), for the geostatistics analysis.
RESULTS AND DISCUSSION
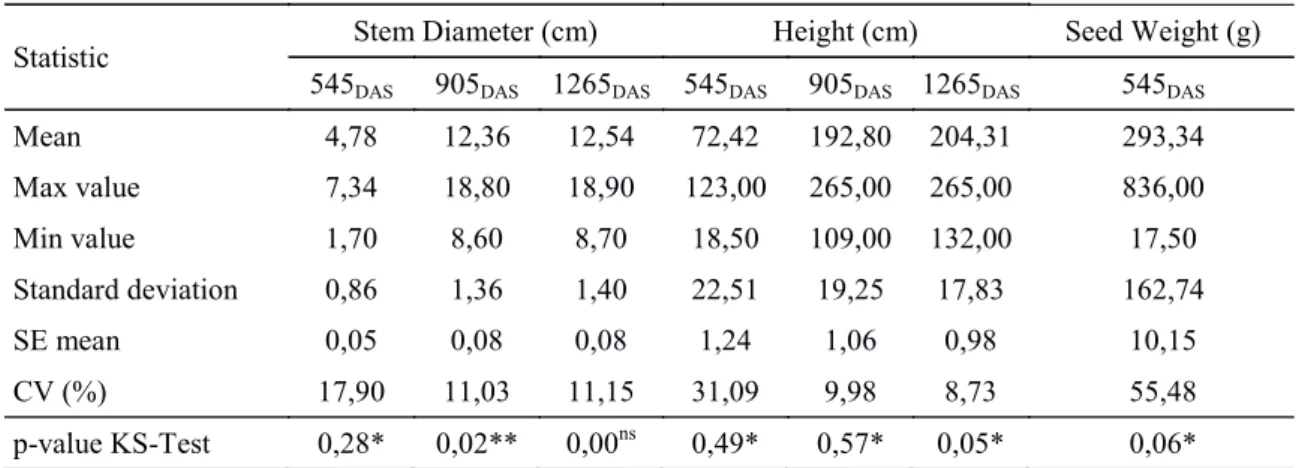
The statistical analysis results are presented in
Table 1, besides the coefficients of the Kolmogorov
-Smirnov test. The normal data distribution was confirmed for all stem diameter assessments (SD), height (H) and seed weight (SW), except for the SD at 1265 DAS. Data normality ensures optimal statistical properties, such as maximum likelihood (Diggle; Ribeiro Junior, 2007).
The average stem diameter and plant height values were similar to those found in other studies conducted in the semiarid region of Brazil (DRUMOND et al., 2010). The two culture parameters showed similar behavior over time, increasing values and decreasing variability.
The average plant height (204.31 cm) at 1265 DAS was close to the value found by Laviola & Dias
(2008) in a jatropha plantation located in Viçosa
-MG. According to Arruda et al. (2004), the Jatropha plant presents fast growth, reaching a height of two to three meters when mature, being able to reach up to five meters. As occurred in other studies, there was a standstill of growth in plant height, with maximum values (265 cm) similar at 905 and 1265 days after sowing.
The SDD classification was conducted in accordance with Cambardella et al. (1994) as: high spatial dependence degree (SDD <25%); medium spatial dependence degree (25% ≤ SDD ≤ 75%) and low spatial dependence degree (SDD > 75%).
All the analysis, as well as the generation of charts and maps were made with software R 3.1.0 (R Development Core Team, 2014), using the geoR
Table 1. Characterization of stem diameter and height at 545, 905 and 1265 days after sowing (DAS) and of seed weight (545 DAS) of a jatropha plantation cultivated in the Brazilian semiarid region.
Statistic Stem Diameter (cm) Height (cm) Seed Weight (g)
545DAS 905DAS 1265DAS 545DAS 905DAS 1265DAS 545DAS
Mean 4,78 12,36 12,54 72,42 192,80 204,31 293,34
Max value 7,34 18,80 18,90 123,00 265,00 265,00 836,00
Min value 1,70 8,60 8,70 18,50 109,00 132,00 17,50
Standard deviation 0,86 1,36 1,40 22,51 19,25 17,83 162,74
SE mean 0,05 0,08 0,08 1,24 1,06 0,98 10,15
CV (%) 17,90 11,03 11,15 31,09 9,98 8,73 55,48
p-value KS-Test 0,28* 0,02** 0,00ns 0,49* 0,57* 0,05* 0,06*
KS-Test - Kolmogorov-Smirnov test. *Normal Distribution at 5% probability. **Normal Distribution at 1%
probability. ns No normal distribution.
In the years 2011 and 2012, the smallest CV values of dendrometric planting characteristics were found. The stem diameter CV fell below 10% in the years 2011 and 2012. According to the criteria
established by Pimentel-Gomes & Garcia (2002), it
presents low variability. While the plant height with
Even cultivated under rain fed condition (subject to water stress), the plantation growth dynamics was similar to those grown with higher water availability (SILVA et al., 2009; DRUMOND et al., 2010). This indicates that the region has great potential for the cultivation of the species.
Typically, jatropha seeds represent between 53 and 79% of fruit weight (DIAS et al., 2007). The average seed weight per plant was approximately 293.34 g (Table 1). The seed weight variability found in this study is similar to that found by Nery et al. (2013) when evaluating the dry average weight of
jatropha seeds irrigated with saline water.
Table 2 shows the parameters for the semivariograms adjusted for the variables analyzed. The nugget effect accounted for over 50% of the threshold and consequently the SDD was rated as medium dependency. Cambardella et al. (1994), when studying the soil variability in field scale, associated strong spatial dependence to intrinsic soil parameters which are related to texture and mineralogy, while extrinsic factors such as cultivation and fertilizer application are associated with poor spatial dependence.
Table 2. Semivariograms adjusting parameters for the variables stem diameter (SD) and height (H) at 545, 905 and 1265 days after sowing (DAS) and seed weight (W) (545 DAS) of a jatropha plantation grown in the Northeast semiarid.
C0- Nugget effect; C - Structured variation; R - Range; SDD - Spatial dependence degree; µjk and σjk- Mean and reduced error variance obtained by the Jack Knifing test, respectively.
Figures 3 and 4A show the semivariograms adjusted to the theoretical models that better described the spatial variability behavior of growth and production variables. In order to standardize the semi variance for a better visual comparison of the DAS, the semivariances shown in Figures 3 and 4A were normalized by dividing the semi variance by the variance of each variable. The degree of spatial dependence, taking into account all the variables and years analyzed, ranged from 30.65 to 62.03% and was classified as medium in accordance with the criteria established by Cambardella et al. (1994, p. 1509). These results are superior to those found by Lima et al. (2010), where the SDD was lower than 24.3% for exponential and gaussian semivariogram models. The SDD variation is dependent on various factors such as the variable studied, the planting age and the adjusted semivariogram model. With respect to the Jack Knifing test (Table 2), it was found that the reduced error showed average values sufficiently close to zero and variance with values between 1.014 and 1.072, indicating that the spherical
semivariogram model adequately represented the distribution of the planting dendrometric features and jatropha seed weight.
Applying geostatistics in commercial eucalyptus plantation, Souza et al. (2015) also identified the spherical model as the one that best modeled the spatial variability of the eucalyptus dendrometric variables. Overall, there was respectively an increase and a reduction in the sill of the stem diameter and jatropha plant height semivariograms. Souza et al. (2015) observed the same trend in the sill of the diameter in eucalyptus plants breast height, but the behavior sill of eucalyptus plant height differs from that found in jatropha plantation.
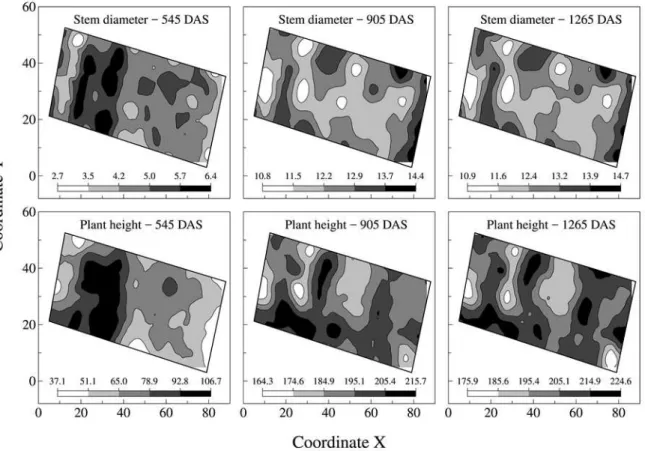
Figure 4 shows the spatial distribution maps of diameter and planting height generated from the interpolation kriging. The amplitude observed occurred at the time, the 545 DAS. From the visual analysis of maps, you can see that the diameter and height were similar spatial pattern in all measurements campaigns.
Variável C0 C A (m) SDD (%) µjk σjk
SD545DAS 0,19 0,43 9,42 30,65 -0,003 1,014
SD905DAS 1,03 0,67 11,20 60,59 0,003 1,072
SD1265DAS 1,06 0,78 10,00 57,61 0,003 1,066
H545DAS 193,80 236,83 18,41 40,32 -0,002 1,014
H905DAS 218,08 155,41 11,70 58,39 0,0003 1,028
H1265DAS 171,54 144,67 11,36 54,25 0,001 1,034
Rev. Caatinga
Figure 3. Semivariograms adjusted for stem diameter and plant height values at 545, 905 and 1265 days after sowing (DAS) and seed weight at 545 DAS of a jatropha plantation grown in the Northeast semiarid.
Over the years, there is a tendency for the spatial dependence of stem diameter and plant height to become more stable, which may be observed by the closer proximity of the SDD values at 905 to 1265 DAS. Thus, a uniform planting is expected at 1265 DAS. This behavior will reflect in the amount of oil produced by the plantation.
The spatial dependence (range) of stem diameter and plant height was approximately 10 and 14 meters, respectively. Even as a plantation by seed, which is expected to have a high uniformity, growth characteristics showed an average dependency
between plants. Important feature for uniform production of vegetable oil in jatropha plantations located in the semiarid region.
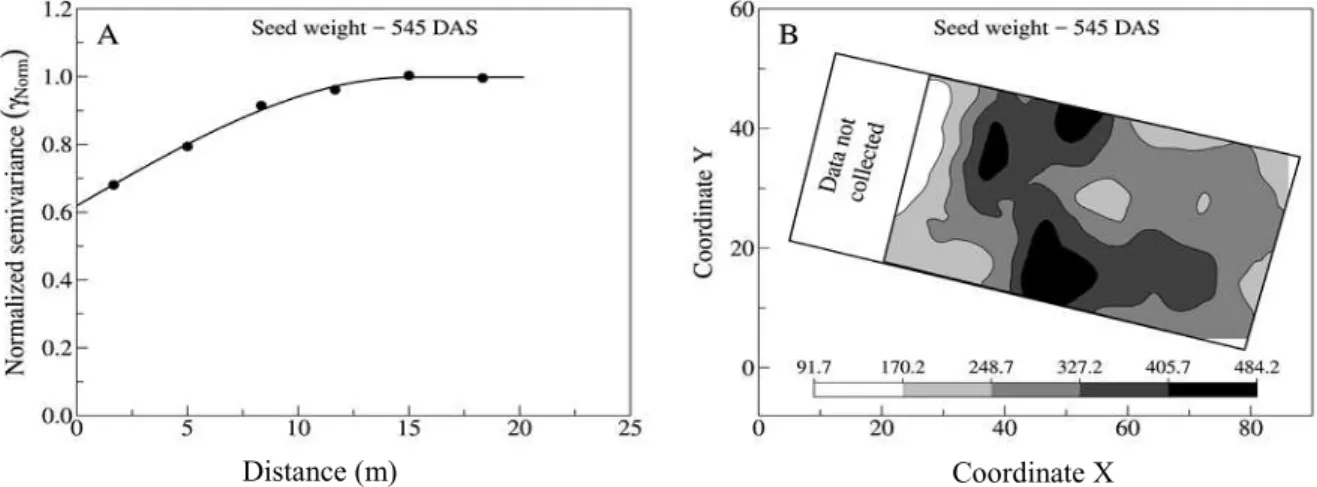
Figures 5A and 5B show, respectively, the semivariogram and spatial distribution map of seed weight per plant, made from the kriging interpolator. The estimated seed weight values ranged between 91.7 and 484.2 grams. The lower seed weight values are distributed in the initial portion of the Northwest area, followed by the two higher classes of seed
weight values (from 327.2 - 405.7 and 405.7 -
484.3 g).
Distance (m) Coordinate X
Figure 5. Adjusted semivariograms and spatial distribution map of seed weight (g) at 545 days after sowing (DAS) of a jatropha plantation grown in the Northeast semiarid.
Comparing the area where there was seed production to the areas of stem diameter and plant height, at 545 DAS, one realizes that at this time the plant biometric variables appear to have no effect on seed weight. This behavior can be related to plant age (ARRUDA et al., 2004), where the first productions are not yet well established.
The kriging interpolator associated to the data spatial dependence modeling allows the production of maps without tendencies and with spatial distribution close to reality.
CONCLUSION
Geostatistics allowed estimating stem diameter values, height and seed weight in all evaluated dates, as well as the range and magnitude of spatial dependence of each growth variable analyzed.
The model of spherical semivariogram was best suited to model the spatial variability of the jatropha dendrometric characteristics and seed weight, finding a medium spatial dependence degree for all characteristics of the evaluated dates.
From 905 days after sowing (DAS) on, the jatropha plantation showed lower amplitude in the evaluated characteristics, besides achieving a growth
pattern and spatial variability. The range (distance in which there is spatial dependence) of plant height reduced by an average 37% from 545 DAS when compared to 905 and 1265 DAS, while for stem diameter this parameter remained practically constant.
Geostatistics was useful for estimating the Jatropha characteristics, the interpretation of spatial variability and heterogeneity was observed in the contour maps. This technique can be employed to assist in future sampling and identifying areas with different patterns that may occur at planting.
ACKNOWLEGEMENTS
The authors want to thank the Agronomic Institute of Pernambuco (IPA), for granting and funding the project execution, as well as for having all the logistical and technical support for its implementation.
REFERENCES
ARRUDA, F. P. et al. Cultivo de pinhão-manso
(Jatropha curca L.) como alternativa para o semi
Rev. Caatinga
e Fibrosas, Campina Grande, v. 8, n. 1, p. 789-799, 2004.
CAMBARDELLA, C. A. et al. Field-scale
variability of soil properties in Central Iowa soils. Soil Science Society American Journal, Madison,
v. 58, n. 5, p. 1501-1511, 1994.
CARNIELLI, F. O combustível do futuro. Boletim
Informativo, Belo Horizonte, v. 29, n. 1413, 2003.
<http:// www.ufmg.br/boletim/bol1413/
quarta.shtml>. Acesso em 15 Dez. 2011.
DIAS, L. A. S. et al. Cultivo de pinhão-manso
(Jatropha curcas L.) para produção de óleo
combustível. 1. ed. Viçosa, MG: Editora UFV, 2007. 40 p.
DIGGLE, P. J.; RIBEIRO JÚNIOR, P. J. Model based geostatistics. Londres: springer, 2007. 230 p.
DRUMOND, M. A. et al. Desempenho agronômico de genótipos de pinhão manso no semiárido
pernambucano. Ciência Rural, Santa Maria, v. 40,
n. 1, p. 44-47, 2010.
GREGO, C. R.; VIEIRA, S. R. Variabilidade espacial de propriedades físicas do solo em uma
parcela experimental. Revista Brasileira de
Ciências do Solo, Viçosa, v. 21, n. 2, p. 169-177, 2005.
HORSCHUTZ, A. C. O. et al. Crescimento e
produtividade do pinhão-manso em função do
espaçamento e irrigação. Revista Brasileira de
Engenharia Agrícola e Ambiental, Campina Grande, v. 16, n. 10, p. 1093–1099, 2012.
LAVIOLA, B. G.; DIAS, L. A. S. Teor e acúmulo de
nutrientes em folhas e frutos de pinhão-manso.
Revista Brasileira de Ciência do Solo, Viçosa, v. 32, n. 5, p. 1969-1975, 2008.
LIMA, C. G. R. et al. Atributos físico-químicos de
um latossolo do cerrado brasileiro e sua correlação com características dendrométricas do eucalipto. Revista Brasileira de Ciência do Solo, Viçosa, v. 34, n. 1, p. 163-173, 2010.
MARTINS, C. C.; MACHADO, C. G.; CAVASINI,
R. Desenvolvimento inicial de mamona e pinhão
-manso em solo submetido a diferentes corretivos e
doses de fósforo. Revista Verde de Agroecologia e
Desenvolvimento Sustentável, Mossoró, v. 5, n. 1,
p. 143-150, 2010.
MENG, Q.; CIESZEWSKI, C.; MADDEN, M. Large area forest inventory using Landsat ETM+: a
geostatistical approach. Journal of
Photogrammetry and Remote Sensing, Athens, v.
64, n. 1, p. 27-36, 2009.
NERY, A. R. et al. Produção do segundo ciclo do
pinhão-manso irrigado com águas salinizadas em
ambiente protegido. Revista Brasileira de
Engenharia Agrícola e Ambiental, Campina
Grande, v. 17, n. 5, p. 531-536, maio 2013.
NERY, A. R. et al. Crescimento do pinhão-manso
irrigado com águas salinas em ambiente protegido. Revista Brasileira de Engenharia Agrícola e Ambiental, Campina Grande, v. 13, n. 5, p. 551– 558, 2009.
PEIXOTO, A.R. Plantas oleaginosas arbóreas. 2
ed. São Paulo, SP: Nobel, 1973. 284 p.
PIMENTEL-GOMES, F et al. Estatística aplicada a
experimentos agronômicos e florestais: Exposição com exemplos e orientações para uso de aplicativos. 11. ed. São Paulo, SP: FEALQ, 2002. 309 p.
R CORE TEAM. R Fundation for Statistical
Computing. R: A language and environmet for
statistical computing. Disponível em: <http://
www.R-project.org/>. Acesso em: 14 fev. 2015.
RATREE, S.A. Preliminary study on physic nut
(Jatropha curcas L.) in Thailand. Pakistan Journal
of Biological Sciences, Pakistan, v. 7, n. 9, p. 1620 -1623, 2004.
RIBEIRO JUNIOR, P. J. et al. geoR: a package for
geostatistical analysis. R-NEWS, Österreich, v.1, n.
2, p.15-18, 2001.
SILVA, M. B. R. et al. Cultivo de pinhão- manso sob
condições de estresse hídrico e salino, em ambiente
protegido. Revista de Biologia e Ciências da Terra,
São Cristóvão, v. 9, n. 2, p. 74-79, 2009.
SIQUEIRA, V. C. et al. Forma e tamanho dos frutos
de pinhão-manso durante a secagem em cinco
condições de ar. Revista Brasileira de Engenharia
Agrícola e Ambiental, Campina Grande, v. 16, n. 8, p. 864–870, 2012.
SOUZA, R. M. S. et al. Evaluation of the spatial dependence of dendrometric characteristics for an
Eucalyptus plantation. Acta Scientiarum.
Agronomy, Maringá, v. 37, n. 4, p. 483-488, 2015.
SUJATHA, M.; MAKKAR, H. P. S.; BECKER, K. Shoot bud proliferation from axillary nodes and leaf
sections of nontoxic Jatropha curcas L. Plant
UFCG-DCA - Universidade Federal de Campina
Grande - Departamento de Ciências Atmosféricas.
<http://www.dca.ufcg.edu.br>. 15 Dez. 2013.
VERAS, R. P. et al. Altura de planta, diâmetro
caulinar e produção do pinhão-manso irrigado sob
diferentes níveis de salinidade. Revista Brasileira
de Engenharia Agrícola e Ambiental, Campina Grande, v. 15, n. 6, p. 582–587, 2011.
VIEIRA, S. R. et al. Spatial variability of soil chemical properties after coffee tree removal. Revista Brasileira de Ciências do Solo. Viçosa, v.
33, n. 5, p. 1507-1514, 2009.