Revista Brasileira de
Engenharia Agrícola e Ambiental
Campina Grande, PB, UAEA/UFCG – http://www.agriambi.com.br
v.20, n.7, p.618-624, 2016
Spatial variability of Regosol chemical attributes
in guava management with neem under semi-arid conditions
Douglas B. Castro
1, Elvira M. R. Pedrosa
2, Abelardo A. A. Montenegro
2,
Mario M. Rolim
2, Diego A. H. S. Leitão
3& Ana Karina S. Oliveira
3DOI: http://dx.doi.org/10.1590/1807-1929/agriambi.v20n7p618-624
A B S T R A C T
Considering the relevant importance of guava (Psidium guajava) in Northeastern Brazil along with the benefits of neem cake amendments on soil characteristics, this work evaluated the effects of neem cake on chemical attributes of a Regosol under irrigated guava orchard in an alluvial valley of Pernambuco semi-arid region. Evaluations were carried out in two areas (area 1 – with neem cake; area 2 – without neem cake) at three periods: before the first application of neem cake, 90 days after the first application and 90 days after the second application. A regular 8 × 6-point grid was designed in each area and the soil was sampled for total organic carbon, pH, soluble salts (Na+, K+, Ca2+ and Mg2+) and total nitrogen contents,
as well as soil C-CO2 evolution rate in soil. Geostatistical analysis pointed out the spherical
model as the best fit to the studied variables, followed by the Gaussian model, with ranges from 12 to 60.5 m. Neem cake incorporation increased spatial variability and the contents of the evaluated soil chemical attributes.
Variabilidade espacial de atributos químicos em Neossolo
no manejo da goiabeira com nim no semiárido
R E S U M O
Considerando a importância do cultivo de goiabeiras (Psidium guajava) para o nordeste do Brasil e os benefícios da aplicação da torta de nim nas características do solo, avaliou-se o efeito da aplicação de torta de nim nos atributos químicos de um Neossolo Regolítico cultivado com goiabeiras irrigadas no semiárido de Pernambuco. Para as avaliações foram usadas duas áreas (área 1 – com nim; área 2 – sem nim) e três períodos, antes da aplicação do nim, 90 dias após a primeira aplicação e 90 dias após a segunda aplicação; assim, 96 amostras de solo foram coletadas em duas malhas regulares de 8 × 6 pontos amostrais e realizadas análises do teor de carbono orgânico total, pH, teores de sais solúveis (Na+, K+,
Ca2+e Mg2+), nitrogênio total e taxa de evolução C-CO
2 do solo. O modelo esférico foi o
que melhor se ajustou às variáveis estudadas seguido pelo gaussiano, com alcances que variaram de 12 a 60,5 m. A incorporação da torta de nim aumentou a variabilidade espacial e a oferta dos atributos de solo estudados.
Key words:
Azadirachta indica
management soil quality
Psidium guajava
Palavras-chave:
Azadirachta indica
manejo
qualidade do solo
Psidium guajava
1 Universidade Federal Rural de Pernambuco/Programa de Fitopatologia. Recife, PE. E-mail: dougbcastro@gmail.com
2 Universidade Federal Rural de Pernambuco/Departamento de Engenharia Agrícola. Recife, PE. E-mail: elvira.pedrosa@ufrpe.br; abelardo.
montenegro@yahoo.com.br; mario.rolim@ufrpe.br (Corresponding author)
3 Universidade Federal Rural de Pernambuco/Programa de Engenharia Agrícola. Recife, PE. E-mail: didiarruda@hotmail.com; akmsol22@hotmail.com
Introduction
Guava (Psidium guajava L.) is a rustic fruit crop, with good capacity of dispersion and rapid adaptation to different environments. Guava fruits have excellent acceptance in the market due to the great variety of products, by-products and forms of consumption (Campos et al., 2013). In Brazil, the crop is predominantly grown using family labor, on 3 to 5 ha farms. In the Northeast, the regional production is concentrated in the irrigated districts of Pernambuco and Bahia, due to the water availability, favorable conditions of soil and climate and advanced mechanization techniques (Araújo et al., 2013). With adequate irrigation and phytosanitary management, the orchards may reach yields higher than 40 t ha-1; however, half of
this yield has been reported in the country. The concern about the use of agrochemicals, not only for the risks to humans and the environment, but also for the increments in production costs (Soares & Porto, 2012), has stimulated the search for more sustainable management alternatives, such as the incorporation of neem (Azadirachta indica A. Juss) cake to the soil.
Known as an important medicinal plant since the medieval period, neem has activity against more than 430 species of pests (Martinez, 2002) and is used for pest management due to the low cost and ecological viability; however, despite the effectiveness of neem by-products in the integrated management of pests and diseases (Chaves et al., 2012), there is little information on how these products affect soil chemical quality, particularly under semiarid conditions. This study aimed to evaluate variations in spatial-temporal distributions of soil chemical attributes after the incorporation of neem cake in a guava orchard in the Pernambuco semiarid region.
Material and Methods
The experiment was carried out from April to October 2013 in a commercial orchard of ‘Paluma’ guava, with six months of planting, in a rural settlement in the Ipanema River sub-basin, in the municipality of Pesqueira-PE, Brazil. The experimental area has 0.84 ha and is situated between the coordinates of 8o 23.835’ and 8o 23.903’ S and 36o 51.515’ and 36o 51.475’
W, with south-north slope of 0.4%. The soil in the area was predominantly described as Fluvent Entisol, with 751.32, 169.13 and 79.55 g kg-1 of sand, silt and clay, respectively. The
climate in the region, according to Köppen’s classification, is BSh (extremely hot, semiarid). Mean annual temperature is 23 ºC, mean annual rainfall is 700 mm and mean annual evapotranspiration is 2000 mm (Santos et al., 2012).
The orchard was planted by the farmer between the months of September and October 2012. The experimental area was divided into two areas of equal size, Area 1 and Area 2, and the sampling grids were designed according to the position of the plants, alternately along the X and Y axes, totaling 48 (8 × 6) points per area, each one with approximately 200 plants.
Area 1 was randomly drawn to be amended with the neem cake applied in guava plants according to the sampling grid points each application soil pits were open around the plant, following the canopy projection area, with depth of
approximately 25 cm, and the product was uniformly amended at the dose of 1 kg plant-1 and, then, soil pits were filled with
soil. The neem cake was provided by the Cruangi Mill and showed contents of 23.92, 14.335, 0.569, 0.966, 1.145, 1.049, 0.512 and 1.041 g kg-1 of N, K+, Na+, Ca2+, Mg2+, Zn2+, Cu+ and
Mn2+, respectively.
Along the experimental period, the orchard was drip-irrigated according to the need and did not receive any type of chemical fertilizer. The control of invasive plants was manually performed, without the application of commercial herbicides.
Approximately 2 kg of soil were sampled from each grid point, at the beginning of the study (s1); 90 days after the first sampling (s2) and 90 days after the second sampling (s3), totaling 180 experimental days. Neem cake was immediately amended after the first (s1) and second (s2) samplings, after which the samples were placed in plastic bags, protected from heat sources, identified and taken to the Laboratory of Soil Chemistry of the Federal Rural University of Pernambuco for chemical analyses of total organic carbon (OC), pH, soluble salts (Na+, K+, Ca2+ and Mg2+), total nitrogen (TN) and C-CO
2
evolution rate of the soil.
OC was determined through oxidation of organic matter using the wet method; soil pH was determined using 10 g of air-dried sieved soil (ADSS) in water (1:2.5); soil contents of soluble K+, Na+, Ca2+ and Mg2+ were based on the
respective saturation extracts using an atomic absorption spectrophotometer with flame for the reading of divalent cations and a flame photometer for the reading of monovalent cations. Soil TN was quantified from 0.5 g of ADSS and N reading (dag kg-1) performed through titration with diluted
HCl, all according to EMBRAPA (2009).
For determination of soil C-CO2 evolution rate, 100-g
soil samples were placed in plastic containers at the moment of the samplings and immediately taken to the laboratory, placed along with another container with 10 mL of 0.5 N KOH in a sealed glass chamber for 15 days at 25 ± 2 oC in an
environment protected from the light. The CO2 absorbed by
KOH was determined through titration with 0.1 N HCl, using phenolphthalein and methyl orange as indicators.
Data were evaluated through analysis of variance and descriptive statistical analyses, with values of maximum, minimum, mean, median, coefficient of variation, standard deviation and kurtosis, and normality tested by the Kolmogorov-Smirnov analysis.
The variability of the analyzed attributes was classified according to Warrick & Nielsen (1980), as low (CV < 12%), moderate (12% < CV > 24%) or high (CV > 24%). Spatial dependence was analyzed through the fit of the classic semivariogram based on the estimate of the semivariances using the program GEO-EAS. The data were fitted to experimental semivariograms and, subsequently, spherical, Gaussian and exponential models were tested. The mathematical fit enabled the definition of the nugget effect (C0), spatial range (A) and sill (C0 + C1).
semivariogram lower than 25% characterize strong dependence; between 25 and 75%, moderate dependence; and above 75%, weak dependence. The parameters of the semivariance function after fitting to the theoretical models were used in the construction of isoline maps through kriging, in order to define zones of similar variability and divide the area into more homogeneous sub-regions. Isoline maps were constructed using the program Surfer 9.9.785 (Golden Software®).
Results and Discussion
When little close, the values of mean and median may indicate non-normality of the data, since they characterize an asymmetric distribution. From the 48 probable combinations for the eight chemical variables analyzed (two areas and three samplings), 23 combinations did not present normal distribution, by Kolmogorov-Smirnov at 0.05 probability level (Table 1). Based on the CV
K+(cmol c L
-1); Na+(cmol c L
-1); Mg2+(cmol c L
-1); Ca2+(cmol c L
-1); C-CO
2 – C-CO2 evolution rate (mg CO2); OC – Organic carbon (dag kg
-1); TN – Total nitrogen (g kg-1); pH – Hydrogen potential;
CV – Coefficient of variation; SD – Standard deviation; KS – Kolmogorov-Smirnov normality test at 0.05 probability level; ns – Not significant; *Significant
Maximum Minimum Mean Median Kurtosis CV (%) SD KS
Area 1 – Sampling 1
K+ 2.6010 0.3597 0.9829 0.8741 1.4168 49.0461 0.4820 *
Na+ 9.5256 1.6421 4.0050 3.7572 0.9805 46.1420 1.8480 *
Mg2+ 3.7029 0.1152 1.8455 1.8308 -1.0417 52.9894 0.9779 *
Ca2+ 5.3771 0.6253 2.9078 2.9863 0.4836 34.4821 1.0026 *
C-CO2 28.546 0.1805 10.678 9.0206 -0.4198 74.8757 7.9952 ns
OC 0.9400 0.0947 0.4580 0.4453 0.0803 37.2987 0.1708 *
TN 0.8386 0.3909 0.6139 0.6156 -0.3287 16.7827 0.1030 ns
pH 8.66 5.66 7.2158 7.19 0.3218 8.2306 0.5939 *
Area 1 – Sampling 2
K+ 1.4640 0.5001 0.9042 0.8730 -0.2315 24.8189 0.2244 *
Na+ 4.2855 1.2622 2.2919 2.1293 0.1621 36.5822 0.8384 ns
Mg2+ 6.6455 0.2468 2.5101 1.6161 -0.5374 77.4354 1.9437 ns
Ca2+ 5.3196 0.1257 1.6592 1.1916 0.7209 81.3098 1.3491 ns
C-CO2 55.8352 1.7018 12.810 8.2934 4.1743 89.9790 11.527 ns
OC 0.9602 0.5782 0.7327 0.7259 -0.0382 12.4799 0.0914 *
TN 9.5067 3.9129 6.2283 6.1556 1.3007 17.7099 1.1030 ns
pH 7.1800 5.22 6.1739 6.14 -0.2549 7.8679 0.4857 *
Area 1 – Sampling 3
K+ 3.0679 0.3034 1.2442 1.1218 0.3894 53.3002 0.6631 ns
Na+ 43.5789 4.2821 15.015 9.7589 -0.0208 67.3286 10.11 ns
Mg2+ 5.9046 1.4749 3.4398 3.2974 -0.2030 29.2292 1.0054 *
Ca2+ 5.8026 1.5270 3.1327 3.0699 0.2018 30.8336 0.9659 *
C-CO2 59.3106 0.3837 19.012 16.0067 2.6708 66.2389 12.5934 ns
OC 1.2181 0.5378 0.8766 0.8617 0.6648 15.6121 0.1368 *
TN 12.0995 3.7258 7.7379 7.6479 0.3239 22.6686 1.7540 ns
pH 7.9800 6.2 7.2335 7.33 -0.5253 6.62554 0.4792 ns
Area 2 – Sampling 1
K+ 2.0953 0.2863 1.0074 0.9108 -0.0733 48.0791 0.4843 ns
Na+ 7.9874 1.6867 3.6232 3.1804 0.7011 45.8461 1.6611 ns
Mg2+ 5.2768 0.0494 1.8364 1.6679 0.4484 62.8046 1.1533 *
Ca2+ 3.7297 0.2318 1.7497 1.6302 0.0518 45.2120 0.7910 *
C-CO2 101.4208 0.1780 17.212 11.3681 8.7955 108.2078 18.6244 ns
OC 0.8270 0.0314 0.3850 0.4091 -0.164 45.2369 0.1741 *
TN 0.7838 0.3912 0.5652 0.5592 -0.3933 17.0447 0.0963 *
pH 7.77 6.57 7.1620 7.21 -0.0243 3.9122 0.2801 *
Area 2 – Sampling 2
K+ 2.6373 0.3374 1.1322 1.0452 1.4507 42.9599 0.4864 *
Na+ 5.1527 1.2622 2.4301 2.0054 0.0528 45.2244 1.0990 ns
Mg2+ 15.9441 0.5299 3.5143 2.3566 4.3123 88.7554 3.1191 ns
Ca2+ 23.9859 0.1057 3.0381 1.7645 19.954 124.6167 3.7860 ns
C-CO2 61.6645 1.6527 16.251 11.9606 5.2632 75.0539 12.1967 ns
OC 0.9193 0.3712 0.6498 0.666 0.3433 27.3598 0.1128 *
TN 6.7200 4.4692 5.3267 5.3132 -0.1455 10.1773 0.5421 ns
pH 7.2100 5.01 6.2191 6.4 0.0145 7.6054 0.4808 *
Area 2 – Sampling 3
K+ 2.9935 0.3530 1.3007 0.9978 -0.4236 60.0712 0.7813 ns
Na+ 44.2309 4.4125 16.462 9.6285 -0.4871 72.0765 11.8649 ns
Mg2+ 6.9404 1.6539 3.6254 3.6188 0.3515 32.4614 1.1768 ns
Ca2+ 8.3756 1.9441 5.2473 5.3425 0.0628 27.0470 1.4192 *
C-CO2 80.0943 5.4827 20.575 15.835 5.6447 73.0709 15.0345 ns
OC 1.0586 0.4363 0.6968 0.6626 -0.4368 32.2322 0.1549 *
TN 9.4953 3.1695 5.8305 5.9554 0.2254 23.6288 1.3777 ns
pH 8.2200 6.75 7.5685 7.625 0.4287 4.2053 0.3182 *
limits proposed by Warrick & Nielsen (1980), only pH showed low variability in both areas and in all sampling periods (Table 1). TN showed moderate variability and OC, moderate to strong; the other chemical variables showed high variability (CV > 24%), corroborating with Leão et al. (2011).
In Area 1 (Table 1), the variation in the OC contents decreased over time, from a CV of 37.3%, before neem application, to 12.5%
at 90 days after the first application (sampling 2) and 15.6% at 90 days after the second application (sampling 3), indicating that the uniform application of neem cake in that area may have reduced OC variability, although this reduction in variability also occurred over time in the Area 2, but at lower proportions. The best fits for the soil attributes (Table 2) were obtained with the spherical model; seven out of eight analyzed soil
K+- Potassium (cmol c L
-1); Na+ - Sodium (cmol c L
-1); Mg2+- Magnesium (cmol c L
-1); Ca2+- Calcium (cmol c L
-1); C-CO
2 – Evolution C-CO2 (mg CO2); OC – Organic carbon (dag kg
-1); TN – Total
nitrogen (g kg-1); pH – Hydrogen potential; C
0 – Nugget effect; C1 – Contribution; C0 + C1 – Sill; R
2 – Coefficient of determination; DSD – Degree of spatial dependence; SD – Standard deviation;
Spher. – Spherical; Gauss. – Gaussian; Exp. – exponential
Model C0 C1 A R2 C0/(C0+ C1) DSD
Jack-Kning
Mean SD
Sampling 1 - Area 1 K+ Pure nugget effect
Na+ Exp. 2.0043 1.7263 16.7632 0.5423 53.73 Mod. -0.019 0.934
Mg2+ Gauss. 0.5948 0.4968 26.2622 0.8785 54.49 Mod. 0.009 1.013
Ca2+ Gauss. 0.5678 0.6742 31.3567 0.9339 45.72 Mod. -0.004 1.084
C-CO2 Gauss. 0.0917 0.0277 20.8691 0.6381 76.80 Weak -0.050 0.947
OC Pure nugget effect
TN Gauss. 0.0074 0.0097 60.4925 0.973 43.27 Mod. 0.007 1.018
pH Pure nugget effect
Sampling 1 - Area 2 K+ Pure nugget effect
Na+ Spher. 0.0025 0.0160 16.19370 0.9074 13.51 Strong 0.026 1.070
Mg2+ Spher. 0.5673 0.7792 18.0059 0.8857 42.13 Mod. -0.010 1.006
Ca2+ Spher. 0.3643 0.2731 24.4869 0.5910 57.15 Mod. -0.023 1.013
C-CO2 Pure nugget effect OC Pure nugget effect
TN Spher. 0.0072 0.0018 38.0168 0.8840 80.00 Weak -0.003 1.035
pH Pure nugget effect
Sampling 2 - Area 1 K+ Pure nugget effect
Na+ Pure nugget effect
Mg2+ Spher. 2.2362 2.1406 58.4262 0.9855 59.43 Mod. -0.040 1.004
Ca2+ Gauss. 1.1948 0.8026 39.3440 0.9249 59.43 Mod. -0.043 0.949
C-CO2 Spher. 89.0934 60.8257 38.7603 0.8757 59.43 Mod. 0.001 1.149
OC Spher. 0.0064 0.0026 54.6216 0.9206 71.11 Mod. -0.033 1.064
TN Spher. 0.9679 0.1534 51.4044 0.8001 86.32 Weak -0.066 1.087
pH Spher. 0.0203 0.1964 16.9613 0.6672 9.37 Strong -0.031 1.050
Sampling 2 - Area 2
K+ Spher. 0.0644 0.0973 53.1051 0.8416 39.83 Mod. 0.027 1.048
Na+ Spher. 0.0154 0.0212 34.3375 0.6986 42.08 Mod. 0.005 1.030
Mg2+ Spher. 0.0259 0.0495 36.6484 0.9526 34.35 Mod. 0.003 1.076
Ca2+ Gauss. 1.4398 2.0341 23.3399 0.8892 41.45 Mod. -0.019 0.901
C-CO2 Gauss. 82.6639 119.177 42.8046 0.9807 40.95 Mod. -0.018 1.076
OC Spher. 0.0030 0.0103 27.9968 0.9688 22.56 Strong -0.015 1.029
TN Spher. 0.1438 0.1567 18.4857 0.7283 47.85 Mod. -0.002 1.058
pH Pure nugget effect
Sampling 3 - Area 1 K+ Pure nugget effect
Na+ Pure nugget effect
Mg2+ Spher. 0.5376 0.5234 27.4973 0.9016 50.67 Mod. -0.008 1.008
Ca2+ Exp. 0.5312 0.4202 12.0180 0.7827 55.83 Mod. -0.051 0.908
C-CO2 Pure nugget effect
OC Spher. 0.0148 0.0237 17.159 0.6654 38.44 Mod. -0.039 1.075
TN Spher. 2.2807 0.7199 29.0486 0.7319 76.01 Weak -0.023 1.082
pH Pure nugget effect
Sampling 3 - Area 2 K+ Pure nugget effect
Na+ Spher. 94.5951 48.8706 32.4872 0.9861 65.94 Mod. -0.013 1.106
Mg2+ Spher. 0.0200 1.3431 18.6182 0.9428 1.47 Strong -0.023 1.059
Ca2+ Pure nugget effect
C-CO2 Spher. 65.1699 149.783 21.4709 0.6508 30.32 Mod. 0.019 1.246
OC Pure nugget effect TN Pure nugget effect pH Pure nugget effect
attributes showed nugget effect in at least one of the areas and one of the samplings, except for Mg2+, which were fitted to
the spherical or Gaussian models for all areas and sampling periods. The nugget effect is an important measurement of the semivariogram and indicates unexplained variability, which may be due to measurement errors or even undetected microvariation, considering the sampling distance used (Carrasco, 2010).
The ranges obtained for soil chemical attributes (Table 2) showed wide variation with minimum of 12.02 m for Ca2+ in
the third sampling of Area 1 and maximum of 60.49 m for TN in the first sampling of Area 1. High range values characterize
higher continuity in the distribution of the variable, possibly due to the management (Souza et al., 2004).
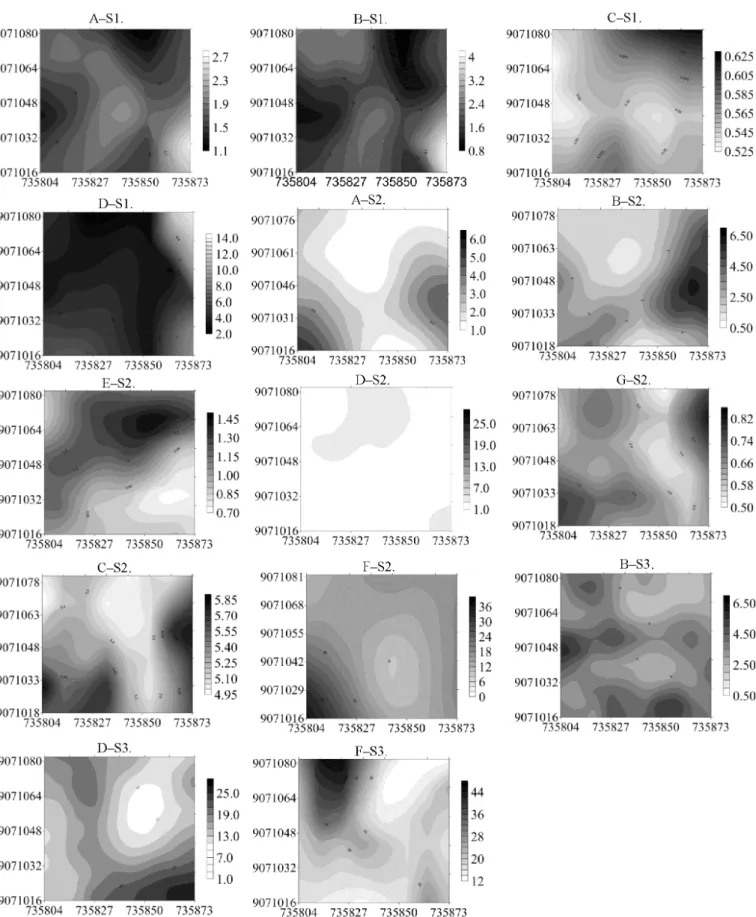
The isoline maps for the chemical variables that showed spatial dependence in Area 1 are shown in Figure 1. The spatial distributions of Ca2+, Mg2+, TN, Na+ and pH in the first
sampling (Figure 1-C1) showed higher levels in the northeast region of the area and lower levels in the central region; coincident regions for these attributes are explained by the greater availability of these ions in the solution of soils with higher pH (Natale et al., 2012).
At 90 days (sampling 2), the pattern of spatial distribution for Ca2+ and Mg2+ still showed central region with the
lowest levels of these nutrients (Figures 1A-C1 and 1B-C2), such as in sampling 1 (Figures 1A-C1 and 1B-C1). This demonstrates that, at first, the incorporation of neem cake did not interfere with the spatial distribution of these nutrients; the spatial distributions of OC and TN (Figures 1F-C1 and 1C-C1) indicate higher concentrations on the east region,
demonstrating that a great part of soil N was immobilized in the organic form. Comparing the maps of TN for sampling 1 (Figure 1C-C1) and sampling 2 (Figure 1C-C2), higher values were concentrated in the east region of the area, indicating that, at 90 days, the neem cake did not interfere with the spatial distribution of TN.
The nearer lines showing narrower strips for this type of map characterize higher spatial variability, while wider strips present greater uniformity. Comparing the maps for each element, before and after application, there were a few similarities in the patterns of spatial distribution, indicating that the incorporation of neem cake must have influenced the dynamics of these nutrients in the treated area. The increase in the variability of C-CO2 evolution rate due to neem cake
incorporation possibly results from the influence of the organic matter on the different microbial communities (Gleixner, 2013). For OC (Figures 1F-C1, 1F-C2 and 1F-C3), neem cake application increased the variability and the contents in the soil, showing narrower lines at the end of the study. Menezes & Silva (2008) reported similar behavior to the effects of organic fertilizers on soil fertility.
In the maps of samplings 1, 2 and 3 in Area 2 (Figure 2), there was no narrowing of the strips for any of the chemical variables over time, indicating that there were no great chemical alterations in the soil. The highest variabilities were observed for TN in samplings 1 and 2, OC in sampling 2 and C-CO2 evolution rate in sampling 3. The amount of carbon in the soil under cultivation systems is the response between the rates of residue addition, mineralization and humification.
Less aggressive and more efficient techniques in an integrated management system for guava are necessary, especially in the Brazilian Northeast region, where edaphoclimatic conditions are less favorable to the crop. The incorporation of neem cake as an alternative measure proved to be viable not only to improve soil quality, but also due to the need for a sustainable agriculture, with high yield, quality and low economic and environmental impact.
Conclusion
Neem cake incorporation promoted chemical alterations in the soil, increasing the spatial variability and the supply of organic carbon, nitrogen and soluble salts to plants.
Literature Cited
Araújo, E. L.; Ribeiro, J. C.; Chagas, M. C. M.; Dutra, V. S.; Silva, J. G. Moscas-das-frutas (Diptera: Tephritidae) em um pomar de goiabeira, no semiárido brasileiro. Revista Brasileira de Fruticultura, v.35, p.471-476, 2013. http://dx.doi.org/10.1590/ S0100-29452013000200016
Cambardella, C. A.; Moorman, T. B.; Novak, J. M.; Pakin, T. B.; Karlem, D. L.; Turco, R. F.; Konopa, A. A. Field scale variability of soil properties in Central Iowa soils. Soil Science Society of America Journal, v.58, p.1501-1511, 1994. http://dx.doi.org/10.2136/ sssaj1994.03615995005800050033x
Campos, B. M.; Viana, A. P.; Quintal, S. S. R.; Gonçalves, L. S. A.; Pessanha, P. G. O. Quantificação da divergência genética entre acessos de goiabeira por meio da estratégia WARD-MLM. Revista Brasileira de Fruticultura, v.35, p.571-578, 2013. http://dx.doi. org/10.1590/S0100-29452013000200028
Carrasco, P. C. Nugget effect, artificial or natural? The Journal of The Southern African Institute of Mining and Metallurgy, v.110, p.299-306, 2010.
Chaves, A.; Pedrosa, E. M. R.; Coelho, R. S. B.; Guimarães, L. M. P.; Maranhão, S. R. V. L.; Gama, M. A. S. Alternativas para o manejo integrado de fitonematoides em cana-de-açúcar. Revista Brasileira de Ciências Agrárias, v.7, p.73-80, 2012. http://dx.doi.org/10.5039/ agraria.v7i1a1489
EMBRAPA - Empresa Brasileira de Pesquisa Agropecuária. Manual de análises químicas de solos, plantas e fertilizantes. Distrito Federal – Embrapa Solos, 2.ed. 2009. 623p.
Gleixner, G. Soil organic matter dynamics: A biological perspective derived from the use of compound-specific isotopes studies. Ecological Research, v.28, p.683-695, 2013. http://dx.doi. org/10.1007/s11284-012-1022-9
Leão, M. G. A.; Marques Júnior, J.; Souza, Z. M.; Siqueira, D. S.; Pereira, G. T. Terrain forms and spatial variability of soil properties in an area cultivated with citrus. Engenharia Agrícola, v.31, p.643-651, 2011. http://dx.doi.org/10.1590/S0100-69162011000400003
Martinez, S. S. O nim Azadirachta indica: Natureza, usos múltiplos,
produção. Londrina: Instituto Agronômico do Paraná, 2002. 142p. Menezes, R. S. C.; Silva, T. O. Mudanças na fertilidade de um noessolo regolítico após seis anos de adubação orgânica. Revista Brasileira de Engenharia Agrícola e Ambiental, v.12, p.251-257, 2008. http:// dx.doi.org/10.1590/S1415-43662008000300005
Natale, W.; Rozane, D. E.; Parent, L. E.; Parent, S. E. Acidez do solo e calagem em pomar de frutíferas tropicais. Revista Brasileira de Fruticultura, v.34, p.1294-1306, 2012. http://dx.doi.org/10.1590/ S0100-29452012000400041
Santos, K. S.; Montenegro, A. A. A.; Almeida, B. G.; Montenegro S. M. G. L.; Andrade, T. S.; Fontes Júnior, R. V. P. Variabilidade espacial de atributos físicos em solos de vale aluvial. Revista Brasileira de Engenharia Agrícola e Ambiental, v.16, p.828-835, 2012. http:// dx.doi.org/10.1590/S1415-43662012000800003
Soares, W. L.; Porto, M. F. S. Uso de agrotóxicos e impactos econômicos sobre a saúde. Revista de Saúde Pública, v.36, p.209-217, 2012. http://dx.doi.org/10.1590/S0034-89102012005000006
Souza, Z. M.; Marques Júnior, J.; Pereira, G. T.; Moreira, L. F. Variabilidade espacial do pH, Ca, Mg e V% do solo em diferentes formas do relevo sob cultivo de cana-de-açúcar. Ciência Rural, v.34, p.1763-1771, 2004. http://dx.doi.org/10.1590/S0103-84782004000600015