Algorithms for Stem Mapping
by Means of Terrestrial Laser Scanning
Gábor B
ROLLY*– Géza K
IRÁLYDepartment of Surveying and Remote Sensing, Faculty of Forestry, University of West Hungary, Sopron, Hungary
Abstract – Terrestrial laser scanning is an active remote-sensing technique, which has the potential to
provide detailed spatial data for various applications in the fields of forestry and nature conservation. This study introduces algorithms and methods to extract individual tree parameters – such as tree location, stem diameter at breast height (DBH), and tree height – in automatic manner from terrestrial laser scanning data. The efficiency of the algorithms was tested on laser scanning data collected in a permanent sampling plot in the Hidegvíz-völgy forest reserve. The accuracy of the derived individual tree parameters was validated against tree metrics yielded by traditional field methods.
Remote Sensing / TLS / Modelling / Algorithms / Tree parameter estimation
Kivonat – Automatizált eljárások törzstérképek el állítására földi lézeres letapogatás alapján.
A földi lézeres letapogatás egy új, aktív távérzékelési technika, mely részletes térbeli adatok szolgáltatásával az erdészeti és természetvédelmi célú térképezések és faállomány-felvételek hatékony eszköze lehet. Jelen tanulmány olyan módszereket és algoritmusokat mutat be, melyekkel egyesfák térképi pozíciója, mellmagassági átmér je, és magassága határozható meg automatizált úton, a földi lézeres letapogatás adataiból. Az algoritmusok hatékonyságát a Hidegvíz-völgy erd rezervátum egyik állandósított mintapontján készített felmérés adataival teszteltük. A faegyedek helyének és méreteinek pontossági vizsgálatához az algoritmusok eredményeit hagyományos eszközökkel végzett térképezés és törzsenkénti felvétel adataival hasonlítottuk össze.
távérzékelés / TLS / modellezés / algoritmusok / egyesfa paraméterek becslése
1 INTRODUCTION
Forest reserves are strictly protected conservation units. Beyond conservation, study of the diversity and structure of undisturbed forests are prerequisites to understand their dynamics. Data acquisition should be carried out on individual tree level since the traditional metrics are related to single-trees. On this scale the classical inventory methods require manual measurements and a lot of fieldwork. Up-to-date terrestrial remote sensing techniques offer data from which forest-related information could be derived through modelling. Models have the ability to hold spatially explicit information such as distances, directions, angles, neighbourhood relations, overlays, and surface roughness, which makes more realistic structure characterization possible. Furthermore, parameters of accuracy are produced by
*
several modelling methods. Laser scanning is one of the most efficient techniques today, to obtain high-resolution data on the scale of single trees that can be utilized to stem mapping, realistic tree modelling and accurate parameter estimation.
Laser scanning, often referred to as LIDAR, is an active remote sensing technique, which can operate on aerial or on terrestrial platform. In both cases, three-dimensional coordinates, acquired by scanning laser range measurements, describe the surfaces of measured objects. Laser scanning is developed for topographical surveying and civil engineering, but can be an efficient tool in forestry-related data capture as well. The primary output, the so-called raw data, is a three-dimensional point cloud with high accuracy, however, without any thematical or structural characteristics. Considering the amount of data it is often necessary to use automated algorithms with minimal user interaction. To obtain information from raw data, reduction and generalization is necessary which occurs in filtering and modelling procedures. In the course of filtering measurements from relevant objects are extracted from the raw data set. Various object-types require special filtering methods. In the stage of modelling geometric primitives - such as planes, surfaces, bodies of revolution, etc. – are fitted on the filtered points. Based on these models not only metric, but topological, structural, or even thematical information can be obtained with simple visual or computer aided spatial analysis. In this study we focused on the branch-free bole of trees. The main goal was the evaluation of a terrestrial laser scanning for individual tree map and classical forestry-related tree metrics (DBH, tree height). The sample data derived from the first terrestrial laser scanning, which was carried out on a Hungarian forest site. The performance of the highly automated algorithms was validated against classical field measurements.
2 MATERIALS
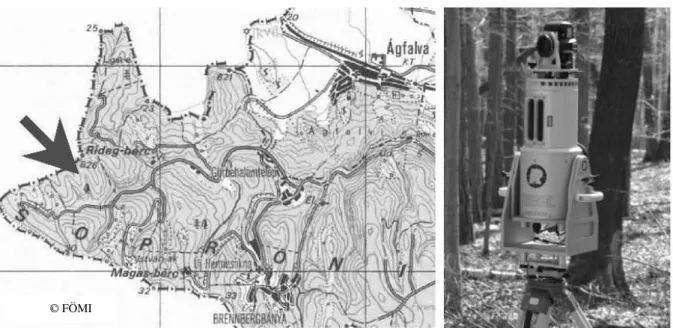
Forest Reserve ER-46 (Hidegvíz-völgy, Figure 1) was selected for this study, due to its near-natural stand structure. This reserve is a mixed, approx. 85-year-old stand with sessile oak (Quercus petraea), hornbeam (Carpinus betulus), beech (Fagus sylvatica), larch (Larix decidua) and spruce (Picea abies) species. Forest management had been moderate, which resulted in dense forest stand. The spruces are dying of bark beetle damage. The stand has a sparse lower canopy layer consisting of dying birches (Betula pendula), hornbeam and beech. There is a 50 × 50 m sampling grid over the reserve to assign permanent sampling plots for monitoring purposes.
Figure 1. Hidegvíz-völgy forest reserve Figure 2. LMS–Z420i laser scanner Reference measurements including tree position, species, diameter at breast height, and tree height were collected with traditional instruments to verify the models. The coordinates of the trees inside the sample plot were acquired with a Leica 1200 Smart Station. Diameters at breast height were measured with measuring tape. The heights of the tree were measured by a digital photogrammetric workstation, utilising a stereo pair of colour aerial photos with 4 cm ground resolution.
3 METHODS
The introduced algorithms contained all the processing steps to obtain stem models from raw data. Beyond the individual stem models, an accurate digital terrain model (DTM) and a digital crown surface model (DSM) of the sample area were produced. The applied workflow was composed of adopted and self-implemented algorithms. At the beginning of the next sub-sections the basic ideas of the algorithms are described followed by the modification and implementation details. The structure of presented algorithms and their outputs are shown in Figure 3.
Figure 3. The workflow and outputs of the processing
3.1 DTM generation
The filtering of terrain points from raw data is a prerequisite to extract vegetation points and calculate relative heights above the ground. Simonse et al. (2004), Henning and Radtke (2006) propose regular sampling of locally lowest points followed by further filtering tests, e.g. if a point caused steep slopes on the surface, it could be excluded. Bienert (2006) obtained ground points in rough terrain by height-percentiles based filtering. Király and Brolly (2007) introduced a compound grid and TIN based coarse-to-fine iterative method. The first step was to select the lowest points in each cell of a coarse, regular grid. A TIN model was generated from these points and relative heights from the model were calculated for each point. The points with the lowest relative height were selected within each cell of a grid with double resolution then a new TIN model and relative heights were recalculated. The iteration went from 8 m to 0.5 m cell size. The densification of the point cloud would have permitted a better resolution DTM too, but our purposes did not require a more detailed model at the expense of much more processing time. Unfortunately, in the raw data some points situated below the terrain surface were found to be faulty, so some manual selections were also left, before creating the final DTM.
3.2 Stem detection
Measurements not assigned as terrain points can be tagged as vegetation points. Vegetation points contain measurements from stems, branches, foliage, and low vegetation. It is not possible to ascertain which points are measured from the same tree at this stage, so each point has to be assigned to a tree from which it was expectedly reflected. While neither the number nor the coordinates of the trees are known, this classification procedure requires a pattern recognition algorithm. This is a crucial issue while the accuracy of the final stem models depends on the reliability of the point-stem association. There were numerous methods developed in recent years aiming at stem detection from a laser scanning point cloud on automatic or semi-automatic manner (e.g. Aschoff – Spiecker 2004, Bienert 2007, Wezyk at al. 2007, Király – Brolly 2007). Most of the algorithms cut thin, horizontal cross-sectional slices in given heights above the ground from the cloud of vegetation points. The points in the same slice were treated as if they were in the same plane. Two-dimensional pattern recognition techniques were used on the points of the slices, e.g. Hough-transformation (Thies – Spiecker 2004). The effectiveness of automatic stem detecting methods varied between 20-100% depending on stand conditions and scanning parameters.
The tree detection method, which we are presenting in this paper, is a ’coarse to fine’ one, and has a well-separated pre-processing, clustering and classifying stage. The pre-processing and clustering stage are introduced in this section, and resulting in separate point clouds which are treated as stem-candidates. The classifying stage includes different shape fitting procedures that are performed on the points of stem candidates. While shape fitting is not only to verify the stem-candidates, but also to represent the geometry of the stems, these are presented in the next section. In the pre-processing stage those points are selected which heights above the DTM are between 1 and 2 meters. Additionally the absolute heights of these selected points are converted to heights above the ground.
k number of clusters, where the similarity criterion is the horizontal Euclidean distance from the cluster’s centre, and k is a known integer. Unknowns are the centre coordinates of the clusters. The detailed algorithm of k-means clustering is found in e.g. Fogaras – Lukács (2005). Since the number of trees was not known beforehand, some modifications of the classical k-means method were needed. The utilised clustering method was an iterative process, where the number of clusters, and also their centre coordinates had to be globally optimised considering two constrains: the minimal point number and the maximal cluster radius. The former ensures that small objects cannot become stem candidates, the latter guarantees that neighbouring stems are not merged in one cluster. These constraints make the optimisation process unambiguous, and are given as user-defined parameters. The approximate radius of the expected largest stem can be used for estimation of maximal cluster radius. The minimal point number depends on the data capture and can be given through an exploratory visual analysis. In our study the minimal point number was 100, the maximal cluster radius was 0.50 meter.
3.3 Stem modelling
After classifying stem measurements, the cross-section of the bole can be modelled by different geometric shapes, such as circles (Henning et al. 2004, Bienert et al. 2006), free-form curves (Pfeifer 2004), polygons (Wezyk et al. 2007), or cylinders (Pfeifer et al 2004, Hopkinson et al. 2004, Thies 2004). If the filtering has taken place in several heights, vertical approximation of the overlapping shapes is possible. From this model the position coordinates and diameter are available at any given height, out of which the one at breast height has particular importance. The reported accuracies of DBH estimation in the above mentioned studies are comparable to classical forest inventory methods (e.g. caliper, measuring tape). With the evaluation of overlapping shapes the reliability of stem-classification can be enhanced (Aschoff – Spiecker, 2004) and further spatially explicit data, such as tilting angle, stem profile and tapering of the stems become available (Bienert et al. 2007).
In our work the clusters were handled as stem candidates. In the filtering procedure geometric shapes were fitted onto the points of each cluster. In 2D the circle, in 3D the cylinder was chosen as geometric form to describe a stem. In case of circle the shape fitting was performed only at a thin horizontal section of a given height, while cylinders included all points of the clusters. The circle requires 3, the cylinder 5 parameters to be calculated. The parameterisation of circle (Eq. 1) and cylinder (Eq. 2) were the follows:
|| c – p || – r = 0 (1)
where c is a vector (Xc, Yc) pointing to the center of circle,
p (Xp, Yp) is a point on the circle,
r is the radius.
|| (a – q) × n || – r = 0 (2)
Where a is a point (Xa, Ya, Za) on the axis,
q is a point (Xq, Yq, Zq) on the cylinder,
n (Xn, Yn, Zn) is the direction of the axis.
The 7 unknowns (a, n, r) can be reduced to 5 if a is defined on the zero level plane
(Za=0), and n has a length of unit (Thies et al, 2004).
were root mean square error (RMSE) of the shape fitting, and the relationship to the vertical neighbours in the case of multiple height sections (existence, difference of diameters). The right sets of classification parameters depend on the user’s demands. The stricter rules provide fewer results with higher reliability and more precise models.
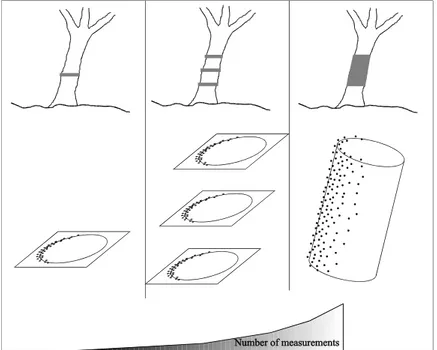
The comparison of the three variants of the above-described algorithms is performed in the following. The variants differ in how much the elevation data are involved in the filtering and classification steps. In the first method the filtering shape was a single circle (SC); the filtering took place only at breast height (1.30 m), in 10 cm thickness. The classification rules were minimal number of measurements: 15 and RMSE < 2.0 cm. In the second method the filtering was implemented in three different heights (1.00 m; 1.50 m; 2.00 m, with 10 cm thickness) independently from each other. This method was called multiple circles (MC). The classification rule was extended with a 5.0 cm threshold of radii’s standard deviation in case of minimal two overlaying circles. The third method, which was called cylinder (CY), read data from 0.95 to 2.05 meters above the ground, and filtered them based on cylinder fitting. The classification rules were minimally 100 measurements, RMSE < 2.0 cm and maximum 45º-axis inclination. In the case of CY, the exact elevation coordinates of the measurements were utilised in a 3D adjustment. The working scheme of the variants can be seen in Figure 4.
Figure 4. Principles of single circle (SC), multiply circles (MC), and cylinder (CY) tree recognition algorithms
3.4 Tree height estimation
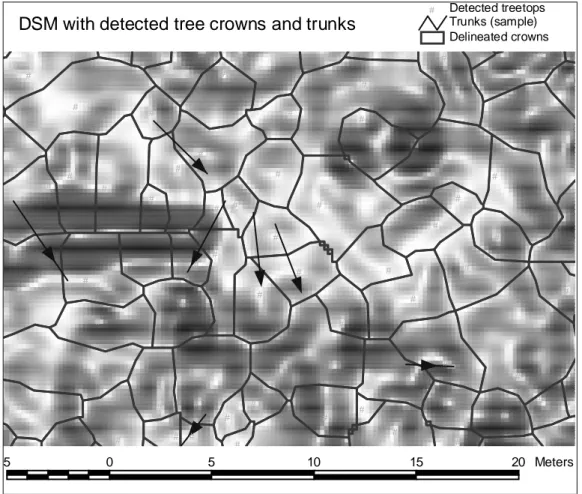
In our work, the surface of the upper crown (DSM) was modelled similarly to the DTM, but without iteration and the absolute highest points were selected within each 0.2 m cell. Unfortunately, the point density in the crown layer did not make it possible to make higher resolution digital surface model. It was very important, however, to smooth the DSM for the automatic tree-tip determination, so a minimum-curvature Spline interpolation was applied. The regularised Spline interpolation creates 1) a surface, which passes exactly through the data points, and 2) a minimum curvature smooth surface with a smooth first-derivative surface (Franke 1982). An inverse watershed modelling was applied to delineate individual tree crowns (Gougeon 1995, Király 1998). In these works, very high resolution aerial images with adequate lighting conditions created the basis. Assuming that the pinnacles of the trees are the brightest points in these images, and are separated by shadow area from each other, the task is to delineate them. Treating the image as an inverse digital terrain model, where the brightest pixels are the lowest points, the individual tree crowns are the watersheds, which can easily be separated by well-known algorithms (Jenson and Domingue 1988). These image-based methods were adopted succesfully on airborne laser scanning data, where the top of the trees were determined on the Digital Surface Modell (Hyyppä et al. (1999)).
# # # # # # # # # # # # # # # # # # # # # # # # # # # # # # # # # # # # # # # # # # # # # # # # # # # # # # # # # # # Delineated crowns Trunks (sample) # Detected treetops
5 0 5 10 15 20 Meters
DSM with detected tree crowns and trunks
Figure 5. Delineated tree crowns and treetops on the shaded DSM (illumination from zenith). Arrows show the leaning directions of the modelled stems
leaning angles are calculated in the course of shape fitting. It was supposed that considering the leaning directions the tree positions and tree tops could be linked with better reliability. As second method that local maximum was accepted as the related tree top, which was horizontally closest to the intersection point of the cylinder’s axis and the DSM.
4 RESULTS AND DISCUSSION
4.1 Tree mapping
The tree mapping covered stem detection and determination of central coordinates of the fitted geometrical forms (Figure 6). The automatic classification of species was not included in the presented algorithms, although would be possible in the future, based on the colour information. A reference height had to be defined on which the planar coordinates were concerned because of the leaning of the stems. When a tree consists of two or more stems forking below breast height, each stem has to be measured separately (Husch et al. 2003). The reference plane of 1.30 meter above the ground seems to be practical because the number of trees and the number of derived DBHs are equal in this case. Table 1 shows the efficiency of the presented three variants. Classification errors were either rejection or misclassification. There were 213 trees, but only 173 (81%) were visible in breast height within 30-meter distance from the instrument. In this way the percentage of rejections involves the omissions due to the data capture and the failures of stem detection algorithms. All the three variants detected the stems with similar reliability, the mean proportion of misclassified stems were below 2.0%. On the other hand, the number of rejected trees depended significantly on the chosen variant. The reason of the different performance between circle-based (SC, MC) and cylinder-based stem detection presumably lies in the degree of freedom of the fitted primitives. All three algorithms worked iteratively, and required as many approximate starting values as the number of freedom of the primitives, which were 3 and 5 in case of circles and cylinders respectively. The starting values were approximated from the clusters statistics. About 10% of the cylinder fitting routines failed at the first iteration that suggested imprecise starting values. These adjustment routines turned to be successful actually when starting-values were more precisely given manually after visual inspection.
Table 1. Reliability of stem detecting algorithms. (SC: single circle in breast height, MC: multiple circles in 3 different heights, CY: cylinder)
SC MC CY
Correct 154 154 134
Rejection 59 59 79
Misclassification 3 0 1
Proportions (%)
Correct 72.3 72.3 62.9
Rejection 27.7 27.7 37.1
Misclassification 1.4 0.0 0.5
4.2 DBH estimation
The comparative evaluation of different stem modelling on DBH estimation can be seen in table 2. The wide error intervals show that gross-errors (absolute errors exceed 3 times standard deviation of errors) were not removed from the statistics, because they can occur in the practical use as well. While these strongly alter the all-over statistics, the distribution of errors is presented in error-classes. The DBH estimations are underestimated significantly (p<0.10) in case of SC and MC models. On the contrary, Simonse et al. (2003), and Bienert et al. (2007) observed overestimations. We assumed the observed underestimations are resulted from the bark-roughness, because both the calliper and the tape measured on the outer surface of the bark, but the laser sampled the rifts, too. To make sure of this hypothesis, the typical smooth-barked beech and the typical rough barked larch were tested (one-tailed t-tests, p<0.10) on SC and MC methods. The mean error of estimations was unbiased for beech (n=30), but negatively biased for larch (n=38) in both methods. Although this supports our assumption, but it have to be noted that larch has often non-circular cross section, due to the varying bark thickness around its perimeter. This may cause errors when circles are fitted. Moreover, the points were projected to the horizontal plane, therefore a leaning stem even with circular cross-section provides elliptical projection, which leads to overestimation. For exact clarification beyond measuring the perimeter, at least the ellipticity has to be recorded, and a more flexible modelling curves – e.g. splines – are required.
Table 2. Accuracy of DBH estimation. Percentages show the presence within the error classes
SC MC CY
Range (cm) 33.3 22.4 59.8
Bias (cm) -0.8 -1.6 0.5
RMSE (cm) 4.2 3.4 7.0
Error classes (%)
+/- 1 cm 23 27 26
+/- 3 cm 60 72 69
+/- 5 cm 84 86 84
+/- 10 cm 97 98 93
problem of higher degrees of freedom also, while algorithms with more variables were more capable to solve the adjustment with noisy, scattered points without decreasing the a-posterior error of adjustment (RMSE of fitting) which had the indicator role in goodness-of-fitting.
4.3 Tree height estimation
The results of the different height calculations can be seen in Table 3.
Table 3. Accuracy of height estimations
SC/MC CY
min (m) -9.90 -5.24
max (m) 0.75 2.28
mean (m) -2.37 -0.27
stdv (m) 2.23 1.8
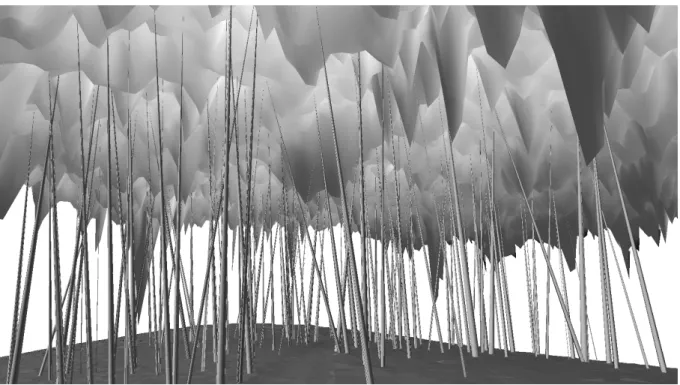
The height estimation without the consideration of leaning (SC/MC) significantly underestimated the height, and there were several deviations bigger than 5 m below zero. The other height estimation (CY) gave better accuracy, but it also gave some outliers as well. When we look at the visualisation of the cylinder method (Figure 7), it apparently gives the impression of over leaning of some trees. Considering that only a one-meter long cylinder defined the leanings, it seems to be promising to estimate the mean direction of the treetop.
Figure 7. Extrapolation of cylindrical models up to the DSM
5 CONCLUSION AND OUTLOOK
detection, although in this stage of the algorithms, visual verification of automatic stem detection is necessary. Stem detecting algorithms had a central role in single tree parameter estimation in considering the reliability of the subsequent model. We attempted to extend the filtering domain with height-related data in automatic stem detecting algorithms, and make a step from 2D through the more complex 3D filtering. Misclassifications were slightly decreased with independent repetition of 2D filtering in more height sections, and the reliability of this method exceeded, surprisingly, even the general 3D filtering. The independence of shape recognition ensures that initial errors are not spread to other height sections, and the sequence of shape parameters can serve as input for further classification criteria. The accuracy of the selected DBH estimation algorithms was in accordance with traditional field methods in most cases. Special strength of the cylinder-based modelling solution is that it can be efficient at non-vertical stems as well, and capable to filter also tilted branches in the crown. The presence of gross errors denotes that high inner accuracy does not guarantee sufficient shape fitting, especially in case of higher degree of freedom. Consequently a more robust technique is necessary in the future for 3D shape fitting to eliminate outliers. Shape fitting approximates the outer surface of the stem but it may differ physically from what classical instruments detect in case of rough barked trees, which might have caused systematic underestimation of DBH in our study. This could be resolved with the modification of the adjustment, e.g. with use of weights, or by residual distribution analysis. One can assume, that RMSE of fitting would have a potential to discriminate specie-groups according to their bark-roughness. The RMSE of fitting depends not only on bark-roughness however, but on the circularity of stem cross-section and on the random error of laser measurements, which are in the same magnitude. The leaning of the axis was obtained in the modelling procedure with the utilisation of height coordinates, which enhanced the tree top localisation on the DSM. The extrapolation from 1-2 m above the ground to the crown, can lead into mismatching of treetops however. Utilisation of a more complex 3D body can improve the results of height calculations, but also can introduce more gross errors by raising the degree of freedom. Another solution would be the reconstruction of the upper parts of the stems, from which not only the leaning, but the curvature could be estimated too.
Acknowledgements: We thank OTKA (Hungarian Scientific Research Fund, ref. No. T048999)
for supporting this work. We also thank PiLine Ltd. for operating the Riegl instrument, processing and providing the laser-scanner data.
REFERENCES
ASCHOFF,T.–SPIECKER,H. (2004): Algorithms for the automatic detection of trees in laser scanner data. In: Proceedings of the ISPRS working group VIII/2, ”Laser-Scanners for forest and Landscape assessment”. Freiburg, Germany. 3-6 October 2004. 71-75.
ASCHOFF, T. – THIES, M. – SPIECKER H. (2004): Describing forest stands using terrestrial laser-scanning. In: Proceedings of the ISPRS working group VIII/2, ”Laser-Scanners for forest and Landscape assessment”. Freiburg, Germany. 3-6 October 2004. 237-241.
BIENERT, A. – MAAS, H. – SCHALLER, S. (2006): Analysis of information content of terrestrial laserscanner point cloud for the automatic determination of forest inventory parameters. In: ”Proceedings of Workshop on 3D Remote Sensing in Forestry”. Wienna, Austria. 14-15 February, 2006. 44-49.
FOGARAS, A. – LUKÁCS, A. (2005): Klaszterezés [Clustering]. In: IVÁNYI, A. (ed): Informatikai algoritmusok 2. ELTE Eötvös Kiadó, Budapest, 1397-1423. (in Hungarian)
FRANKE, R. (1982): Smooth Interpolation of Scattered Data by Local Thin Plate Splines. In: Comp. & Maths. with Applls. 8. (4): 237 – 281
HENNING,J.–RADTKE,P. (2006a): Detailed stem measurements of standing trees from Ground-based Scanning Lidar. Forest Science. 52 (1): 67-80.
HENNING, J.– RADTKE,P. (2006b): Ground-based Laser Imaging for Assessing Three-dimensional Forest Canopy Structure. Photogrammetrical Engineering and Remote Sensing. 72 (12): 1349-1358. HOPKINSON,C.–CHASMER,L.–YOUNG-POW,C.–TREITZ,P. (2004): Assessing forest metrics with a
ground-based scanning LIDAR. Canadian Journal of Forest Research. 34. 573-583.
HUSCH,B.–BEERS,T.–KERSHAW,J.A.(2003): Forest mensuration. John Wiley & Sons, INC. New Jersey. pp. 86
HYYPPÄ, J. – INKINEN, M. (1999): Detecting and estimating attributes for single trees using laser scanner. The Photogrammetric Journal of Finland. 16 (2): 27-43.
JENSON, S. K., DOMINGUE, J. O. (1988): Extracting Topographic Structure from Digital Elevation Data for Geographic Information System Analysis. In: Photogrammetric Engineering and Remote Sensing. 54 (11): 1593-1600
KIRÁLY, G. (1998): Multiscale images in forestry. In: ISPRS International Archieves of Photogrammetry and remote sensing. XXXII, 7. ISPRS Comission VII Symposium on „Resource and Environmental monitoring.” Budapest, Hungary. 1-4 September, 1998. 365-369
KIRÁLY, G.–BROLLY, G. (2007): Tree height estimation methods for terrestrial laser scanning in a forest reserve. In: ”Proceedings of ISPRS Workshop on laser scanning 2007 and SilviLaser.” Espoo, Finland. 12-14 September, 2007. 211-215.
KIRÁLY,G.–BROLLY,G. (2008): Modelling single trees from terrestrial laser scanning data in a forest reserve. The Photogrammetric Journal of Finland. 21 (1): 37-50.
PFEIFER, N. – WINTERHALDER, D. (2004): Modelling of tree cross sections from terrestrial laser scanning data with free-form curves. In: Proceedings of the ISPRS working group VIII/2, ”Laser-Scanners for forest and Landscape assessment”. Freiburg, Germany. 3-6 October 2004. 76-82. PFEIFER,N.–GORTE,B.–WINTERHALDER,D. (2004): Automatic reconstruction of single trees from
terrestrial laser scanner data. ISPRS- International Archives of Photogrammetry, Remote Sensing and Spatial Information Sciences. Vol XXXV, Part B. 114-119.
RIEGL (2007): Data sheet, LMS-Z420i. Online: http://www.riegl.com/terrestrial_scanners/lms-z420i_/420i_all.htm
SIMONSE,M. –ASCHOFF,T.– SPIECKER,H. –THIES,M. (2003): Automatic determination of forest inventory parameters using terrestrial laser scanning. In: ”Proceedings of the ScandLaser Scientific Workshop on Airborne Laser Scanning of Forests”. Umea, Sweden. 2-4 September, 2003. 271-257.
THIES, M.– SPIECKER, H. (2004): Evaluation and future prospects of terrestrial laser scanning for standardized forest inventories. In: Proceedings of the ISPRS working group VIII/2, ”Laser-Scanners for forest and Landscape assessment”. Freiburg, Germany. 3-6 October 2004. 192-198. THIES,M.–PFEIFER N.–WINTERHALDER D.–BEN G. (2004): Three-dimensional reconstruction of
stems for assessment of taper, sweep and lean based on laser scanning of standing trees. Scandinavian journal of forest researche. 19: 571-581.