Heavy metal contents in
Latosols cultivated with vegetable crops
1Laércio Santos Silva2, Izabel Cristina de Luna Galindo3, Clístenes Williams Araújo do Nascimento3,
Romário Pimenta Gomes2, Milton Cesar Costa Campos4, Ludmila de Freitas2, Ivanildo Amorim de Oliveira2
INTRODUCTION
The use of agrochemicals has become a common practice for maintaining high yields and controlling pests and diseases that compromise the productive potential of crops. These practices may lead to soil contamination, due to the accumulation of potentially toxic elements or compounds, such as heavy metals.
ABSTRACT
RESUMO
Increased heavy metal contents in the soil may interfere with crop growth, quantitatively and qualitatively compromising food security. Food chain contamination may harm human health and ecosystems (Lee et al. 2006, Luo et al. 2007, Freitas et al. 2009).
Heavy metals are naturally present in soils and their levels are dependent on the material that originated the soil and the degree of soil development.
1. Manuscript received in Jun./2016 and accepted for publication in Nov./2016 (http://dx.doi.org/10.1590/1983-40632016v4641587). 2. Universidade Estadual Paulista Júlio de Mesquita Filho, Faculdade de Ciências Agrárias e Veterinárias, Departamento de Solos
e Adubos, Jaboticabal, SP, Brazil. E-mails: laerciosantos18@gmail.com, rpgagronomia@gmail.com, ludmilafreitas84@gmail.com, ivanildoufam@gmail.com.
3. Universidade Federal Rural de Pernambuco, Departamento de Agronomia, Recife, PE, Brazil.
E-mails: cwanascimento@yahoo.com, iclgalindo@uol.com.br. Heavy metals are naturally found in soils, but their
levels may increase as a result of anthropogenic actions. This study aimed at determining the concentrations of Cd, Cu, Mn, Ni, Pb and Zn in Yellow Latosol from vegetable crops
areas, as well as the influence of the cultivation and position
in the landscape on the accumulation of these elements. Soil
samples were collected from five farming areas and four areas
with natural vegetation, which served as a reference. Soil was collected along the planting rows from three transect positions (upper, middle and lower sections of the slope), as well as from the upper portion of forest areas, at three depths (0.0-0.10 m, 0.10-0.30 m and 0.30-0.60 m). The results from the chemical analyses indicated that Cd, Cu, Mn, Pb and Zn levels in the soil increased as a result of cultivation. Only Cd and Cu concentrations were above the quality reference values for the Pernambuco State. The multivariate analysis
techniques used were efficient at separating the environments
and at differentiating the origin of the metals. Soils from forest areas were clearly separated from croplands, demonstrating the effect of agricultural practices on the metal contents in the soils. The principal component analysis indicated a predominantly anthropogenic origin (phosphate fertilizing) for Cd, in more
superficial soil samples.
KEYWORDS: Trace metals; multivariate analysis; cadmium.
Teores de metais pesados em Latossolos cultivados com olerícolas
Metais pesados são naturalmente encontrados em solos, mas suas concentrações podem ser aumentadas por meio de ações antrópicas. Objetivou-se determinar as concentrações de Cd, Cu, Mn, Ni, Pb e Zn em Latossolos Amarelos de áreas produtoras de
olerícolas, bem como a influência do cultivo e da posição no relevo
dos solos no acúmulo desses elementos. Amostras de solo foram coletadas em cinco propriedades e quatro áreas com vegetação natural, as quais serviram de referência. O solo foi coletado nos terços superior, médio e inferior da encosta, nas linhas de plantio, e no topo, nas áreas de mata, em três profundidades (0,0-0,10 m; 0,10-0,30 m; e 0,30-0,60 m). Os resultados das análises químicas demonstraram que as concentrações de Cd, Cu, Mn, Pb e Zn nos solos foram aumentadas pelo cultivo. Apenas Cd e Cu estiveram acima do valor de referência de qualidade para Pernambuco. As
técnicas de análise multivariada utilizadas foram eficientes para
separação dos ambientes e para diferenciação da origem dos metais. Os solos nas áreas de mata foram claramente separados das áreas de cultivo, demonstrando o efeito das práticas agrícolas sobre os teores dos metais nos solos. A análise de componentes principais indicou origem predominantemente antropogênica (adubação
fosfatada) para Cd, nas amostras de solo mais superficiais.
Under normal conditions, heavy metals are not found in soils at concentrations that represent a risk to the environment or human health. On the other hand, activities such as mining, waste disposal, atmospheric deposition and intense farming activity may increase heavy metal contents in the soil (Mendes et al. 2006 and 2010, Peris et al. 2007).
Secondary constituents of mineral fertilizers containing phosphate, derived primarily from phosphate rocks, include heavy metals, most notably Cd, Cu and Zn, which are not eliminated in the manufacturing process and accumulate in the soil through successive applications (Agbenin 2002). As such, phosphate fertilizer has been considered an important source of heavy metal contamination in many parts of the world (Micó et al. 2006, Sun et al. 2013, Kelepertzis 2014). Increased Cd content due to phosphate fertilizer in muskmelon crops was reported by Mendes et al. (2006). Freitas et al. (2009) assessed the availability of Cd and Pb in phosphate-fertilized soil and observed increased levels proportional to the doses applied in the soil and in maize plants.
Knowing the origin of heavy metals in the soil is essential to assess their possible impact on the environment and to propose alternatives to the contamination source. Statistical techniques, such as multivariate analysis, may be useful in separating areas and interpreting environmental data, since they help to distinguish between natural contributions of metals in the soil and those from anthropogenic sources (Micó et al. 2006, Naveedullah et al. 2013, Sun et al. 2013, Parelho et al. 2014). This differentiation is important to establish quality reference values for metals in the soil and for assessing the risk of crop or groundwater contamination in agricultural areas. Olericulture, characterized by intensive soil management over small areas of land, is one of the agricultural activities that use the largest amount of agrochemicals. As such, monitoring the soil quality in these areas is vital for risk assessment. For example, Peris et al. (2007) recorded Cu, Pb and Zn enrichment in soil used to grow vegetables in Spain, while Alam et al. (2003) reported the contamination of vegetable species with As, Cd and Pb, in a soil in Bangladesh.
The present study aimed at determining the concentrations of Cd, Cu, Mn, Ni, Pb and Zn in Yellow Latosols under vegetable crops and natural vegetation formed at different positions in the landscape.
MATERIAL AND METHODS
The study was conducted in farming areas of Camocim de São Félix, Pernambuco State, Brazil, in 2011, where the predominant climate is As (rainy tropical climate with dry summer), according to the
Köppen-Geiger classification system. The average
annual temperature is around 24 ºC, ranging 20-22 ºC in the coldest months and 22-33 ºC in the warmest months, with annual rainfall of 900-1,300 mm. Altitudes exceed 600 m, but rarely surpass 1,000 m, with an undulated to sharply undulated relief. The soils in the region are highly to moderately developed. The natural vegetation consists primarily of deciduous and/or semi-deciduous forests (Vieira 2011).
Based on site visits and information from the local branch of the Instituto Agronômico de
Pernambuco and rural farmers, five farming areas
(A1, A2, A3, A4 and A5) with a typical management system for the region and four forest areas (F1, F2, F3 and F4) from fragments of secondary forest vegetation at the top of the slope, which served as local reference areas, were selected. The areas were georeferenced using a Garmin GPS device and eTrex Vista HCx (Table 1).
The soil in the different sampling sites is
classified as Yellow Latosol (Embrapa 2013). This
soil is equivalent to the Xanthic Ferralsol (FAO 1990). With respect to geology, according to Brasil (1973), the soil developed from Precambrian rocks consists of gneisses and granites, with sandy clay material on the surface of some soils (Table 1). As highlighted by Silva et al. (2001), Yellow Latosols occupy the top and upper segments of slopes in the studied areas. Textural differences are due to the possible occurrence of the soil in a transition zone between the two geological materials and their position in the landscape.
Samples were air dried (air-dried fine earth), broken
up and sieved in a 2.00 mm mesh nylon sieve. Latosol samples were chemically characterized (Table 2) in accordance with Embrapa (2011), as it follows: pH: H2O; Ca2+ and Mg2+: extracted using
1 mol L-1 of a potassium chloride solution and
analyzed by titration with EDTA at 0.0125 mol L-1;
H+ + Al3+: extracted using 1 mol L-1 of a calcium acetate
solution at pH 7.0 and determined by titration with NaOH 0.0606 mol L-1; available P- and K+: extracted
with a Mehlich-1solution, where P was measured by colorimetry and K+ by atomic emission spectroscopy;
organic carbon: obtained by the Walkley-Black method. The data obtained were used to calculate the sum of base cations, cation exchange capacity, base saturation (%) and aluminum saturation (%).
For physical characterization, soil samples were collected at depths of 0.0-0.30 m and 0.30-0.60 m, for particle size analysis, using the pipette method and 0.1 mol L-1 of NaOH (Ruiz 2005). The
clay fraction was separated by sedimentation, total sand by sieving, and silt was calculated based on the
difference between them. Soil texture was classified
based on the proportions of sand, silt and clay, using the USDA soil texture triangle (USA) (Table 1).
In order to determine Cu, Mn, Ni, Pb and Zn contents, a 5 cm3 aliquot of soil was ground
using an agate mortar and pestle and sieved in a
0.3 mm mesh stainless steel sieve (ABNT n. 50) to prevent contamination. Soils samples were digested using the USEPA 3051A method (USEPA
1998). Samples of 1 g were placed in Teflon tubes
added with 9 mL of HNO3 and 3 mL of HCl (p.a.). The tubes were maintained in a closed system consisting of a microwave oven (Mars Xpress) at a 8’40’’ temperature ramp, the time required to reach 175 ºC, which was sustained for another 4’30’’. After
cooling, the samples were transferred to certified 25 mL volumetric flasks (NBR ISO/IEC), which
were topped up with distilled water, and the extracts
immediately filtered through qualitative filter paper
(Macherey Nagel®).
Digestion and determination were performed in triplicates, with the first two runs used in calculations and the third in the event of dissimilarity between the values obtained. The Cd, Cu, Mn, Ni, Pb and Zn contents of the extracts were determined
by flame atomic emission spectrometry (AAnalyst 800 Perkin Elmer). The limits of quantification
for the equipment were 0.002, 0.005, 0.05, 0.002, 0.003 and 0.002, respectively for Cd, Cu, Mn, Ni, Pb and Zn. For the quality control of the analysis, a recalibration curve and determination of the metal concentration in spikes samples prepared with analytical standards, whose recoveries ranged 88-102 %, were used.
A1 = area 1; A2 = area 2; A3 = area 3; A4 = area 4; A5 = area 5; F1 = forest 1; F2 = forest 2; F3 = forest 3; F4 = forest 4.
Area Coordinate Altitude_____________ Depth Sand Silt Clay Textural class
m _____________ _______________ g kg-1 _______________
A1 8º22’38.5”S and 35º45’56.9”W 672 0.00-0.30 560 160 280 Sandy clay loam
0.30-0.60 610 100 290
A2 8º22’40.9”S and 35º45’58.2”W 673 0.00-0.30 420 60 520 Sandy clay loam
0.30-0.60 540 240 220
A3 8º20’32.6”S and 35º45’02.1”W 674 0.00-0.30 580 60 360 Sandy loam
0.30-0.60 500 80 420
A4 8º20’33.7”S and 35º45’06.1”W 675 0.00-0.30 730 60 210 Sandy clay
0.30-0.60 560 170 270
A5 8º20’46.3”S and 35º44’49.9”W 688 0.00-0.30 540 120 340 Sandy clay loam
0.30-0.60 730 100 170
F1 8º21’17.0”S and 35º44’46.7”W 691 0.00-0.30 370 60 570 Sandy clay
0.30-0.60 450 160 390
F2 8º21’05.2”S and 35º44’40.9”W 701 0.00-0.30 610 80 310 Sandy clay loam
0.30-0.60 570 120 310
F3 8º20’41.6”S and 35º44’46.9”W 688 0.00-0.30 570 210 220 Sandy clay loam
0.30-0.60 550 120 330
F4 8º20’11.6”S and 35º44’46.6”W 709 0.00-0.30 600 190 210 Sandy clay loam
0.30-0.60 540 90 370
Management techniques were similar for all areas, regardless of the land relief or crop, with consecutive vegetable crops along the transect, use of irrigation, preventive and corrective application of fertilizers and pesticides. The slope was similar in all areas (A1 = 31 %; A2 = 33 %; A3 = 32 %; A4 = 33 %; and A5 = 32 %). Planting was carried out in short, closed level furrows and medium-sized holes, where seeds and/or seedlings, as well as fertilizers, were placed. Mineral and organic fertilizers and pesticides were used in a generalized manner, without technical criteria or agricultural guidance. Farmers were interviewed regarding fertilizer and pesticide application, as well as crops grown in the previous
five years.
In addition to other chemical products, common mineral fertilizers used for vegetable crops include monoammonium phosphate, diammonium phosphate, single superphosphate, urea, NPK formulations (06-24-12; 20-10-20; 10-10-10; 10-20-20; and 20-0-20), potassium chloride, potassium sulfate, micronutrients (FTE), foliar fertilizers (Zn), ammonium sulfate, calcium nitrate and potassium nitrate.
The herbicides and pesticides used include Chess 500 WE, Lannate BR, Malathion 100 EC, Fastac 100, Haiten, Sumidan 25 EC, Ajifol, Manzate WG, Roundup, Polytrin, Quimifol, Trigard 750 WP, Bravonil Utrex, Cercobim 500 SC, Priori Xtra, Score, Cabrio Top, Folicur 200 EC, 22 Captan SC, Cuprozeb, Sumilex, Derosal Plus, Maxin XL,
A1 = area 1; A2 = area 2; A3 = area 3; A4 = area 4; A5 = area 5; F1 = forest 1; F2 = forest 2; F3 = forest 3; F4 = forest 4; U1 = upper 1; U2 = upper 2; U3 = upper 3; U4 = upper 4; U5 = upper 5; S1 = slope 1; S2 = slope 2; S3 = slope 3; S4 = slope 4; S5 = slope 5; L1 = lower 1; L2 = lower 2; L3 = lower 3; L4 = lower 4; L5 = lower 5.
Chemical
attribute Unit
A1 A2 A3 A4 A5 F1 F2 F3 F4
U1 S1 L1 U2 S2 L2 U3 S3 L3 U4 S4 L4 U5 S5 L5 U1 U2 U3 U4
0.0-0.10 m depth
pH H2O 6.1 6.4 6.2 5.2 6.5 6.1 5.7 5.9 5.2 5.6 6.2 5.2 6.5 6.2 6.5 4.8 4.6 4.6 4.2
Ca cmolc dm-3 5.7 5.0 4.1 3.2 4.0 4.5 3.7 3.2 2.6 4.8 4.1 3.3 4.0 5.0 4.5 1.5 1.3 1.0 0.8
Mg cmolc dm-3 1.4 2.2 2.5 2.6 2.7 1.6 1.5 0.8 1.1 2.5 2.3 1.5 3.6 2.9 0.8 3.2 1.5 2.7 3.0
P mg dm-3 172 162 275 275 279 58 109 166 137 149 380 246 146 44 36 8.0 6.0 8.0 5.0
K cmolc dm-3 1.8 1.4 1.6 1.0 2.6 0.1 0.3 0.2 1.0 2.0 2.5 1.6 2.5 2.4 0.9 0.5 0.1 0.2 0.2
OM g kg-1 25.5 25.2 17.8 32.4 23.6 30.3 17.1 13.0 14.8 28.1 24.2 19.1 27.5 24.4 18.9 45.5 43.2 38.6 39.7
H + Al cmolc dm-3 2.15 2.15 1.98 5.61 2.64 3.63 3.80 2.15 2.48 4.62 1.16 1.82 1.82 0.83 2.15 13.53 12.38 5.28 11.39
CEC cmolc dm-3 11.12 10.85 10.28 12.52 12.24 10.17 9.46 6.49 7.23 14.12 10.23 8.27 11.96 11.24 8.31 18.81 15.29 9.37 15.40
m % 1.35 0.92 0.97 0.80 1.23 0.98 1.06 1.54 0.69 1.77 0.98 121 0.84 0.89 0.60 4.25 7.19 7.47 6.17
V % 80.71 80.23 80.74 55.17 78.44 64.29 59.86 66.93 65.79 67.28 88.71 78.04 82.84 92.66 74.20 28.05 19.09 43.65 26.05
0.10-0.30 m depth
pH H2O 6.2 6.6 6.4 5.5 6.4 5.9 6.1 5.7 5.4 5.5 6.6 5.4 6.8 6.4 5.4 4.5 4.6 4.5 4.4
Ca cmolc dm-3 5.4 4.7 4.0 2.7 3.3 4.3 3.2 3.1 2.8 4.0 3.6 2.8 3.6 4.1 3.7 1.3 1.2 1.1 0.6
Mg cmolc dm-3 1.5 3.0 2.1 2.6 3.1 2.9 0.7 0.6 1.2 1.9 1.9 1.4 3.1 0.9 0.4 1.5 2.5 1.6 1.7
P mg dm-3 139 120 287 107 62 45 136 203 132 85 435 176 36 51 20 5.0 4.0 3.0 4.0
K cmolc dm-3 1.3 0.8 1.3 1.7 0.7 0.1 0.1 0.1 0.5 0.5 0.6 0.6 1.7 1.1 0.2 0.6 0.1 0.1 0.1
OM g kg-1 15.8 20.6 19.0 26.1 15.5 19.1 11.9 9.6 11.0 21.1 14.3 12.0 22.5 21.8 24.2 43.2 38.6 32.6 33.4
H + Al cmolc dm-3 1.98 1.98 2.31 5.28 2.31 3.14 1.98 1.98 2.15 4.79 1.16 1.16 2.81 1.65 3.63 14.36 11.88 7.26 8.58
CEC cmolc dm-310.20 10.57 9.70 12.50 9.59 10.55 6.10 5.82 6.68 11.25 7.30 6.12 11.33 7.79 7.98 17.87 15.79 10.11 11.03
m % 1.47 0.95 1.03 0.80 3.13 0.95 1.64 1.72 0.75 2.22 1.37 1.63 1.32 1.28 1.88 7.28 7.28 9.49 13.15
V % 80.59 81.26 76.18 55.77 75.90 70.27 67.51 66.00 67.90 57.47 84.17 81.14 75.24 78.82 54.49 19.66 24.76 27.49 22.18
0.30-0.60 m depth
pH H2O 6.3 6.9 6.4 5.3 6.6 6.8 5.5 5.6 6.5 6.1 6.5 5.9 6.4 6.3 5.1 4.8 4.7 4.3 5.2
Ca cmolc dm-3 5.6 5.7 3.3 2.6 3.3 3.7 2.5 2.4 2.6 4.4 3.5 2.1 2.2 3.5 1.8 1.4 1.2 1.3 0.5
Mg cmolc dm-3 1.6 1.5 1.7 1.5 2.0 0.9 0.7 0.9 0.4 1.2 0.9 1.1 1.9 1.9 0.9 1.5 2.7 1.0 1.4
P mg dm-3 171 185 389 115 35 65 112 112 73 84 340 138 13 14 8.0 6.0 2.0 2.0 2.0
K cmolc dm-3 1.2 0.9 0.6 2.1 0.5 0.0 0.1 0.2 0.3 0.9 0.5 1.6 2.6 0.9 0.1 0.7 0.1 0.1 0.1
OM g kg-1 17.5 15.8 15.9 16.9 14.8 12.0 7.3 5.5 5.5 19.0 8.5 8.0 20.5 22.2 16.0 37.1 35.7 21.9 27.8
H+Al cmolc dm-3 1.82 1.65 1.82 6.27 3.96 1.65 1.65 1.82 1.16 4.62 0.66 0.83 4.46 3.47 5.45 13.20 11.06 8.75 7.26
CEC cmolc dm-310.37 9.92 7.43 12.68 9.93 6.49 5.05 5.35 4.50 11.16 5.69 5.83 11.29 9.76 8.29 16.79 15.15 11.07 9.23
m % 0.48 1.01 3.37 1.58 1.51 1.54 1.98 0.93 1.11 0.45 1.76 0.86 1.77 2.05 8.44 7.74 7.59 12.64 20.05
V % 82.50 83.37 75.56 50.54 60.10 74.59 67.30 66.09 74.35 58.61 88.39 85.82 60.54 64.51 34.34 21.37 27.01 21.02 21.31
Amistar WG, Actara, Karate Zeon 250 CS, Pirate, Decis 25 EC, LoSBan 480, Furadan 350 TS, Dimilin, Marshal 400 SC, Dual Gold, Topik 240 EC, Fusilate 250 EW, Cobra, Roundup Ultra, Goal BR, Diuron, Acephate and Methamidophos.
Historically, the crops cultivated in the studied areas were tomato, cabbage, chard, lettuce, bell pepper, eggplant, maize, São Tomé yam, zucchini,
cauliflower, cilantro, chive, leek, basil, green bean,
chayote, cowpea, medicinal herbs, passion fruit, carrot, strawberry, papaya and ornamental species.
Data were submitted to analysis of variance and means compared by the Tukey test (p = 0.05). Then, multivariate statistical analysis was applied. After standardization of the variables (P, organic matter and heavy metals) to zero mean and unit variance, data were submitted to cluster analysis and principal component analysis. The cluster analysis was composed only by the variables heavy metals, crop areas, depths and landscape segments, while the principal component analysis involved, besides these variables, P and organic matter.
Hierarchical clustering was performed using the Euclidean distance as the similarity measure and the Ward’s method as a clustering strategy (Hair et
al. 2005). Results were presented in graphic form (dendrogram), facilitating the identification of clusters.
Principal component analysis was conducted to obtain a smaller set of linear combinations of variables that preserved most of the information provided by the original variables (Silva et al. 2010). The criteria adopted to select the number of components were those with eigenvalues above 1.00 (Kaiser 1958), and capable of explaining cumulative variance above 70% (Hair et al. 2005). All statistical analyses were processed using the Statistica 7.0 software.
RESULTS AND DISCUSSION
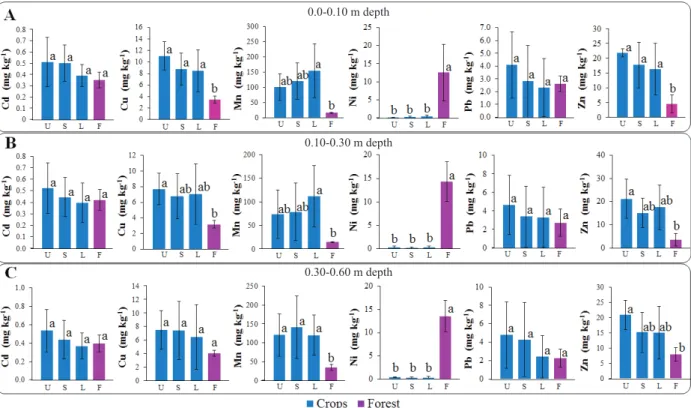
Except for Ni, heavy metal contents in the soil were higher in cultivated areas than those with natural
vegetation, and were influenced by the position of the
transect and depth (Figure 1).
The soil Ni status is highly dependent on its levels in the parent material and anthropogenic additions. As such, Ni content at the surface reflects both soil contamination and formation processes (Kabata-Pendias & Pendias 2001).
Figure 1. Total heavy metal content in Yellow Latosols used for vegetable crops and natural vegetation. F = forest areas. Crop areas:
U = upper; S = slope; L = lower. Means followed by the same letter do not differ significantly (p < 0.05) by the Tukey test.
0.0-0.10 m depth
0.10-0.30 m depth
Nickel concentrations in the soil varied from zero to 18.6 mg kg-1 (Figure 1). Considering that the quality
reference values for Ni in soils of the Pernambuco State is 9 mg kg-1 (Pernambuco 2014), levels of this
element were higher than the quality reference values in 17 soil samples studied. However, it is important to note that no levels exceeded the prevention value of 30 mg kg-1 established by Conama (2009),
above which monitoring of likely contamination is recommended. Moreover, the fact that the Ni content was always higher in forest areas than in cultivated soil reinforces the natural origin of the element.
Decreased Ni levels may occur in cultivated areas due to Ni removal by crops, uptake via agricultural inputs or leaching into deeper soil layers (Mendes et al. 2006, Antoniadis & Tsadilas 2007). In
addition, Ni exhibits greater affinity to soil organic
matter (Senesi et al. 1989), which is found in higher concentrations in soils under natural vegetation (Table 2), and may reduce Ni losses in the system.
Despite Cd, Cu, Mn, Pb and Zn enrichment in the soil, as a result of crops, only Cd and Cu were above the quality reference values (0.5 mg kg-1
and 5 mg kg-1, respectively) for the Pernambuco
State (Pernambuco 2014). Nevertheless, levels of both elements were below the prevention value (1.3 mg kg-1 and 60 mg kg-1, respectively) stipulated
by Conama (2009).
Cadmium is one of the most worrisome
metals, in terms of soil quality, and may be influenced
by the addition of agricultural inputs. Even at low concentrations, its toxicological effects on living organisms are greater than those caused by high levels of other metals. However, the Cd content in this study was below or close to the quality reference values (Figure 1), indicating only minor uptake via non-natural sources. Only in the upper section of the cultivated areas, regardless of depth, the Cd levels were slightly higher than the quality reference value, which is 0.5 mg kg -1 (Pernambuco 2014). In the upper
section, the Cd enrichment in the soil generally results from fertilizers, particularly phosphate fertilizers (Mendes et al. 2006, Freitas et al. 2009).
In general, the Cu content was significantly
higher in the cultivated soil. Increased soil Cu levels are associated with the use of different fungicides, especially Cu-based pesticides (Mirlean et al. 2007, Komárek et al. 2008). Fungicides were routinely applied to vegetable crops and the practice was reported by farmers in the study areas.
The behavior of Zn was similar to Cu, i. e., there was a slight increase in its levels in the cultivated soil. Soil Zn content reached a maximum of 9.4 mg kg-1 in areas with natural vegetation and
36.1 mg kg-1 in cultivated areas (Figure 1). The rise
in total Zn content in cultivated areas, if compared
to forest areas, implies an anthropogenic influence
on the addition of this metal to the soil. Zinc levels in the soil may rise by 0.5-1.0 mg kg-1 year-1, due to
the use of fungicides and fertilizers containing this element (Weingerl & Kerin 2000). The high P content recorded (Table 2) owing to the use of phosphate fertilizers may also be responsible for the increase in Zn, with cultivation.
Despite the significant increase in the Pb content in cultivated soils, all the levels measured were below the quality reference value for the Pernambuco State, which is 13 mg kg-1 (Pernambuco
2014). These low levels may be due to the lack of minerals containing lead in the parent material
(Wuana & Okieimen 2011). Thus, Pb quantified in
soils under cultivated and forest areas comes from the crystalline structure of aluminosilicates, what suggests a sole contribution by the parent material. In this case, as reported by Pereira & Kawamoto (2009), the Pb levels found may be considered a natural effect of the geochemistry in the region, i.e., the Pb content depends solely on the weathering of rocks, with no apparent contaminants present.
The highest Mn levels were recorded in the cultivated areas (Figure 1). The significant increase in the total Mn content in these areas may be due to the management practices adopted for vegetable growing. Levels of a metal added to the soil through waste disposal, agrochemical or atmospheric deposition will rise if it is not removed from the environment through leaching or by crops (Revoredo & Melo 2006). In the cultivated
areas, particularly at the first two depths, Mn levels
were very high, in relation to areas under natural vegetation, what corroborates the inflow of the element via agricultural inputs.
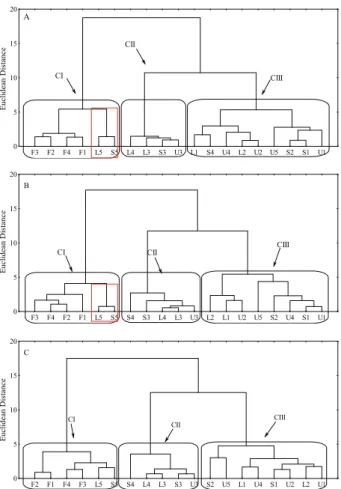
Hierarchical clustering was performed,
obtaining a significant variation in Euclidean distances
for the set of variables considered, enabling the division of groups (Figure 2). A grouping threshold was established at a distance of 5 (for the three depths studied), indicating the formation of three clusters.
and L5, respectively), which were characterized by low Cu and Zn levels (but high Ni content) and low Mn concentrations at the depths of 0.10-0.30 m and 0.30-0.60 m. The low Cu, Mn and Zn values in these environments may be due to the lack of anthropogenic interference in the forest areas studied, while high Ni levels may be the result of losses through cultivation and greater conservation of the element in the forest organic matter.
Cluster 2 (CII) comprised L4, L3, S3 and U3 in the surface layer (0.0-0.1 m). At the remaining depths, in addition to the environments L4, L3, S3 and U3, the slope environment S4 was also present, due to undetected Pb in areas A3 (U, S, L) and A4 (S, L) (Figures 1 and 2). The soil samples L1, L2, U1, U2, U4, U5, S1, S2 and S4 were grouped into Cluster 3 (CIII) owing to the high Cd levels recorded, closer to those in the remaining segments. In the Rio de Janeiro
State, Ramalho et al. (2000) also found a significant
increase in the Cd content in vegetable growing areas where pesticides and phosphate fertilizers were consistently applied.
At depths of 0.0-0.10 m and 0.10-0.30 m in CI, the formation of a subgroup contained L5 and S5 isolated from the forest areas (Figures 2a and 2b), due to the natural condition of the vegetation. Additionally, segments L5 and S5 exhibited high Mn and Pb levels and low organic matter content, what suggests the anthropogenic entry of these metals into the system.
The hierarchical clustering analysis made it possible to visualize the separation of the areas, which were clustered into homogeneous groups based on the degree of similarity. Principal component analysis was also used to identify the variables with the greatest discriminatory potential for each area (Table 3). Eigenvectors may be considered measures of the relative
importance of each variable in relation to the principal components, with positive or negative signs indicating directly or inversely proportional relationships, respectively. As such, the variables that best explain or
PC1 = principal component 1; PC2 = principal component 2.
Element 0.0-0.10 m depth 0.10-0.30 m depth 0.30-0.60 m depth
PC1 PC2 PC1 PC2 PC1 PC2
Cd -0.276874 -0.913311* 0.106639 -0.946914* -0.025578 0.954660*
Mn -0.801896* 0.312220 -0.838754* -0.013336 -0.775034* -0.232562
Cu -0.879429* -0.368087 -0.817376* -0.297410 -0.705077* 0.210315
Pb 0.237896 -0.856666* 0.327121 -0.853841* 0.101933 0.846214*
Zn -0.910359* -0.162453 -0.665659* -0.552064 -0.773248* 0.459801
OM 0.661208* -0.320761 0.823073* -0.116226 0.806761* 0.376390
P -0.859509* -0.074436 -0.845876* 0.205753 -0.413676 0.317507
Ni 0.905545* -0.134937 0.878241* 0.032135 0.931237* 0.096039
Table 3. Correlation between principal components, metal content and organic matter in the soil.
Figure 2. Dendrogram resulting from the Ward’s hierarchical clustering of the soil samples, according to the levels of the different contaminants. A = 0.0-0.10 m depth; B = 0.10-0.30 m depth; C = 0.30-0.60 m depth. Segments: upper (U1, U2, U3, U4 and U5); slope (S1, S2, S3, S4 and S5); forest (F1, F2, F3 and F4); lower (L1, L2, L3, L4 and L5).
F3 F2 F4 F1 L5 S5 L4 L3 S3 U3 L1 S4 U4 L2 U2 U5 S2 S1 U1 0
5 10 15 20
E
u
c
li
d
e
an
D
is
tan
c
e
CI
CII
CIII A
F3 F4 F2 F1 L5 S5 S4 S3 L4 L3 U3 L2 L1 U2 U5 S2 U4 S1 U1 0
5 10 15 20
E
u
cl
id
ea
n
D
is
ta
n
c
e
CI CII
CIII B
F2 F1 F4 F3 L5 S5 S4 L4 L3 S3 U3 S2 U5 L1 U4 S1 U2 L2 U1 0
5 10 15 20
E
u
c
li
d
e
an
D
is
tan
c
e
CI
CII CIII
most contribute to the total variance of data were the same for all three depths: Mn, Cu, Zn, organic matter and Ni for the principal component 1 (PC1), and Cd and Pb for the principal component 2 (PC2).
The first principal component distinguishes
between crop and forest soil samples, and is highly
influenced by organic matter and Ni, which has great affinity for binding with organic matter. On
the other hand, PC2 suggests an anthropogenic
influence for the Cd content, whose accumulation
may occur via phosphate fertilization. Cadmium concentrations above the natural levels expected for the areas (Figure 1) and the quality reference values for soils in the Pernambuco State (Pernambuco 2014) corroborate this observation.
With respect to the percentage variance
explained by the first principal components, PC1
and PC2 account for 79.11 % at depths of 0.0-0.10 m (54.68 % in PC1 and 24.43 % in PC2), 77.17% at 0.10-0.30 m (51.22 % in PC1 and 25.95 % in PC2) and 69.81 % at 0.30-0.60 m (42.45 % in PC1 and 27.36 % in PC2), respectively (Figure 3).
These results demonstrate the potential of the principal component analysis for this kind of study, reducing the initial seven variables analyzed to only two, which represent well the variance in the original data. There is a clear relationship between Ni and organic matter content in forest areas (L5 and
S5). This is due to the high affinity of Ni for organic
compounds, such as fulvic and humic acids (Smith 2009, Violante et al. 2010).
By contrast, the segments L1, L2, U1, U2, U4, U5, S1 and S2 were correlated with Cd, Cu, Pb, Zn and P, indicating that these elements may have a common origin via inputs applied to the areas and/ or mixed origins (natural and anthropogenic). This
reflects the addition of primarily phosphate fertilizers,
since heavy metals are accessory metals in phosphate rocks and are not eliminated in the manufacturing process (Camargo et al. 2000, Costa 2009).
However, given the low P content observed in the forest soil and the low mobility of the element
in the soil, it could not be identified at the depth of
0.30-0.60 m for PC1 and PC2. This demonstrates
that P does not reflect a natural environment and that
the high levels measured (> 40 mg dm-3) (Table 2),
considered excessive by Faria et al. (2007) for sandy and clay soils, are of anthropogenic origin. This fact
is corroborated by the findings by Costa (2009) and
Silva et al. (2010).
Figure 3. Principal component analysis of elements means in the soil. A = 0.0-0.10 m depth; B = 0.10-0.30 m depth; C = 0.30-0.60 m depth.
Cd Mn Cu Pb Zn OM P Ni
-1.0 -0.5 0.0 0.5 1.0
Principal Component 1: 42.45%
-1.0 -0.5 0.0 0.5 1.0 P
rincipal Component 2: 27.
36% U1 S1 L1 L3 C F2 F4 F3 F1 L5 L4 L2 S5 S4 S3 S2 U5 U4 U3 U2 Cd Mn Cu Pb Zn OM P Ni
-1.0 -0.5 0.0 0.5 1.0
Principal Component 1: 51.22%
-1.0 -0.5 0.0 0.5 1.0
Principal Component 2: 25.
95% U1 S1 L2 F1 B
F4F2F3 L5 L4 L3 L1 S5 S4 S3 S2 U5 U4 U3 U2 Cd Mn Cu Pb Zn OM P Ni
-1.0 -0.5 0.0 0.5 1.0
Principal Component 1: 54.68%
-1.0 -0.5 0.0 0.5 1.0 P
rincipal Component 2: 24.
CONCLUSIONS
1. Concentrations of Cd, Cu, Mn, P and Zn in cultivated soils are higher than those observed in areas with natural vegetation. This increase is
influenced by the soil depth and its position in the
transect;
2. The multivariate analysis techniques used are efficient at separating the environments and differentiating the origin of metals. The forest areas are clearly separated from croplands, demonstrating the effect of agricultural practices on the soil metal content and organic matter; 3. Principal component analysis indicated a primarily
anthropogenic origin only for Cd, in the most
superficial soil layer. The remaining heavy metals
showed low contamination risk and are originated primarily from the soil parent material.
REFERENCES
AGBENIN, J. O. The distribution and dynamics of chromium and nickel in cultivated and uncultivated semi-arid soils from Nigeria. Science of the Total Environment, v. 300, n. 1-3, p. 189-199, 2002.
ALAM, M. G. M.; SNOW, E. T.; TANAKA, A. Arsenic and heavy metal contamination of vegetables grown in Samta Village, Bangladesh. The Science of the Total Environment, v. 308, n. 1-3, p. 83-96, 2003.
ANTONIADIS, V.; TSADILAS, C. D. Sorption of cadmium, nickel, and zinc in mono and multimetal systems. Applied Geochemistry, v. 22, n. 11, p. 2375-2380, 2007.
BRASIL. Ministério da Agricultura e Reforma Agrária.
Levantamento exploratório: reconhecimento de solos do
Estado de Pernambuco. Rio de Janeiro: DNPEA, 1973.
CAMARGO, M. S. et al. Adubação fosfatada e metais pesados em Latossolo cultivado com arroz. Scientia Agricola, v. 57, n. 3, p. 513-518, 2000.
CONSELHO NACIONAL DO MEIO AMBIENTE (Conama). Resolução nº 420, de 28 de dezembro de 2009. Dispõe sobre critérios e valores orientadores de qualidade do solo quanto à presença de substâncias químicas e estabelece diretrizes para o gerenciamento ambiental de áreas contaminadas por essas substâncias em decorrência de atividades antrópicas. 2009. Available at: <http://www.
mma.gov.br/port/conama/legiabre.cfm?codlegi=620>. Access on: 12 Nov. 2016.
COSTA, W. P. L. B. Alterações na fertilidade do solo e teores de metais pesados em solos cultivados com videira.
2009. 80 f. Dissertação (Mestrado em Agronomia) - Universidade Federal Rural de Pernambuco, Recife, 2009.
E M P R E S A B R A S I L E I R A D E P E S Q U I S A AGROPECUÁRIA (Embrapa). Manual de métodos de análise de solo. 3. ed. Rio de Janeiro: Embrapa Solos, 2011.
E M P R E S A B R A S I L E I R A D E P E S Q U I S A AGROPECUÁRIA (Embrapa). Sistema brasileiro de
classificação de solos. 3. ed. Brasília, DF: Embrapa, 2013. FARIA, C. M. B. et al. Alterações em características de solos do submédio São Francisco sob diferentes sistemas de cultivo. Petrolina: Embrapa Semiárido, 2007.
FOOD AND AGRICULTURE ORGANIZATION OF THE UNITED NATIONS (FAO). Soil map of the world. Rome: FAO, 1990.
FREITAS, E. V. S. et al. Disponibilidade de cádmio e chumbo para milho em solo adubado com fertilizantes fosfatados. Revista Brasileira de Ciência do Solo, v. 33, n. 6, p. 1899-1907, 2009.
HAIR, J. F. et al. Análise multivariada de dados. 5. ed. São Paulo: Bookman, 2005.
KABATA-PENDIAS, A.; PENDIAS, H. Trace elements in soils and plants. 3. ed. Boca Raton: CRC Press, 2001.
KAISER, H. F. The varimax criterion for analytic rotation in factor analysis. Psychometrika, v. 23, n. 3, p. 187-200, 1958.
KELEPERTZIS, E. Accumulation of metals in agricultural soils of Mediterranean: insights from Argolida basin, Peloponnese, Greece. Geoderma, v. 221-222, n. 1, p. 82-90, 2014.
KOMÁREK, M. et al. Copper contamination of vineyard soils from small wine producers: a case study from the Czech Republic. Geoderma, v. 147, n. 1-2, p. 16-22, 2008.
LEE, C. S. et al. Metal contamination in urban, suburban, and country park soils of Hong Kong: a study based on GIS and multivariate statistics. Science of the Total Environment, v. 356, n. 1-3, p. 45-61, 2006.
LUO, W. et al. Effects of land use on concentrations of metals in surface soils and ecological risk around Guanting Reservoir, China. Environmental Geochemistry and Health, v. 29, n. 6, p. 459-471, 2007.
MENDES, A. M. S. et al. Acúmulo de metais pesados e alterações químicas em Cambissolo cultivado com meloeiro. Revista Brasileira de Engenharia Agrícola e Ambiental, v. 14, n. 8, p. 791-796, 2010.
MICÓ, C. et al. Assessing heavy metal sources in agricultural soils of a European Mediterranean area by multivariate analysis. Chemosphere,v. 65, n. 5, p. 863-72, 2006.
MIRLEAN, N.; ROISENBERG, A.; CHIES, J. O. Metal contamination of vineyard soils in wet subtropics (southern Brazil). Environmental Pollution, v. 149, n. 1, p. 10-17, 2007.
NAVEEDULLAH, N. et al. Risk assessment of heavy metals pollution in agricultural soils of siling reservoir watershed in Zhejiang province, China. BioMed Research International, v. 2013, n. 1, p. 1-10, 2013.
PARELHO, C. et al. Linking trace metals and agricultural land use in volcanic soils: a multivariate approach. Science Total Environment, v. 496, n. 14, p. 241-247, 2014.
PEREIRA, S. F. P.; KAWAMOTO, M. S. Estudo químico da concentração total de Fe, Mn, Zn e Cu presentes em sedimentos de margem da região da Volta Grande do rio Xingu - Pará. In: CONGRESSO BRASILEIRO DE CIÊNCIA DO SOLO, 32., 2009, Fortaleza. Anais... Fortaleza: Universidade Federal do Ceará, 2009. 1 CD-ROM.
PERIS, M. et al. Heavy metal contents in horticultural crops of a representative area of the European Mediterranean region. Science of the Total Environment, v. 378, n. 1-2, p. 42-48, 2007.
PERNAMBUCO. Agência Estadual de Meio Ambiente.
Instrução normativa n. 007/2014. Estabelece os valores de referência da qualidade do solo (VRQ) do Estado de Pernambuco quanto à presença de substâncias químicas para o gerenciamento ambiental de áreas contaminadas por essas substâncias. Recife: CEPE, 2014.
RAMALHO, J. F. G. P.; AMARAL SOBRINHO, N. M. B. do; VELLOSO, A. C. X. Contaminação da microbacia de Caetés com metais pesados pelo uso de agroquímicos.
Pesquisa Agropecuária Brasileira, v. 35, n. 7, p. 1289-1303, 2000.
REVOREDO, M. D.; MELO, W. J. Disponibilidade de níquel em solo tratado com lodo de esgoto e cultivado com sorgo. Bragantia, v. 65, n. 4, p. 679-685, 2006.
RUIZ, H. A. Incremento da exatidão da análise granulométrica do solo por meio da coleta da suspensão (silte + argila). Revista Brasileira de Ciência do Solo, v. 29, n. 2, p. 297-300, 2005.
SENESI, N. et al. Chemical properties of metal-humic fractions of a sewage sludge-amended Aridisol. Journal of Environmental Quality, v. 18, n. 2, p. 186-194, 1989.
SILVA, A. B. et al. Principais características do sistema de produção de hortaliças no município de Camocim de São Félix - Pernambuco. Rio de Janeiro: Embrapa Solos, 2001.
SILVA, J. P. S. Fertilidade dos solos e metais pesados em cultivos de mangueira em Petrolina (PE).2010. 99 f. Dissertação (Mestrado em Agronomia) - Universidade Federal Rural de Pernambuco, Recife, 2010.
SMITH, S. R. A critical review of the bioavailability and impacts of heavy metals in municipal solid waste composts compared to sewage sludge. Environment International, v. 35, n. 1, p. 142-156, 2009.
SUN, G. et al. Characterizing PM2.5 pollution of a subtropical metropolitan area in China. Atmospheric and Climate Sciences, v. 3, n. 1, p. 100-110, 2013.
UNITED STATES ENVIRONMENTAL PROTECTION AGENCY (USEPA). Method 3051a: microwave assisted acid digestion of sediments. Washington, DC: U. S. Government Printing Office, 1998.
VIEIRA, L. P. Acumulação de nutrientes e metais pesados em solo, água e hortaliças em áreas cultivadas
com olerícolas no agreste de Pernambuco. 2011. 114 f.
Dissertação (Mestrado em Ciência do Solo) - Universidade Federal Rural de Pernambuco, Recife, 2011.
VIOLANTE, A. et al. Mobility and bioavailability of heavy metals and metalloids in soil environments. Journal of Plant Nutrition and Soil Science, v. 10, n. 3, p. 268-292, 2010.
WEINGERL, V.; KERIN, D. Distribution of zinc in vineyard areas treated with zinc containing phytopharmaceuticals.
Acta Chimica Slovenica, v. 47, n. 4, p. 453-467, 2000.