Dietary glycerin does not affect meat quality of Ile de France lambs
Thiago Henrique Borghi1, Américo Garcia da Silva Sobrinho2, Nivea Maria Brancacci Lopes Zeola2, Fabiana Alves de Almeida3, Luís Gabriel Alves Cirne4, Ana Rebeca Castro Lima1
1 Universidade Estadual Paulista, Faculdade de Ciências Agrárias e Veterinárias, Programa de Pós-graduação em Zootecnia, Jaboticabal, SP, Brazil.
2 Universidade Estadual Paulista, Faculdade de Ciências Agrárias e Veterinárias, Departamento de Zootecnia, Jaboticabal, SP, Brazil. 3 Universidade Estadual Paulista, Instituto de Biociências, Departamento de Parasitologia, Botucatu, SP, Brazil.
4 Universidade Federal do Oeste do Pará, Instituto de Biodiversidade e Floresta, Santarém, PA, Brazil.
ABSTRACT - The objective of this study was to evaluate the physicochemical and nutritional characteristics of meat from three muscles of Ile de France lambs fed diets containing different levels of glycerin as an alternative to corn. Thirty non-castrated feedlot Ile de France lambs weighing 15±0.2 kg were housed in individual pens and slaughtered at 32±0.2 kg. Treatments consisted of three diets: sugarcane + 0% glycerin; sugarcane + 10% glycerin; and sugarcane + 20% glycerin; and three muscles were evaluated: triceps brachii, semimembranosus, and longissimuslumborum. No interactions were observed among glycerin levels and muscle types for the quality characteristics evaluated. Muscles were similar in terms of physicochemical and nutritional characteristics, and only differed in sarcomere length, diameter of muscle fibers, and cholesterol content. Dietary glycerin did not affect pH, water holding capacity (24 h and 30 days after slaughter), weight loss by thawing and cooking, shear force, diameter of muscle fibers, sarcomere length, lipid oxidation, chemical composition, or meat cholesterol content. Dietary glycerin resulted in a linear decrease of muscle yellowness from 3.99 to 3.29. Dietary glycerin altered intramuscular fat fatty acid profile, increasing the concentration of margaric acid (1.47 to 2.61%). Up to 20% glycerin can be included in the diet of feedlot lambs without any harm to meat quality.
Key Words: co-products, fatty acids, glycerol, muscles, omega-3
ISSN 1806-9290
www.sbz.org.br R. Bras. Zootec., 45(9):554-562, 2016
Received March 10, 2016 and accepted June 16, 2016. Corresponding author:thiagoborghi@zootecnista.com.br http://dx.doi.org/10.1590/S1806-92902016000900008
Copyright © 2016 Sociedade Brasileira de Zootecnia. This is an Open Access article distributed under the terms of the Creative Commons Attribution License (http://creativecommons.org/licenses/by/4.0/), which permits unrestricted use, distribution, and reproduction in any medium, provided the original work is properly cited.
Introduction
The demand for animal protein has increased worldwide in the past decades (Tilman and Clark, 2014). This recent development has pushed producers in the search for better and cheaper practices. Specifically in Brazil, the intensification of sheep farming and the introduction of genetically improved breeds have resulted in increased productivity. In parallel, farmers have sought diet formulations that meet high-performance animal needs. Better diets shorten time to slaughter and produce better-quality lambs for an ever-more demanding consumer market. This production system is costly, and the use of alternative feeds that do not affect meat quality is greatly needed. The growing Brazilian biodiesel industry has become a source of the alternative feed glycerin, a biodiesel co-product that can substitute corn and sorghum with the
advantage of being sweet-tasting and well accepted by animals (Schröder and Südekum, 1999).
Several researchers have evaluated the effects of different levels of glycerin on feedlot lamb performance (Musselman et al., 2008; Gunn et al., 2010; Gomes et al., 2011; Lage et al., 2014a). However, few studies have focused on the potential changes in meat quality and nutritional value brought about by dietary glycerin (Françozo et al., 2013; Bartoñ et al., 2013; Lage et al., 2014b). A potential effect of dietary glycerin for ruminant meat quality is the increased availability of gluconeogenic compounds, which allow for a greater deposition of intramuscular fat (Mach et al., 2009). Krueger et al. (2010) demonstrated that the addition of glycerin to ruminant diets alters the meat fatty acid profile because glycerol suppresses ruminal lipolysis. More recently,
a study using in vitro simulations further indicated that
dietary glycerin reduces ruminal lipolysis without adversely affecting ruminal digestion, and this fact could indeed alter meat fatty acid profiles (Edwards et al., 2012).
from three muscles of Ile de France lambs fed diets containing different levels of glycerin as an alternative energy source to corn.
Material and Methods
The experiment was conducted in the city of Jaboticabal, SP, Brazil, with geographic coordinates 21º14'05" S latitude, 48º17'09" W longitude, 615.01 m altitude, atmospheric pressure of 944.3 hPa, average temperature 22.2 ºC, relative humidity of 72.5%, and precipitation of 1453.4 mm, and complied with the guidelines set by the Ethics Committee in Animal Use (case no. 005962/12). Thirty newly weaned 45-day-old uncastrated male Ile de France lambs with 15±0.2 kg body weight were used. The animals were individually identified, dewormed, and housed in 1.0
m2 individual pens, installed in a shed, with suspended
slatted floor and equipped with feeders and drinkers. These lambs were randomly distributed into three experimental groups with ten animals each. The following treatments were studied: sugarcane + 0% glycerin; sugarcane + 10% glycerin; and sugarcane + 20% glycerin, based on the dry matter of the diets.
The concentrate was composed of ground corn grain, soybean meal, urea, dicalcium phosphate, limestone, and
mineral and vitamin supplements. The glycerin (83.90% glycerol, 12.31% moisture, and 3.79% salts) was weighed and mixed with the concentrate at the time of supplying the diets for lambs. The IAC 86-2480 sugarcane (developed by the Agronomical Institute of Campinas for use in animal feed due to the low amount of fiber compared with other varieties) was chopped to 1.0 cm pieces and supplied fresh. The resulting diets (Tables 1 and 2) had similar protein (16%) and energy (3.35 Mcal metabolizable energy/kg DM) contents and were prepared in accordance with the NRC (2007) recommended requirements for weaned lambs, for an estimated weight gain of 250 g/day. The roughage:concentrate ratio was 50:50 and the diets were fed ad libitum (at least 10% was left over) at 7.00 h and 17. 00 h.
The lambs were weighed fortnightly to evaluate the performance, and when they reached 32.0±0.2 kg of body weight (slaughter criteria) and 127±9 days of age they were fasted for solid foods for 16 h and slaughtered. The feedlot period lasted 91 days, with 14 days of adaptation and 77 of data collection.
The slaughter occurred after stunning with a concussion gun, model TEC PC 10. The jugular veins and carotid arteries were sectioned for bleeding, with subsequent
Table 1 - Percentage of ingredients and chemical composition of diets (DM basis)
Composition Glycerin (% DM)
0 10 20
Ingredient, % DM
Sugarcane 50.00 50.00 50.00
Glycerin1 0.00 10.00 20.00
Corn grain 25.43 13.69 1.04
Soybean meal 21.77 23.71 26.50
Dicalcium phosphate 0.28 0.22 0.18
Calcium carbonate 0.57 0.43 0.33
Mineral-vitamin supplements2 0.95 0.95 0.95
Urea 1.00 1.00 1.00
Chemical composition
Dry matter3 40.89 41.04 40.97
Organic matter4 94.66 93.28 91.83
Mineral matter4 5.34 6.72 8.17
Crude protein4 16.53 16.74 16.90
Ether extract4 1.96 1.10 0.63
Neutral detergent fiber 29.37 29.53 29.04
Acid detergent fiber 12.34 13.17 12.05
Total carbohydrates 78.87 75.98 72.11
Non-fiber carbohydrates5 56.35 52.81 51.74
Gross energy (Mcal/kg DM) 3.88 3.99 3.72
DM - dry matter; NDF - neutral detergent fiber.
1 Glycerin = 83.90% glycerol, 12.31% moisture, and 3.79% salts.
2 Guaranteed levels per kg of product: 120 g Ca; 90 g Cl; 62 g Na; 54 g Mg; 50 g
P; 34 g S; 1,600 mg Zn; 1,500 mg Mn; 1,064 mg Fe; 730 mg F (Max); 50 mg Cu; 25 mg I; 20 mg Se; 10 mg Co; 100,000 IU vitamin A; 40,000 IU vitamin D3; and 600 IU vitamin E.
3 %. 4 % DM.
5 Non-fiber carbohydrates = 100 − (crude protein + ether extract + mineral matter + NDF).
Table 2 - Percentage composition of fatty acids in diets
Fatty acid (%) Glycerin (% DM)
0 10 20
Saturated
Capric (C10:0) 0.04 0.03 0.03
Lauric (C12:0) 0.11 0.10 0.17
Myristic (C14:0) 0.26 0.23 0.39
Pentadecanoic (C15:0) 0.11 0.07 0.10
Palmitic (C16:0) 17.21 19.08 22.98
Margaric (C17:0) 0.20 0.15 0.20
Stearic (C18:0) 4.36 4.68 4.27
Arachidic (C20:0) 0.87 0.77 0.73
Behenic (C22:0) 0.35 0.38 0.49
Tricosanoic (C23:0) 0.14 0.14 0.15
Lignoceric (C24:0) 0.60 0.54 0.54
Monounsaturated
Palmitoleic (C16:1) 1.40 1.87 0.91
Heptadecenoic (C17:1) 0.07 0.08 0.11
Oleic (C18:1ω9) 31.61 31.19 30.10
Cis-vaccenic (C18:1 ω7) 0.98 0.88 0.93
Eicosenoic (C20:1 ω9) 0.39 0.37 0.38
Polyunsaturated
Linoleic (C18:2 ω6) 38.82 36.65 35.07
α-linolenic (C18:3 ω3) 2.19 2.56 2.18
γ-linolenic (C18:3 ω6) 0.04 0.04 0.03
Eicosadienoic (C20:2) 0.21 0.16 0.21
Eicosatrienoic (C20:3 ω6) 0.04 0.03 0.03
Omega-31 (ω3) 2.19 2.56 2.18
Omega-62 (ω6) 38.90 39.72 35.13
Omega-6:Omega-3 (ω6:ω3) 17.76 15.51 16.11 DM - dry matter.
1 ω3 = (C18:3 ω3).
evisceration and removal of the head and ends of the limbs, according to procedures characterizing humane slaughter. The carcasses were identified with the animal number and stored in a cold chamber (6 °C) for 24 h.
After 24 h, we measured the pH and color of the
triceps brachii (early development), semimembranosus
(intermediate), and longissimus lumborum (late) muscles.
The pH was measured, in triplicate, with a digital pH meter, Testo 205, equipped with a penetrating electrode. The meat color was determined 30 min after sectioning the samples, to expose the myoglobin to oxygen, as described by Cañeque and Sañudo (2000), using a colorimeter, model Minolta CR-400, illuminant D65, evaluating the lightness (L*), redness (a*), and yellowness (b*). The color aspects were assessed by the CIELAB color system using 0º/45º.
The carcasses were divided longitudinally and the three muscles of the half-carcasses were marked, stored in plastic bags, vacuum-packed and frozen at −18 °C for later analysis. For the qualitative analysis, the muscles were thawed at 10 °C in a BOD incubator for 12 h, with the exception of the samples for determination of thawing loss (30 days after being frozen – TL30D), which remained in the BOD incubator at 5 °C for 16 h and were weighed before and after this period, according to the methodology described by Koohmaraie et al. (1998).
To determine the water holding capacity (WHC), 2 g of the samples were collected and subjected to 10 kg of pressure for 5 min. The WHC value was determined as the difference between the weight of the sample before and after pressure (Hamm, 1986). The results were expressed in percentage of water retained in relation to the initial weight of the sample. The cooking weight loss (CWL) was determined using thawed samples, as the difference between the weight of a steak before and after cooking in an oven pre-heated to 175 °C. A thermometer was used to monitor the internal temperature of the steak until the center reached 71 °C. Subsequently, each steak was conditioned to room temperature, and after temperature stabilization, the steak was weighed to obtain the CWL, in percentage. The shear force (SF) was obtained from the same samples used for the CWL. Six cylindrical samples per steak, with 1.27 cm diameter (Wheeler et al., 1995), free of visible fat and connective tissue, were obtained from the center of the cooked samples, with the direction of the muscle fibers parallel to the length. The cylinders were completely sheared perpendicularly to the muscle fibers with a Warner-Bratzler blade of 1.016 mm at a speed of 300 mm/min, using a Texture Analyser, model Brookfield CT3 10K.
Five-gram samples of muscle were taken for measurement of sarcomere length and diameter of the
muscle fibers. The samples were placed in plastic containers with 10% buffered formalin (50 mL) and, after mounting, they were cleaved, dehydrated, cleared, embedded in paraffin, and sectioned in micrometers (Pika–Seiko), with a thickness of eight micra. Histological sections (longitudinal and transverse) were stained with Mallory’s phosphotungstic acid haematoxylin, according to the technique recommended by Behmer et al. (1976). The slides were assessed under an optical microscope (model Olympus BX51) coupled to an Olympus DP72 model camera, with the methods being based on 10 sarcomere counts of five different myofibrils (50 sarcomeres) and 50 fiber diameters (random). Morphometric analysis of sarcomere lengths and diameters of the fibers was performed using the ImageJ computer program.
The lipid oxidation was determined in accordance with the methodologies proposed by Pikul et al. (1989).
Samples of the muscles were lyophilized for 72 h and then milled in a ball mill to obtain the laboratory samples. These samples were used to determine the chemical composition of the meat in terms of moisture (930.15), protein (954.01), fat (920.39), and ash (942.05), in accordance with the AOAC (1995) methods for meat.
Lipid extraction was performed as described by Bligh and Dyer (1959) to determine the fatty acid profile. Ten grams of raw meat were subjected to lipid extraction using chloroform and methanol in the proportion of 2:1. Following this, an aliquot of 5 mL of the chloroform extract was evaporated using gaseous nitrogen and was subjected to saponification using 12% potassium hydroxide solution in ethanol. The extracted lipids were converted to fatty acid methyl esters following the technique of Hartman and Lago (1973) and were analyzed using a Shimadzu 14B gas chromatograph, equipped with a flame ionization detector and fused silica capillary column (OMEGAWAX250, size: 30 m × 0.25 mm × 0.25 μm, cat. No. 24136-SUPELCO). The injector and detector temperatures were 250 °C and 280 °C, respectively, and the helium flow ratio was 1 mL/ min. After the injection (1 μL), the column temperature was held at 100 °C for 2 min, and then increased to 220 °C at 4 °C/min. The temperature was then kept at 220 °C for 25 min. The peaks were identified by comparing retention times with the standards for fatty acid methyl esters from Sigma.
Determination of the cholesterol content of the muscles
was performed by spectrophotometry (Spectronic® 20 -
gas, followed by addition of 10 mL of 12% KOH in 90% ethanol. The solution was then placed in a water bath at 80 °C and agitated for 15 min. At the end of this process, 5 mL of water were added, and after cooling, 10 mL of hexane were added and the solution was agitated by vortexing. After separation of the phases, a 10-mL sample was dried using nitrogen gas. Finally, 6 mL of acetic acid saturated with concentrated ferrous sulfate were added. Once cooled, the absorbance was determined at 538 nm.
The atherogenicity (AI) and thrombogenicity (TI) indices were calculated as described by Ulbricht and Southgate (1991), and the activity of the ∆9-desaturases (C16 and C18) and elongase enzymes, in accordance with Malau-Aduli et al. (1997).
The experimental design was completely randomized, with three treatments (three levels of glycerin) evaluated in
three different muscles (triceps brachii, semimembranosus,
and longissimus lumborum) with 10 replications each. The muscle factor was considered a longitudinal factor (repeated measures). The data were analyzed using the MIXED procedure of SAS (Statistical Analysis System, version 9.1) and subjected to analysis of variance. The glycerin content was broken down into linear or quadratic effects and muscle types were compared by Tukey’s test. Significant differences were declared at P<0.05.
The mathematical model used was:
Yijk = µ + TGi + TMj + (TG × TM)ij + eijk,
in which Yijk = observed value of the variable that received
glycerin content i, muscle j, and repetition k; µ = overall
mean; TGi = level of glycerin i, ranging between 1 and 3
(0, 10, and 20% inclusion of glycerin); TMj = type of muscle
j (triceps brachii, semimembranosus, and longissimus
lumborum); (TG × TM)ij = effect of interaction between the
glycerin content i and muscle type j; and eijk = random error
associated with each observation.
Results
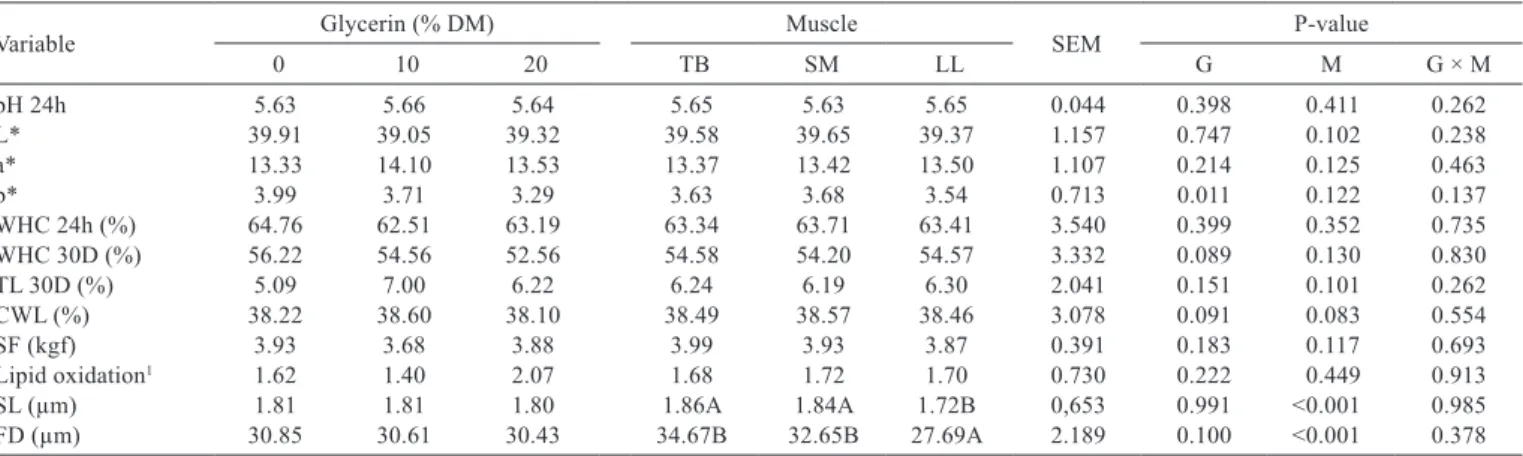
No interactions were observed (P>0.05) among glycerin levels and muscle types for any of the physical
and chemical variables evaluated (Table 3). The triceps
brachii, semimembranosus, and longissimus lumborum
muscles of the lambs were similar in terms of physical and chemical characteristics and only differed (P<0.05) in sarcomere length and diameter of muscle fibers (Table 3).
Final muscle pH, evaluated 24 h after slaughter, was not affected (P>0.05) by dietary glycerin. The final pH values observed in this study ranged from 5.63 to 5.66 (Table 3).
The diets did not affect (P>0.05) the lightness (39.20) and redness (13.43) of muscles. However, a linear decrease in yellowness from 3.99 (D0) to 3.29 (D20) occurred with increasing amounts of glycerin (Table 3).
There was no effect of glycerin (P>0.05) on meat water holding capacity 24 h (63.48%) and thirty days (54.44%) after slaughter (Table 3). The water holding capacity decreased in the three muscles between 24 h and 30 days after slaughter. The replacement of corn by glycerin did not affect (P>0.05) weight loss by thawing of muscles (6.10%) 30 days after slaughter (Table 3).
Weight losses during the cooking process (38.31%) and shear force (3.83 kgf) of meat were not affected (P>0.05) by dietary glycerin (Table 3). The lipid oxidation (1.70 mg of malonaldehyde/kg of meat) was also not significantly altered by the replacement of corn by glycerin in the diets (Table 3).
Table 3 - Chemical and physical characteristics of triceps brachii (TB), semimembranosus (SM), and longissimus lumborum (LL) muscles
of feedlot lambs fed diets with different levels of glycerin (% DM)
Variable Glycerin (% DM) Muscle SEM P-value
0 10 20 TB SM LL G M G × M
pH 24h 5.63 5.66 5.64 5.65 5.63 5.65 0.044 0.398 0.411 0.262
L* 39.91 39.05 39.32 39.58 39.65 39.37 1.157 0.747 0.102 0.238
a* 13.33 14.10 13.53 13.37 13.42 13.50 1.107 0.214 0.125 0.463
b* 3.99 3.71 3.29 3.63 3.68 3.54 0.713 0.011 0.122 0.137
WHC 24h (%) 64.76 62.51 63.19 63.34 63.71 63.41 3.540 0.399 0.352 0.735
WHC 30D (%) 56.22 54.56 52.56 54.58 54.20 54.57 3.332 0.089 0.130 0.830
TL 30D (%) 5.09 7.00 6.22 6.24 6.19 6.30 2.041 0.151 0.101 0.262
CWL (%) 38.22 38.60 38.10 38.49 38.57 38.46 3.078 0.091 0.083 0.554
SF (kgf) 3.93 3.68 3.88 3.99 3.93 3.87 0.391 0.183 0.117 0.693
Lipid oxidation1 1.62 1.40 2.07 1.68 1.72 1.70 0.730 0.222 0.449 0.913
SL (µm) 1.81 1.81 1.80 1.86A 1.84A 1.72B 0,653 0.991 <0.001 0.985
FD (µm) 30.85 30.61 30.43 34.67B 32.65B 27.69A 2.189 0.100 <0.001 0.378
Means in the same row with different letters for different types of muscle differ according to Tukey’s test (P<0.05).
DM - dry matter; SEM - standard error of the mean; G - effect of glycerin; M - effect of muscle; G × M - interaction between the glycerin levels and types of muscle.
L* - lightness; a* - redness; b* - yellowness; WHC 24h - water holding capacity after 24 h; WHC 30D - water holding capacity after 30 days; TL30D - thawing loss after 30 days;
CWL - cooking weight loss; SF - shear force; SL - sarcomere length; FD - fiber diameter.
Muscle fiber diameter (30.63 µm) and sarcomere length (1.81 µm) were not affected by dietary glycerin (P>0.05). However, differences were observed between the types of muscle for both variables (P<0.001). As there was no interaction between glycerin levels and muscle types, these differences are not related to dietary glycerin. Fiber diameter and sarcomere lengths did not differ between the
triceps brachii (34.67 and 1.86 µm) and semimembranosus
(32.65 and 1.84 µm) muscles and, in both cases, they were
larger (P<0.05) than seen in the longissimus lumborum
(27.69 and 1.72 µm).
Interactions were not observed (P>0.05) between glycerin levels and muscle types for any of the nutritional characteristics evaluated. The three muscles had similar nutritional characteristics and only differed (P<0.001) in cholesterol content (Table 4).
Despite the high glycerol content of the glycerin, no effects (P>0.05) of dietary glycerin were observed on muscle chemical composition (Table 4).
Muscle cholesterol levels (38.33 mg/100 g of meat)
were not significantly altered by the replacement of corn by glycerin (Table 4). However, the amount of cholesterol
Table 4 - Chemical composition and cholesterol content of triceps brachii (TB), semimembranosus (SM), and longissimus lumborum (LL)
muscles of feedlot lambs fed diets with different levels of glycerin (% DM)
Variable Glycerin (% DM) Muscle SEM P-value
0 10 20 TB SM LL G M G × M
Moisture1 77.56 78.05 78.11 77.98 77.95 77.79 0.614 0.219 0.116 0.598
Protein1 19.15 18.70 18.82 18.66 18.96 18.92 0.547 0.182 0.079 0.961
Fat1 2.14 2.12 1.95 2.23 1.96 2.16 0.665 0.181 0.120 0.445
Ash1 1.15 1.13 1.12 1.13 1.13 1.13 0.076 0.118 0.974 0.972
Cholesterol2 39.16 40.50 35.49 28.89B 52.41A 33.85B 3.103 0.387 <0.001 0.509
DM - dry matter; SEM - standard error of the mean; G - effect of glycerin; M - effect of muscle; G × M - interaction between the glycerin levels and types of muscle. Means in the same row with different letters for different types of muscle differ according to Tukey’s test (P<0.05).
1 g/100 g of meat. 2 mg/100 g of meat.
Table 5 - Fatty acid profile oftriceps brachii (TB), semimembranosus (SM), and longissimus lumborum (LL) muscles of feedlot lambs fed
diets with different levels of glycerin (% DM)
Variable (%) Glycerin (% DM) Muscle SEM P-value
0 10 20 TB SM LL G M G × M
Saturated
Capric (C10:0) 0.13 0.15 0.15 0.16 0.15 0.18 0.067 0.116 0.069 0.849
Lauric (C12:0) 0.26 0.24 0.29 0.25 0.25 0.24 0.221 0.844 0.256 0.334
Myristic (C14:0) 3.48 3.32 3.35 3.30 3.26 3.27 1.245 0.981 0.212 0.619
Pentadecanoic (C15:0) 0.55 0.62 0.64 0.61 0.60 0.59 0.151 0.335 0.240 0.746
Palmitic (C16:0) 27.30 26.63 26.50 26.97 27.03 27.08 1.036 0.501 0.211 0.069
Margaric (C17:0) 1.47 2.23 2.61 2.15 2.17 2.20 0.438 <0.001 0.102 0.689
Stearic (C18:0) 17.37 17.08 16.63 16.66 16.63 16.71 2.112 0.554 0.184 0.986
Arachidic (C20:0) 0.09 0.09 0.08 0.08 0.08 0.09 0.011 0.306 0.551 0.901
Monounsaturated
Myristoleic (C14:1) 0.16 0.21 0.22 0.21 0.20 0.21 0.091 0.497 0.407 0.894
Palmitoleic (C16:1) 1.74 1.90 1.83 1.84 1.83 1.82 0.268 0.559 0.226 0.568
Heptadecenoic (C17:1) 1.39 1.26 1.45 1.22 1.19 1.17 0.217 0.230 0.113 0.212
Oleic (C18:1 ω9) 40.07 40.33 40.25 40.54 40.50 40.47 1.382 0.935 0.201 0.982
Cis-vaccenic (C18:1 ω7) 1.76 1.81 1.73 1.74 1.75 1.77 0.184 0.301 0.394 0.703
Eicosenoic (C20:1 ω9) 0.08 0.08 0.08 0.08 0.08 0.08 0.009 0.938 0.889 0.754
Nervonic (C24:1 ω9) 0.06 0.04 0.07 0.05 0.07 0.06 0.027 0.441 0.098 0.586
Polyunsaturated
Linoleic (C18:2 ω6) 2.97 2.95 2.98 2.97 3.00 2.96 0.714 0.353 0.267 0.239
α-linolenic (C18:3 ω3) 0.11 0.11 0.13 0.12 0.12 0.12 0.025 0.084 0.891 0.322
γ-linolenic (C18:3 ω6) 0.11 0.11 0.14 0.12 0.13 0.12 0.021 0.123 0.281 0.678
CLA (C18:2 c9,t11) 0.27 0.26 0.23 0.29 0.27 0.26 0.068 0.583 0.199 0.429
Eicosadienoic (C20:2) 0.02 0.03 0.03 0.03 0.03 0.02 0.009 0.580 0.298 0.102
Eicosatrienoic (C20:3 ω6) 0.07 0.07 0.07 0.06 0.07 0.07 0.029 0.832 0.209 0.745
Arachidonic (C20:4 ω6) 0.46 0.43 0.44 0.48 0.50 0.53 0.315 0.618 0.387 0.619
Eicosapentaenoic (C20:5 ω3) 0.01 0.01 0.02 0.01 0.02 0.01 0.012 0.163 0.185 0.717
Docosatetraenoic (C22:4 ω6) 0.06 0.04 0.07 0.06 0.06 0.06 0.037 0.214 0.886 0.854
Docosahexaenoic (C22:6 ω3) 0.01 0.00 0.01 0.00 0.01 0.01 0.010 0.229 0.115 0.521
differed (P<0.05) among muscles, with similar values for the
triceps brachii (28.89 mg/100 g of meat) and longissimus lumborum (33.85 mg/100 g of meat) muscles and higher
value for the semimembranosus muscle (52.41 mg/100 g
of meat).
There were no interactions (P>0.05) between glycerin levels and muscle types for any of the variables that
comprise the fatty acid profile (Table 5).Irrespective of the
treatment, the most abundant fatty acids in the evaluated muscles were the saturated myristic (3.40%), palmitic (26.80%), and stearic (17.00%) acids; the monounsaturated oleic acid (40.2%) and the polyunsaturated linoleic acid (2.90%), altogether constituting 90.30% of the total meat fatty acids. Increasing dietary glycerin did not affect
individual fatty acid profile (P>0.05), except for a linear increase (1.47 to 2.61) in margaric fatty acid.
Total concentrations of saturated (50.42%), unsaturated (49.58%), monounsaturated (45.51%) and polyunsaturated (4.07%) fatty acids were not affected by the dietary glycerin inclusion and did not differ (P>0.05) among muscles (Table 6). The unsatured:satured (0.98), monounsaturated: saturated (0.90), and polyunsaturated:saturated (0.08) fatty acid ratios were not changed by dietary glycerin (P>0.05, Table 6), showing that the increase in margaric fatty acid did not alter the ratios.
The concentrations of omega-3 (0.14) and omega-6 (3.66) fatty acids were not affected (P<0.05) by the dietary glycerin. Consequently, the omega-6:omega-3 (27.12)
Table 6 - Concentrations (%) and ratios of fatty acids in triceps brachii (TB), semimembranosus (SM), and longissimus lumborum (LL)
muscles of feedlot lambs fed diets with different levels of glycerin (% DM)
Variable Glycerin (% DM) Muscle SEM P-value
0 10 20 TB SM LL G M G × M
SFA1 50.65 50.36 50.25 50.18 50.17 50.26 1.605 0.861 0.057 0.874
UFA2 49.35 49.64 49.75 49.82 49.83 49.74 1.605 0.861 0.057 0.874
MUFA3 45.26 45.63 45.63 45.68 45.62 45.58 1.395 0.658 0.203 0.990
PUFA4 4.09 4.01 4.12 4.14 4.21 4.16 1.132 0.414 0.099 0.870
UFA:SFA 0.97 0.99 0.99 0.99 0.99 0.99 0.071 0.781 0.898 0.869
MUFA:SFA 0.89 0.91 0.91 0.91 0.91 0.91 0.539 0.611 0.929 0.948
PUFA:SFA 0.08 0.08 0.08 0.08 0.08 0.08 0.021 0.890 0.932 0.836
Omega-35 0.13 0.12 0.16 0.14 0.14 0.14 0.053 0.359 0.930 0.689
Omega-66 3.67 3.60 3.70 3.69 3.76 3.74 0.763 0.176 0.353 0.911
n6:n3 28.23 30.00 23.13 26.36 26.86 26.71 4.215 0.701 0.081 0.649
DM - dry matter; SEM - standard error of the mean; G - effect of glycerin; M - effect of muscle; G × M - interaction between the glycerin levels and types of muscle. SFA - saturated fatty acids; UFA - unsaturated fatty acids; MUFA - monounsaturated fatty acids; PUFA - polyunsaturated fatty acids.
1 SFA = (C10:0+C12:0+C14:0+C15:0+C16:0+C17:0+C18:0+C20:0).
2 UFA = (C14:1+C16:1+C17:1+C18:1ω9+C18:1ω7+C20:1ω9+C24:1ω9+C18:2ω6+C18:3ω3+C18:23ω6+C18:2c9.t11+C20:2+C20:3ω6+C20:4ω6+C20:5ω3+C22:4ω6+C22:6ω3).
3 MUFA = (C14:1+C16:1+C17:1+C18:1ω9+C18:1ω7+C20:1ω9+C24:1ω9).
4 PUFA = (C18:2ω6+C18:3ω3+C18:23ω6+C18:2c9.t11+C20:2+C20:3ω6+C20:4ω6+C20:5ω3+C22:4ω6+C22:6ω3).
5 Omega 3 = (C18:3ω3+C20:5ω3+C22:6ω3).
6 Omega 6 = (C18:2ω6+C18:3ω6+C20:3ω6+C20:4ω6+C22:4ω6).
Table 7 - Indices, sums, and ratios of fatty acids in triceps brachii (TB), semimembranosus (SM), and longissimus lumborum (LL) muscles
of feedlot lambs fed diets with different levels of glycerin (% DM)
Variable Glycerin (% DM) Muscle SEM P-value
0 10 20 TB SM LL G M G × M
Δ9 desaturase 161 5.99 6.66 6.46 6.39 6.34 6.30 0.814 0.239 0.199 0.868
Δ9 desaturase 182 69.76 70.25 70.76 70.87 70.89 70.78 2.117 0.681 0.107 0.918
Elongase3 66.42 66.80 66.75 66.50 66.44 66.43 1.345 0.805 0.314 0.903
Atherogenicity4 0.84 0.81 0.81 0.81 0.81 0.81 0.092 0.921 0.975 0.975
Thrombogenicity5 1.93 1.88 1.85 1.87 1.86 1.87 0.506 0.253 0.748 0.931
Hypocholesterolemic (h)6 43.61 43.82 43.80 44.11 44.12 44.08 1.474 0.881 0.381 0.940
Hypercholesterolemic (H)7 30.78 29.95 29.85 30.27 30.29 30.35 1.786 0.368 0.359 0.935
h:H 1.42 1.46 1.47 1.46 1.46 1.45 0.122 0.643 0.708 0.900
Neutrals8 17.50 17.23 16.78 16.82 16.78 17.89 2.091 0.678 0.117 0.898
DM - dry matter; SEM - standard error of the mean; G - effect of glycerin; M - effect of muscle; G × M - interaction between the glycerin levels and types of muscle.
1 Δ9 desaturase 16 = 100[(C16:1cis-9)/(C16:1cis-9+C16:0)]. 2 Δ9 desaturase 18 = 100[(C18:1cis-9)/(C18:1cis-9+C18:0)].
3 Elongase = 100[(C18:0+C18:1cis9)/(C16:0+C16:1cis9+C18:0+C18:1cis9)].
4 Atherogenicity = [(C12:0+(4 × C14:0)+C16:0)]/UFA.
5 Thrombogenicity = [(C14:0+C16:0+C18:0)/[(0.5×ΣMUFA)+(0.5 × Σω6+(3 × Σω3)+(Σω3/Σω6)].
6 h = (C18:1cis9+C18:2ω6+C18:3ω3+C20:4ω6).
ratio was also unchanged (P>0.05) by the dietary glycerin (Table 6).
The activities of desaturases (6.37 and 70.25) and elongase (66.65) enzymes, the atherogenicity index (0.82), and the thrombogenicity index (1.88) were not affected by dietary glycerin (P<0.05). The amounts of hypocholesterolemic (43.74) and hypercholesterolemic (30.19) fatty acids and the h:H ratio (1.45) were not affected (P>0.05, Table 7) by dietary glycerin.
Discussion
According to Duarte et al. (2011) in unstressed animals, the values of muscle final pH usually range from 5.50 to 5.80. The final pH values observed in this study ranged from 5.63 to 5.66, resting within the normal range for ovine
meat and indicating that an adequate process of rigor mortis
occurred (Devine et al., 1993).
The replacement of corn by glycerin reduces the amount of dietary carotenoid pigments, and may have caused this decrease in yellowness that occurred uniformly in the three muscles. Despite the changes in yellowness, coloration variables remained within previously reported normal ranges of 30.03 to 49.47 for L*, 8.24 to 23.53 for a*, and 3.30 to 11.10 for b* (Sañudo et al., 2008).
The water holding capacity decrease in the three muscles between 24 h and 30 days after slaughter was expected. As previously described for fish meat, this decrease may result from protein denaturation during the freezing process or storage, which alters interfibrilar spaces, causes structural changes, and expels water (Shenouda, 1980).
The results for weight loss by thawing of muscles 30 days after slaughter differ from those reported by Lage et al.
(2014a), who analyzed the longissimus dorsi of feedlot
Santa Ines lambs and reported thawing losses differences related to dietary glycerin. However, these authors used very low-grade glycerin with only 36.2% glycerol, which could explain several discrepancies in their results.
Considering the results of shear force, the meat from the three muscles could be considered tender, as a previous study showed that an shear force below 5 kgf is considered tender (Tatum et al.,1999). Agreeing with this study, San Vito et al. (2014) found no difference in the shear force of
longissimus muscle of Nellore bulls fed diets containing up to 28% glycerin.
The non-interference of the dietary glycerin in lipid oxidation can be aligned with the lack of change in muscle unsaturated fatty acids, as it is known that muscle lipid oxidation is associated with unsaturated fat content (Narciso-Gaytán et al., 2010).
The differences in sarcomere length were expected, as functional demands define muscle phenotype. Thus, the
fatigue-resistant and red-fiber richlongissimus lumborum
should indeed have a smaller fiber diameter and sarcomere length (Du et al., 2010).
The chemical composition values were within the recommended range of 75% moisture, 20% protein, 3% fat, and 2% non-protein substances including minerals, vitamins, and carbohydrates (Tornberg, 2005). Because propionate is the main substrate for gluconeogenesis, this alteration could result in a higher glucose uptake by animals, reducing amino acid and triglyceride mobilization for gluconeogenesis. Thus, increases in dietary glycerol may improve protein and fat deposition in lambs.
The difference in the cholesterol level was not expected because no differences were found in total fat content, and concentrations of hypo- and hypercholesterolemic fatty acids and these variables are highly associated (Costa et al., 2002). Nevertheless, the cholesterol level of the three muscles is considered low (<90 mg/100 g), even when compared with results (44.27 mg/100 g) from Almeida et al. (2014), who evaluated meat from Ile de France lambs slaughtered with similar weight. The meat cholesterol content has become an important issue to consumers. Several studies indicated that in the adult man, the serum cholesterol level is essentially independent of the cholesterol intake (Chizzolini et al., 1999).
Odd-chain fatty acids are formed through de novo
synthesis from propionic acid, produced during rumen fermentation (Christie, 1981). Thus, the increase in the amount of C17:0 may result from the increase in rumen propionate induced by glycerol-rich diets (Drouillard, 2008). An increase in fat C17:0 content has previously been found in Arcott Canadian lambs fed diets containing up to 21% glycerin (Avila-Stagno et al., 2013). This increase in C17:0 does not pose hazards to human health (Scollan et al., 2006).
The PUFA:SFA ratio of 0.08 was lower than recommended for a healthy diet (Wood et al., 2003). However, this ratio is usually low in ruminant meat, and nutritional manipulation does not improve it because of ruminal bio-hydrogenation (Scollan et al., 2006). In relation to omega fatty acids, even without an increase in quantity and being present in small concentrations, the omega-3 fatty acid family benefits the human health, especially by reducing circulating LDL values (Harris et al., 2008).
(Ulbright and Southgate, 1991). A previous study reported a similar maintenance of desaturase and elongase activities in bulls fed 18% glycerin, although the AI was reduced with increasing dietary glycerin (Carvalho et al., 2014).
The h:H ratio values are lower than those previously reported for Ile de France lambs feeding on diets containing alternative ingredients such as sunflower seeds and vitamin E (Almeida et al., 2014). As there are no recommended values, it is assumed that higher ratios equal healthier animal fat.
Conclusions
The replacement of corn with up to 20% dietary glycerin does not affect the physicochemical and nutritional characteristics of Ile de France lamb meat derived from three different muscles. Glycerin can be included in the diet of feedlot lambs without any harm to meat quality.
Acknowledgments
We thank Fundação de Amparo à Pesquisa do Estado de São Paulo (FAPESP) for research support and the Master’s fellowship (case no. 2012/25250-7).
References
Almeida, F. A.; Silva Sobrinho, A. G.; Manzi, G. M.; Lima, N. L. L.; Endo, V. and Zeola, N. M. B. L. 2014. Dietary supplementation with sunflower seeds and vitamin E for fattening lambs improves the fatty acid profile and oxidative stability of the
Longissimus lumborum. Animal Production Science 55:1030-1036. doi: http://dx.doi.org/10.1071/AN13383
AOAC - Association of Official Analytical Chemistry. 1995. Official methods of analysis. 16th ed. AOAC International, Arlington, VA. Avila-Stagno, J. S.; Chaves, A. V.; He, M. L.; Harstad, O. M.;
Beauchemin, K. A.; McGinn, S. M. and McAllister, T. A. 2013. Effects of increasing concentrations of glycerol in concentrate diets on nutrient digestibility, methane emissions, growth, fatty acid profiles and carcass traits of lambs. Journal of Animal Science 91:829-837. doi: 10.2527/jas.2012-5215
Bartoñ, L.; Bureš, D.; Homolka, P.; Jančík, F.; Marounek, M. and Řehák, D. 2013. Effects of long-term feeding of crude glycerine on performance, carcass traits, meat quality and blood and rúmen metabolites of finishing bulls. Livestock Science 155:53-59. doi: 10.1016/j.livsci.2013.04.010
Behmer, O. A.; Jordens, J. Z.; Griffits, D. T. and Benez, S. M. 1976. Manual de técnicas para histologia normal e patológica. Ed. EDART, São Paulo, Brazil.
Bligh, E. G. and Dyer, W. J. 1959. A rapid method of total lipid extraction and purification. Canadian Journal of Biochemical and Physiology 37:911-917. doi: 10.1139/o59-099
Bragagnolo, N. and Rodriguez-Amaya, D. B. 2001. Determining cholesterol in meat: comparing a colorimetric method and a method for liquid chromatography of high efficiency. Revista do Instituto Adolfo Lutz 60:53-57.
Cañeque, V. and Sañudo, C. 2000. Metodologia para el estudo de la calidad de la canal y de la carne en rumiantes. Monografı́as INIA, Ganadera No.1. Ministerio de Ciencia y Tecnologı́a, Madrid. Carvalho, J. R. R.; Chizzotti, M. L.; Ramos, E. M.; Machado Neto,
O. R.; Lanna, D. P. D.; Lopes, L. S.; Teixeira, P. D. and Ladeira, M. M. 2014. Qualitative characteristics of meat from young bulls fed different levels of crude glycerin. Meat Science 96:977-983. doi: 10.1016/j.meatsci.2013.10.020
Chizzolini, R.; Zanardi, E.; Dorigoni, V. and Ghidini, S. 1999. Calorific value and cholesterol contente of normal and low-fat meat and meat product. Trends in Food Science & Technology 10:119-128.
Christie, W. W. 1981. Lipid metabolism in ruminant animals. Ed. Pergamon Press Ltd., Oxford.
Costa, E. C.; Restle, J.; Brondani, I. L.; Perottoni, J.; Faturi, C. and Menezes, L. F. G. 2002. Composição física da carcaça, qualidade da carne e conteúdo de colesterol no músculo Longissimus dorsi de novilhos Red Angus superprecoces, terminados em confinamento e abatidos com diferentes pesos.Revista Brasileira de Zootecnia 31:417-428. doi: http://dx.doi.org/10.1590/S1516-35982002000200017
Devine, C. E.; Graafhuis, A. E.; Muir, P. D. and Chrystall, B. B. 1993. The effect of growth rate and ultimate pH on meat quality of lambs. Meat Science 35:63-77. doi: 10.1016/0309-1740(93)90070-x Drouillard, J. S. 2008. Glycerin as a feed for ruminants: Using glycerin
in high-concentrate diets. Journal of Animal Science 86:392-393. Du, M.; Tong, J.; Zhao, J.; Underwood, K. R.; Zhu, M.; Ford, S. P. and
Nathanielsz, P. W. 2010. Fetal programming of skeletal muscle development in ruminant animals. Journal of Animal Science 88:51-60. doi: 10.2527/jas.2009-2311
Duarte, M. S.; Paulino, P. V.; Fonseca, M. A.; Diniz, L. L.; Cavali, J.; Serao, N. V.; Gomide, L. A.; Reis, S. F. and Cox, R. B. 2011. Influence of dental carcass maturity on carcass traits and meat quality of Nellore bulls. Meat Science 88:441-446. doi: 10.1016/ j.meatsci.2011.01.024
Edwards, A.; Mlambo, V.; Lallo, C. H. O.; Garcia, G. W. and Diptee, M. 2012. In vitro ruminal protein degradability of leaves from three species harvested at two cutting intervals. Journal of Animal Feed Research 2:224-230.
Françozo, M. C.; Prado, I. N.; Cecato, U.; Valero, M. V.; Zawadzki, F.; Ribeiro, O. L.; Prado, R. M. and Visentainer, J. V. 2013. Growth performance, carcass characteristics and meat quality of finishing bulls fed crude glycerine supplemented diets. Brazilian Archives of Biology and Technology 56:327-336. doi: http://dx.doi.org/10.1590/ S1516-89132013000200019
Gomes, M. A. B.; De Moraes, G. V.; Mataveli, M.; De Macedo, F. D. F.; Carneiro, T. C. and Rossi, R. M. 2011. Performance and carcass characteristics of lambs fed on diets supplemented with glycerin from biodiesel production. Revista Brasileira de Zootecnia 40:2211-2219. doi: http://dx.doi.org/10.1590/S1516-35982011001000022 Gunn, P. J.; Nery, M. K.; Lemenager, R. P. and Lake, S. L. 2010. Effects
of crude glycerin on performance and carcass characteristics of finishing wether lambs. Journal of Animal Science 88:1771-1776. doi: 10.2527/jas.2009-2325
Hamm, R. 1986. Functional properties of the myofibrillar system and their measurements. p.135-199. In: Muscle as food. Bechtel, P. J., eds. Academic Press Inc., New York.
Harris, W. S.; Miller, M.; Tighe, A. P.; Davidson, M. H. and Schaefer, E. J. 2008. Omega-3 fatty acids and coronary heart disease risk: Clinical and mechanistic perspectives. Atherosclerosis 197:12-24. doi: 10.1016/j.atherosclerosis.2007.11.008
Hartman, L. and Lago, R. C. A. 1973. Rapid preparation of fatty acid methyl esters from lipids. Laboratory Practice 22:475-476. Koohmaraie, M.; Shackelford, S. D. and Wheeler, T. L. 1998. Effect
on the tenderness of Callipyge Longissimus. Journal of Animal Science 76:1427-1432. doi: /1998.7651427x
Krueger, N. A.; Anderson, R. C.; Tedeschi, L. O.; Callaway, T. R.; Edrington, T.S. and Nisbet, D. J. 2010. Evaluation of feeding glycerol on free-fatty acid production and fermentation kinects of mixed ruminal microbes in vitro. Bioresearch Technology 101:8469-8472. doi: 10.1016/j.biortech.2010.06.010
Lage, J. F.; Paulino, P. V. R.; Pereira, L. G. R.; Duarte, M. S.; Valadares Filho, S. C.; Oliveira, A. S.; Souza, N. K. P. and Lima, J. C. M. 2014a. Carcass characteristics of feedlot lambs fed crude glycerin contaminated with high concentrations of crude fat. Meat Science 96:108-113. doi: http://dx.doi.org/10.1016/ j.meatsci.2013.06.020
Lage, J. F.; Berchielli, T. T.; Vito, E. S.; Silva, R. A.; Ribeiro, A. F.; Reis, R. A.; Dallantonia, E. E.; Simonetti, L. R.; Delevatti, L. M. and Machado, M. 2014b. Fatty acid profile, carcass and meat quality traits of young Nellore bulls fed crude glycerin replacing energy sources in the concentrate. Meat Science 96:1158-1164. doi: http://dx.doi.org/10.1016/j.meatsci.2013.10.027
Mach, N.; Bach, A. and Devant, M. 2009. Effects of crude glycerin supplementation on performance and meat quality of Holstein bulls fed high-concentrate diets. Journal of Animal Science 87:632-638. doi: 10.2527/jas.2008-0987
Malau-Aduli, A. E. O.; Siebert, B. D.; Bottema, C. D. K. and Pitchford, W. S. 1997. A comparasion of the fatty acid composition of tryacilglycerols in adipose tissue from Limousin and Jersey cattle. Australian Journal of Agricultural Research 48:715-722. doi: 10.1071/A96083
Musselman, A. F.; Van Emon, M. L.; Gunn, P. J.; Rusk, C. P.; Neary, M. K.; Lemenager, R. P. and Lake, S. L. 2008. Effects of crude glycerin on feedlot performance and carcass characteristics of market lambs. Journal of Animal Science 59:353-355.
Narciso-Gaytán, C.; Shin, D.; Sams, A. R.; Keeton, J. T.; Miller, R. K.; Smith, S. B. and Sanchez-Plata, M. X. 2010. Dietary lipid source and vitamin E effect on lipid oxidation stability of refrigerated fresh and cooked chicken meat. Poulty Science 89:2726-2734. doi: 10.3382/ps.2010-00738.
NRC - National Research Council. 2007. Nutrient requeriments of small ruminants: sheep, goats, cervids and New World camelids. National Academies Press, Washington, DC.
Pikul, J.; Leszczynski, D. E. and Kummerow, F. A. 1989. Evaluation of three modified TBA methods for measuring lipid oxidation in chicken meat. Journal of Agriculture of Food Chemistry 37:1309-1313. doi: 10.1021/jf00089a022
San Vito, E.; Lage, J. F.; Ribeiro, A. F.; Silva, R. A. and Berchielli, T. T. 2014. Fatty acid profile, carcass and quality traits of meat from Nellore young bulls on pasture supplemented with crude glycerin. Meat Science 100:17-23. doi: 10.1016/jmeatsci.2014.09.008 Sañudo, C.; Arribas, M. D. M. C. and Silva Sobrinho, A. G. 2008.
Qualidade da carcaça da carne ovina e seus fatores determinantes. p.177-228. In: Produção de carne ovina. Silva Sobrinho, A. G., ed. FUNEP, Jaboticabal, Brazil.
Schröder, A. and Südekum, K. H. 1999. Glycerol as a by-product of biodiesel production in diets for ruminants. Paper no. 241. In: New Horizons for an Old Crop. Wratten, N. and Salisbury, P. A., eds. The Regional Institute Ltd., Gosford, Australia.
Scollan, N.; Hocquette, J.; Nuernberg, K.; Dannenberger, D.; Richardson, I. and Moloney, A. 2006. Innovations in beef production systems that enhance the nutritional and health value of beef lipids and their relationship with meat quality. Meat Science 74:17-33. doi: 10.1016/j.meatsci.2006.05.002
Shenouda, S. Y. K. 1980. Theories of protein denaturation during frozen storage of fish flesh. Advances in Food Research 26:275-311. Tatum, J. D.; Belk, K. E.; George, M. H. and Smith, G. C. 1999.
Identification of quality management practices to reduce the incidence of retail beef tenderness problems: Development and evaluation of a prototype quality system to produce tender beef. Journal of Animal Science 77:2112-2118. doi: /1999.7782112x Terré, M.; Nuda, A.; Casado, P. and Bach, A. 2011. The use of
glycerine in rations for light lambs during the fattening period. Animal Feed Science and Technology 164:262-267. doi: 10.1016/ j.anifeedsci.2010.12.008
Tilman, D. and Clark, M. 2014. Global diets link environmental sustainability and human health. Nature 515:518-522. doi: 10.1038/nature13959
Tornberg, E. 2005. Effects of heat on meat proteins - Implications on structure and quality of meat products. Meat Science 70:493-508. doi: 10.1016/j.meatsci.2004.11.021
Ulbricht, T. L. V. and Southgate, D. A. T. 1991. Coronary heart disease: Seven dietary factors. Lancet 338:985-992. doi: 10.1016/ 0140-6736(91)91846-M
Wheeler, T. L.; Koohmaraie, M. and Schackelford, S. D. 1995. Shear force procedures for meat tenderness measurement. Roman L. Hruska U.S. MARC USDA, Clay Center. 7p.