Antônio Heriberto de Castro Teixeira(1), Jorge Tonietto(2) and Janice Freitas Leivas(1)
(1)Embrapa Monitoramento por Satélite, Avenida Soldado Passarinho, no 303, Fazenda Jardim Chapadão, CEP 13070‑115 Campinas, SP, Brazil. E‑mail: [email protected], [email protected] (2)Embrapa Uva e Vinho, Rua Livramento, no 515, Caixa Postal 130, CEP 95700‑000 Bento Gonçalves, RS, Brazil. E‑mail: [email protected]
Abstract – The objective of this work was to develop and apply water balance indicators to be scaled up in the wine grape (Vitis vinifera) growing regions of the municipalities of Petrolina and Juazeiro, in the states of Pernambuco and Bahia, respectively, Brazil, simulating different pruning dates along the year. Previous energy balance measurements were used to relate the crop coefficient (Kc) with the accumulated degree‑days (DDac). This model was applied to scale up the water balance indicators during the growing seasons. When irrigation water was available, the best pruning periods were from May to July, due to the better natural thermal and hidrological conditions. More care should be taken for pruning done in other periods of the year, regarding the effect of increasing thermal conditions of wine quality. The water balance indicators, both successfully developed and applied, allow large-scale analyses of the thermohydrological conditions for wine grape production under the semiarid conditions of the Brazilian Northeast.
Index terms: Vitis vinifera, crop coefficient, evapotranspiration, vineyard adaptation, water resources.
Indicadores de balanço hídrico em larga escala para diferentes
datas de poda da videira para vinho tropical
Resumo – O objetivo deste trabalho foi elaborar e aplicar indicadores de balanço hídrico para a suas extrapolações nas regiões de cultivo de uvas (Vitis vinifera) para vinho nos municípios de Petrolina e Juazeiro, nos estados de Pernambuco e da Bahia, respectivamente, tendo-se simulado diferentes épocas de poda ao longo do ano. Medições prévias de balanço de energia foram usadas para relacionar o coeficiente de cultura (Kc) com os graus-dias acumulados (GDac). Este modelo foi aplicado para extrapolação dos indicadores de balanço hídrico, durante os ciclos produtivos. Quando houve disponibilidade de água para irrigação, os melhores períodos de poda foram de maio a julho, por causa das melhores condições naturais térmicas e hídricas. Maiores cuidados devem ser tomados para podas realizadas em outros períodos do ano, com relação aos efeitos das temperaturas elevadas na qualidade do vinho. Os indicadores de balanço hídrico, desenvolvidos e aplicados com sucesso, permitiram análises, em larga escala, das condições termohídricas para produção de uvas para vinho, sob as condições semiáridas do Nordeste brasileiro.
Termos para indexação: Vitis vinifera, coeficiente de cultura, evapotranspiração, adaptação de parreirais, recursos hídricos.
Introduction
In wine grape (Vitis vinifera L.) crops, plant phenology, wine quality, and yield are very dependent on the climate at regional, local, and microclimatic scales (Jones & Webb, 2010; Fraga et al., 2012, 2014; Lorenzo et al., 2016). For all these scales, it is becoming more and more important to consider grape site selection, cultural practices, and water management, which are essential for potential adaptations to different climate scenarios (Malheiro et al., 2010; Dunn et al., 2015; Neethling et al., 2015; Tóth & Végvári, 2016).
The optimal vineyard response to air temperature (Ta) ranges from 20 to 35oC (Gouveia et al., 2011).
According to Fraga et al. (2014), a base 10oC T a is
et al., 2010; Caffarra et al., 2012; Lorenzo et al., 2016).
Although suspended solid concentrations increase with rising thermal conditions (Ta >30oC), high oBrix
levels may be attributed to high evapotranspiration
(ET) rates (Keller, 2010). According to Webb et al.
(2012), high Ta during the harvest period may reduce
berry quality due to increasing ET. Therefore, a rational water management is fundamental for controlling
water deficiencies and excesses, besides quantifying
vineyard water requirements (Anderson et al., 2008; Teixeira et al., 2014; Maxwell et al., 2016).
Regarding water balance, warming conditions can directly affect the vineyard water requirements, which, together with low rainfall amounts, promote high levels of aridity and water demand. In addition, high soil moisture throughout the growing season may also cause excessive vigor, increased risks of pest and diseases, and other problems related to wine quality and to the balance of its chemical components (Teixeira, 2009; Gouveia et al., 2011; Santos et al., 2013; Teixeira et al., 2015; Lorenzo et al., 2016).
All these thermohydrological effects on wine quality and production during the vineyard growing seasons show the importance of water in delimitating the areas with climatic aptitude for winemaking processes.
A large number of climate models have been used worldwide to classify winemaking regions through different methodologies. The multicriteria climatic
classification (MCC) system proposed by Tonietto &
Carbonneau (2004) has been used under temperate climate conditions in Europe (Blanco-Ward et al., 2007) and in South America (Ferrer et al., 2007; Montes et al., 2012); however, this method has mostly worked well considering a single, six-month growing season per year under temperate climate conditions.
Over the last years, the Brazilian semiarid region has appeared among the main tropical wine-producing areas in the country, which are typically subjected to irrigated conditions. In this region, vineyard water
variables have been quantified by point measurements
(Teixeira et al., 2007; Azevedo et al., 2008), which can be scaled up through tools such as remote sensing and the geographic information system (GIS) (Teixeira et al., 2013, 2014, 2015; Lorenzo et al., 2016).
The objective of this work was to develop and apply water balance indicators to be scaled up in the
wine grape growing regions of the municipalities of Petrolina and Juazeiro, in the states of Pernambuco and Bahia, respectively, Brazil, simulating different pruning dates along the year.
Materials and Methods
A net of agrometeorological stations was used for the interpolation processes in a GIS environment. These stations are spread in the municipalities of Petrolina and Juazeiro, in the states of Pernambuco and Bahia, Brazil – seven of them are located inside irrigated farms and the other seven on areas with natural vegetation, called Caatinga. The gridded climate data characterized well the horizontal thermohydrological contrast between these mixed agroecosystems (Figure 1).
According to Teixeira (2009), in the semiarid region of the Brazilian Northeast, disturbed currents from the south, north, east, and west affect the climate. Excluding the places of high altitude, all areas present long-term annual Ta higher than 24°C, with average
maximum of 33°C and average minimum of 19°C. The warmest months are October and November, when the sun is close to the zenith position, with low cloud cover, and the coldest ones are June and July, at the winter solstice in the Southern Hemisphere. The thermal homogeneity strongly contrasts with the spatial and temporal heterogeneity of the rainfall regime. In the Petrolina-Juazeiro region, the rainy period is from January to April, representing 68% of the annual rainfall.
The climate variables are from a ten-year period, from 2003–2012. Monthly data were used to calculate the reference evapotranspiration (ETo) by the Penman-Monteith method (Allen et al., 1998). Previous energy balance data (Teixeira et al., 2007) of the grape cultivar Syrah in the Brazilian semiarid
region were used. The field experiment was carried out
close to the Bebedouro agrometeorological station of Embrapa Semiárido, at a distance of approximately 3 km (Figure 1). This allowed the elaboration and application of the model, based on the relationship
between the crop coefficient (Kc) and the accumulated
degree-days (DDac), considering a base temperature of
Kc was used to obtain the ET under potential
conditions, which, in turn, considered the vineyard water requirements, using 'Syrah' as a reference wine grape in the study region. The water requirements for a growing season (WRGS) were determined by simulating
different pruning dates for an average growing season of four months, under the Brazilian semiarid conditions, using the equation: WRGS = KcGS ×EToGS, in which KcGS is a crop coefficient of a growing season.
Kc values were taken into account, with zero being
the DDac value at the beginning of a growing season,
and the other DDac values being calculated, along the
growing season, with the average Ta for the subsequent months. The averaged values for the five Kc and the
total ETo for a growing season (EToGS) were then used
to obtain WRGS.
Another indicator, the water balance difference (WBd), was applied to quantify, on large scales, the
excess or deficiency of water in the vineyards for a
growing season: WBdGS = PGS - WRGS, in which WBdGS
is the water balance difference for a growing season; and PGS is the total rainfall of a growing season.
Positive WBd values indicate vineyard water excess, while the negative ones represent vineyard water
deficiency. It should be highlighted that, for large‑scale
analyses, it is necessary to consider water storage in the root zones in order to determine the vineyard water balance.
The values obtained for WRGS and PGS allowed the
development and application of the water balance ratio (WBr) indicator, obtained by: WBrGS = PGS / WRGS, in
which WBrGS is the water balance ration for a growing
season. WBr takes into account thermohydrological conditions and is a measure of the water availability in the vineyard root zone. When WBr is around 1.00, it implies the feasibility for rainfed wine grape, while much higher values indicate moisture excess problems, independently of the absence or not of irrigation, and
low values show possible natural water deficiencies
and the required degree of irrigation according to pruning dates.
Keeping in mind that the wine quality depends on
both thermal and water conditions, these conditions were used to obtain the mean pixel values and SD of WBd and WBr for an average growing season of four months and according to the pruning dates for the long-term climate data, from 2003–2012.
Results and Discussion
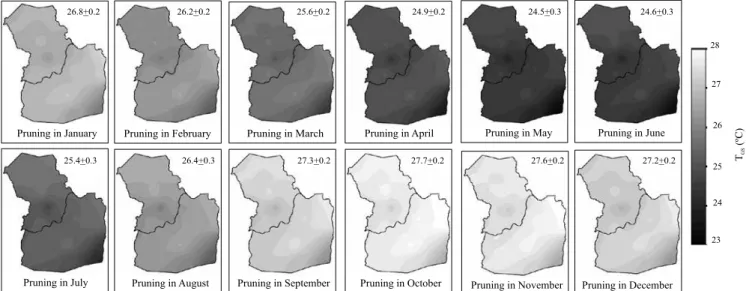
The coldest and the hottest growing seasons were those for the pruning dates from April to July and from September to December, respectively. Considering the standard deviation (SD) values, low thermal spatial variations were observed, due to the proximity of the municipalities to the equator. Regarding air temperature for a growing season (TGS), the lowest
values were registered during the winter solstice in the Southern Hemisphere, while the highest ones were found when the sun was around the zenith position over the Brazilian tropical wine grape growing region. For pruning during the coldest periods, several pixels presented TGS lower than 24oC, whereas, in the hottest
months, TGS was higher than 26oC (Figure 2).
There were no thermal limitations for the wine grape crop in the Brazilian semiarid region, with pruning dates in the middle of the year. However, for all pruning periods, TGS pixels were below 30oC,
which should increase suspended solid concentrations
(Keller, 2010). Despite this, TGS values were not below the threshold limit of 10oC, which could introduce a
dormancy stage in temperate climates (Ricce et al., 2013; Fraga et al., 2014). The observed ranges were between 23 and 28oC, within the optimum range
according to Gouveia et al. (2011).
However, when pruning was done from September to December, many areas presented TGS above 27oC,
which could negatively affect wine quality. These latter conditions contribute to high sugar content in grapes, producing wines with increasing levels of alcohol, low acidity, and higher pH values. Together, these effects promote a wine unbalance with instability for phenolic and aromatic composition (Tarara et al., 2008; Mira de Orduña, 2010; Fraga et al., 2012, 2014; Maxwell et al., 2016).
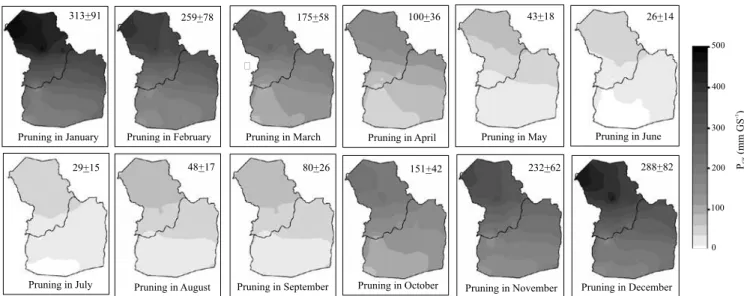
The pruning dates with the highest PGS were those
from December to February, with several pixel values greater than 300 mm per growing season in the municipality of Petrolina. During this period, the
greatest moisture spatial variation was also verified
from the SD values. The lowest PGS was obtained for
pruning done between May and July; however, the highest pixel values were found in the northwestern region of Petrolina, while the lowest ones occurred in the southwestern region of the municipality of Juazeiro (Figure 3).
Taking into account all pruning dates, the rainfall amounts in Petrolina were 60% greater than in
Juazeiro. Therefore, in the first municipality, there
are greater possibilities of meeting the vineyard water requirements with rainfall, together with supplementary irrigations, whenever irrigation water
is available. However, the risks of pests and diseases and the other problems related to wine quality and to the balance between its chemical components were apparently higher for pruning done from December to February (Teixeira, 2009; Gouveia et al., 2011; Santos et al., 2013; Teixeira et al., 2015; Lorenzo et al., 2016).
Considering the cultivar Syrah as a reference for wine grapes in the growing region of Petrolina and Juazeiro, as well as long-term climate conditions (2003–2012), the WRGS spatial values for an average growing season
of four months are presented in Figure 4.
The pruning dates with the highest WRGS were
observed from August to October, with average pixel values greater than 420 mm per growing season, when, according to the SD values, the greatest spatial variations also occurred. Pruning from March to May promoted the lowest water consumptions and SD values, with mean WRGS bellow 350 mm per growing season. High WRGS
were found in the northwestern region of Petrolina, which might indicate good grape yield and wine quality if water is available, in association with techniques to avoid natural water excess in the root zones (Lorenzo et al., 2016; Maxwell et al., 2016). However, under water scarcity conditions, there is ample room for water productivity improvements, considering the lower atmospheric demands (Teixeira et al., 2015).
Taking into account all pruning dates along a year, the water demands in Petrolina were 10% greater than those in Juazeiro. Daily average values of the water requirements were between 2.7 and 3.6 mm
per day, similar to the ET rates found throughout field
experiments in different wine grape growing regions worldwide (Williams & Ayars, 2005; Ortega-Farias et al., 2007; Azevedo et al., 2008), reinforcing the upscaling techniques applied in the present study.
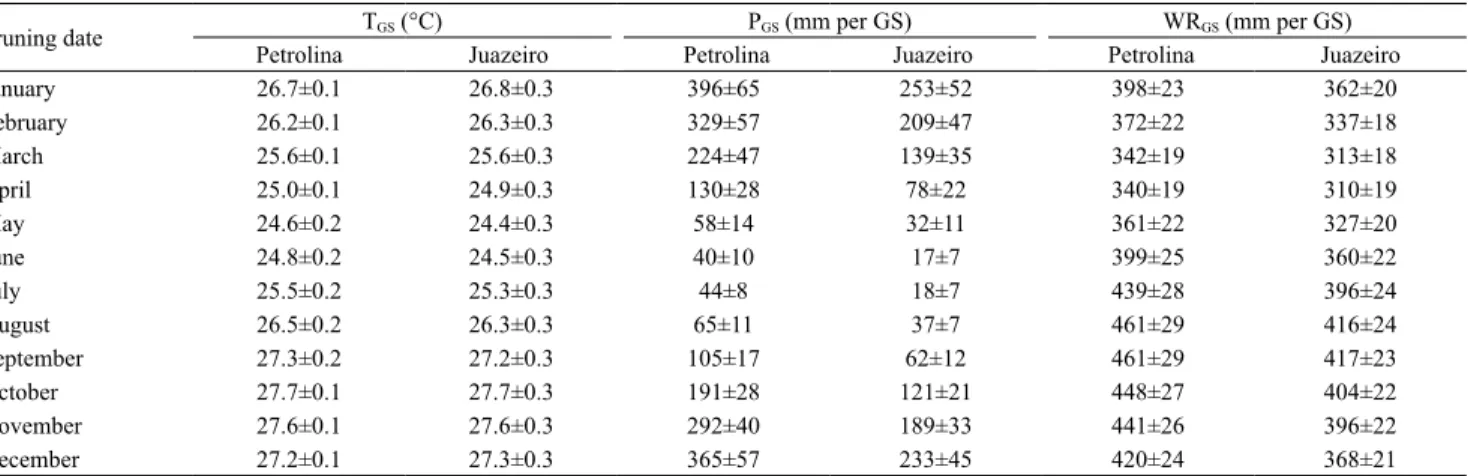
No significant differences were observed between
the TGS mean values for Petrolina and for Juazeiro, since
both municipalities showed average for all pruning periods of 26oC per growing season; however, the
second municipality presented greater spatial-thermal variation, according to the SD values (Table 1). The same is not true when considering PGS, since the values
for Juazeiro were lower than those for Petrolina, indicating higher possibility of rainfall water use by the vineyards in the second municipality. As the vineyard
thermal conditions did not differ significantly between
municipalities, the WRGS values for Juazeiro were,
in average, 91% of those for Petrolina. These small differences may be attributed to the effect of relative humidity on the ETo calculations, since lower PGS
reduces relative humidity in Juazeiro, when compared with Petrolina.
No positive WBd mean values were observed (Figure 5), meaning that, when the whole area and average conditions were considered, in general, there was absence of vineyard water excess for all pruning dates. Disregarding the water storage in the root zones in the vineyard water balance, the pruning periods
with the highest water deficiency, i.e., with the most
negative WBd, were observed from June to September, when both municipalities presented average WBd
pixel values lower than -340 mm per growing season and also the lowest SD, around 23 mm per growing season. The less negative WBd values were obtained for pruning dates from December to February, when the average was above -150 mm per growing season. These last thermohydrological conditions indicated the feasibility of rainfed wine grape with supplementary
irrigation. Natural water deficiency in Petrolina is
87% of that in Juazeiro, with better chances of success
Figure 4. Spatial averages of the water requirements for a four-month average wine grape (Vitis vinifera) growing season (WRGS), considering climate data from a ten-year period, from 2003–2012, simulating different pruning dates, in the municipalities of Petrolina and Juazeiro, in the states of Pernambuco and Bahia, respectively, in Northeast Brazil. The mean pixel values and standard deviations are also shown.
Table 1. Mean values and standard deviations (SD) of the water balance indicators for a four-month average growing season (GS) of the 'Syrah' wine grape (Vitis vinifera), considering climate data from a ten-year period, from 2003–2012, in the municipalities of Petrolina and Juazeiro, in the states of Pernambuco and Bahia, respectively, Brazil(1).
Pruning date TGS (°C) PGS (mm per GS) WRGS (mm per GS)
Petrolina Juazeiro Petrolina Juazeiro Petrolina Juazeiro
January 26.7±0.1 26.8±0.3 396±65 253±52 398±23 362±20
February 26.2±0.1 26.3±0.3 329±57 209±47 372±22 337±18
March 25.6±0.1 25.6±0.3 224±47 139±35 342±19 313±18
April 25.0±0.1 24.9±0.3 130±28 78±22 340±19 310±19
May 24.6±0.2 24.4±0.3 58±14 32±11 361±22 327±20
June 24.8±0.2 24.5±0.3 40±10 17±7 399±25 360±22
July 25.5±0.2 25.3±0.3 44±8 18±7 439±28 396±24
August 26.5±0.2 26.3±0.3 65±11 37±7 461±29 416±24
September 27.3±0.2 27.2±0.3 105±17 62±12 461±29 417±23
October 27.7±0.1 27.7±0.3 191±28 121±21 448±27 404±22
November 27.6±0.1 27.6±0.3 292±40 189±33 441±26 396±22
December 27.2±0.1 27.3±0.3 365±57 233±45 420±24 368±21
for rainfed wine grapes, once rainfall-water storage techniques are applied.
Considering that, in average, PGS for Petrolina was
60% greater than that for Juazeiro, but that WRGS
were only 10% greater, the differences regarding rainfall amounts affected more the water balance than the different ET rates between the municipalities. As observed for WBd, pruning dates from December to February also presented the highest WBr, with averages ranging from 0.60 to 1.00, meaning that rainfall amounts met from 60 to 100% of the vineyard water demands during these pruning periods; however, SD values for both of them were around 0.10 (Figure 5 B).
Although rainy conditions are considered beneficial
due to the availability of natural water, increasing soil moisture may reduce the ripening capacity of grapes,
and the difficulty of water stress management is
unfavorable for the organoleptic wine quality. In this sense, it is necessary to improve drainage for both irrigated and rainfed vineyards during the periods of
high WBr. Natural climate dry conditions were verified
when pruning was done from May to August. Under these circumstances, the WBr values were around 0.10 with almost no spatial variation, favoring more the irrigated vineyards. These conditions avoid plant diseases, root respiration problems, and direct damage to the berries promoted by excessive rainfall, favoring the quality of must and wine (Gouveia et al., 2011; Santos et al., 2013; Fraga et al., 2014; Teixeira et al., 2015; Lorenzo et al., 2016; Maxwell et al., 2016).
Conclusions
1. The water balance indicators, both successfully developed and applied, allow the large-scale analyses of the thermohydrological conditions for wine grape (Vitis vinifera) production under the semiarid conditions of the Brazilian Northeast, considering different pruning dates along the year.
2. Under irrigated conditions, the best wine grape pruning dates are from May to July, wherever irrigation water is available, with the thermohydrological conditions favoring a better tropical wine quality.
Acknowledgement
To Conselho Nacional de Desenvolvimento
Científico e Tecnológico (CNPq, Process Nos. 472973/2011‑8 and 404229/2013‑1), for financial
support.
References
ALLEN, R.G.; PEREIRA, L.S.; RAES, D.; SMITH, M. Crop evapotranspiration: guidelines for computing crop water requirements. Rome: Food and Agriculture Organization of the United Nations, 1998. (FAO. Irrigation and drainage paper nº 56).
ANDERsoN, K.; FINDlAy, C.; FuENTEs, s.; TyERMAN, s. Garnaut climate change review: viticulture, wine and climate change. Adelaide: University of Adelaide, 2008.
AzEVEDO, P.V. de; SOARES, J.M.; SILVA, V. de P.R. da S.; SILVA, B.B. da; NASCIMENTO, T. Evapotranspiration of “Superior” grapevines under intermittent irrigation. Agricultural
Water Management, v.95, p.301-308, 2008. DOI: 10.1016/j. agwat.2007.10.011.
BLANCO-WARD, D.; GARCíA QUEIJEIRO, J.M.; JONES, G.V. Spatial climate variability and viticulture in the Miño River Valley of Spain. Vitis, v.46, p.63-70, 2007.
CAFFARRA, A.; RINALDI, M.F.; ECCEL, E.; ROSSI, V.; PERTOT, I. Modelling the impact of climate change on the interaction between grapevine and its pests and pathogens: European grapevine moth and powdery mildew. Agriculture Ecosystems and Environments, v.148, p.89-101, 2012. DOI: 10.1016/j.agee.2011.11.017.
CENTENO, A.; BAEzA, P.; LISSARRAGUE, J.R. Relationship between soil and plant water status in wine grapes under various
water deficit regimes. HortTechnology, v.20, p.585-593, 2010.
DuNN, M.R.; lINDEsAy, J.A.; HoWDEN, M. spatial and
temporal scales of future climate information for climate change adaptation in viticulture: a case study of User needs in the Australian winegrape sector. Australian Journal of Grape and Wine Research, v.21, p.226-239, 2015. DOI: 10.1111/ajgw.12138.
FERRER, M.; PEDOCCHI, R.; MICHELAzzO, M.; GONzÁLEz NEVES, G.; CARBONNEAU, A. Delimitación y descripción de
regiones vitícolas del uruguay en base al método de clasificación
climática multicriterio utilizando índices bioclimáticos adaptados a las condiciones del cultivo. Agrociencia, v.11, p.47-56, 2007.
FRAGA, H.; MALHEIRO, A.C.; MOUTINHO-PEREIRA, J.; SANTOS, J.A. An overview of climate change impacts on European viticulture. Food and Energy Security, v.1, p.94-110, 2012. DOI: 10.1002/fes3.14.
FRAGA, H.; MALHEIRO, A.C.; MOUTINHO-PEREIRA, J.; SANTOS, J.A. Climate factors driving wine production in Portuguese Minho region. Agricultural and Forest Meteorology, v.185, p.26-36, 2014. DOI: 10.1016/j.agrformet.2013.11.003.
GOUVEIA, C.; LIBERATO, M.L.R.; DaCAMARA, C.C.; TRIGO, R.M.; RAMOS, A.M. Modelling past and future wine production in the Portuguese Douro Valley. Climate Research, v.48, p.349-362, 2011. DOI: 10.3354/cr01006.
JONES, G.V.; WEBB, L.B. Climate change, viticulture, and wine: challenges and opportunities. Journal of Wine Research, v.21, p.103-106, 2010. DOI: 10.1080/09571264.2010.530091.
KEllER, M. Managing grapevines to optimize fruit development
in a challenging environment: a climate change primer for viticulturists. Australian Journal of Grape and Wine Research, v.16, p.56-69, 2010. Supplement 1. DOI: 10.1111/j.1755-0238.20 09.00077.x.
LORENzO, M.N.; RAMOS, A.M.; BRANDS, S. Present and future climate conditions for winegrowing in Spain. Regional Environmental Change, v.16, p.617-627, 2016.
MALHEIRO, A.C.; SANTOS, J.A.; FRAGA, H.; PINTO, J.G. Climate change scenarios applied to viticultural zoning in Europe.
Climate Research, v.43, p.163-177, 2010. DOI: 10.3354/cr00918.
MAXWEll, J.T.; FICKlIN, D.l.; HARlEy, G.l.; JoNEs, G.V.
Projecting future winegrape yields using a combination of Vitis
vinifera L. growth rings and soil moisture simulations, northern
California, USA. Australian Journal of Grape and Wine Research, v.22, p.73-80, 2016. DOI: 10.1111/ajgw.12158.
MIRA DE ORDUñA, R. Climate change associated effects on grape and wine quality and production. Food Research International, v.43, p.1844-1845, 2010. DOI: 10.1016/j.foodres.2010.05.001.
MONTES, C.; PEREz-QUEzADA, J.F.; PEñA-NEIRA, A.; TONIETTO, J. Climatic potential for viticulture in Central Chile.
Australian Journal of Grape and Wine Research, v.18, p.20-28, 2012. DOI: 10.1111/j.1755-0238.2011.00165.x.
NEETHLING, E.; PETITJEAN, T.; QUéNOL, H.; BARBEAU, G. Assessing local climate vulnerability and winegrowers’ adaptive processes in the context of climate change. Mitigation and Adaptation Strategies for Global Change, p.1-27, 2016. DOI: 10.1007/s11027-015-9698-0.
ORTEGA-FARIAS, S.; CARRASCO, M.; OLIOSO, A.; ACEVEDO, C.; POBLETE, C. latent heat flux over Cabernet Sauvignon vineyard using the Shuttleworth and Wallace model.
Irrigation Science, v.25, p.161-170, 2007. DOI: 10.1007/ s00271-006-0047-7.
RICCE, W. da S.; CARAMORI, P.H.; ROBERTO, S.R. Potencial climático para a produção de uvas em sistema de dupla poda anual no Estado do Paraná. Bragantia, v.72, p.408-415, 2013. DOI: 10.1590/brag.2013.042.
sANTos, J.A.; GRäTsCH, s.D.; KARREMANN, M.K.; JoNEs,
G.V.; PINTO, J.G. Ensemble projections for wine production in the Douro Valley of Portugal. Climatic Change, v.117, p.211-225, 2013. DOI: 10.1007/s10584-012-0538-x.
TARARA, J.M.; lEE, J.; sPAyD, s.E.; sCAJEl, C.F. Berry
temperature and solar radiation alter acylation, proportion, and concentration of anthocyanin in merlot grapes. American Journal of Enology and Viticulture, v.59, p.235-247, 2008.
TEIXEIRA, A.H. de C. Water productivity assessments from field to large scale: a case study in the Brazilian semi-arid region. Saarbrücken: Lambert Academic Publishing, 2009. 226p.
TEIXEIRA, A.H. de C.; BASTIAANSSEN, W.G.M.; BASSOI, L.H. Crop water parameters of irrigated wine and Table grapes to support water productivity analysis in São Francisco River basin, Brazil. Agricultural Water Management, v.94, p.31-42, 2007. DOI: 10.1016/j.agwat.2007.08.001.
TEIXEIRA, A.H. de C.; HERNANDEz, F.B.T.; LOPES, H.L. Up scaling Table grape water requirements in the Low-Middle São Francisco river basin, Brazil. Acta Horticulturae, v.1038, p.655-662, 2014. DOI: 10.17660/ActaHortic.2014.1038.83.
TEIXEIRA, A.H. de C.; HERNANDEz, F.B.T.; SCHERER-WARREN, M.; ANDRADE, R.G.; LEIVAS, J.F.;
VICToRIA, D. de C.; BolFE, E.l.; THENKABAIl, P.s.;
FRANCO, R.A.M. Water productivity studies from earth observation data: characterization, modeling, and mapping water use and water productivity. In: PRASAD, S.T. (Ed.). Remote sensing of water resources, disasters, and urban studies. Boca Raton: Taylor and Francis, 2015. p.101-126. (Remote sensing of water handbook, v.3).
a changing semi-arid environment: a Brazilian case study. Remote Sensing, v.5, p.5783-5804, 2013. DOI: 10.3390/rs5115783.
TONIETTO, J.; CARBONNEAU, A. A multicriteria climatic
classification system for grape‑growing regions worldwide. Agricultural and Forest Meteorology, v.124, p.81-97, 2004. DOI: 10.1016/j.agrformet.2003.06.001.
TÓTH, J.P.; VéGVÁRI, z. Future of winegrape growing regions in Europe. AustralianJournal of Grape and Wine Research, v.22, p.64-72, 2016. DOI: 10.1111/ajgw.12168.
WEBB, l.B.; WHETToN, P.H.; BHEND, J.; DARBysHIRE, R.;
BRIGGS, P.R.; BARLOW, E.W.R. Earlier wine-grape ripening driven by climatic warming and drying and management practices.
Nature Climate Change, v.2, p.259-264, 2012. DOI: 10.1038/ nclimate1417.
WIllIAMs, l.E.; AyARs, J.E. Grapevine water use and the
crop coefficient are linear functions of the shaded area measured
beneath the canopy. Agricultural and Forest Meteorology, v.132, p.201-211, 2005. DOI: 10.1016/j.agrformet.2005.07.010.