Engineering
ISSN: 1809-4430 (on-line)
FUZZY MODELING OF BROILER PERFORMANCE, RAISED FROM 1 TO 21 DAYS, SUBJECT TO HEAT STRESS
Doi:http://dx.doi.org/10.1590/1809-4430-Eng.Agric.v35n6p 967-978/2015
LUCAS H. P. ABREU1, TADAYUKI YANAGI JUNIOR2, ÉDISON J. FASSANI3, ALESSANDRO T. CAMPOS4, DIAN LOURENÇONI5
ABSTRACT: Given the need to obtain systems to better control broiler production environment, we performed an experiment with broilers from 1 to 21 days, which were submitted to different intensities and air temperature durations in conditioned wind tunnels and the results were used for validation of a fuzzy model. The model was developed using as input variables: duration of heat stress (days), dry bulb air temperature (°C) and as output variable: feed intake (g) weight gain (g) and feed conversion (g.g-1). The inference method used was Mamdani, 20 rules have been prepared and the defuzzification technique used was the Center of Gravity. A satisfactory efficiency in determining productive responses is evidenced in the results obtained in the model simulation, when compared with the experimental data, where R2 values calculated for feed intake, weight gain and feed conversion were 0.998, 0.981 and 0.980, respectively.
KEYWORDS: fuzzy logic, animal environment, poultry.
MODELAGEM FUZZY DO DESEMPENHO DE FRANGOS DE CORTE, CRIADOS DE 1 A 21 DIAS, SUBMETIDOS A ESTRESSE TÉRMICO
RESUMO: Diante da necessidade de se obter sistemas, para melhor controlar o ambiente de produção de frangos de corte, foi realizado um experimento com frangos de corte de 1 a 21 dias, os quais foram submetidos a diferentes intensidades e durações de temperaturas do ar em túneis de vento climatizados, e os resultados foram utilizados para a validação de um modelo fuzzy. O modelo foi desenvolvido, utilizando como variáveis de entrada: duração do estresse térmico (dias), temperatura de bulbo seco do ar (°C) e, como variável de saída: consumo de ração (g), ganho de peso (g) e conversão alimentar (g.g-1). O método de inferência utilizado foi o de Mamdani, tendo sido elaboradas 20 regras, e a técnica de defuzzificação usada foi a do Centro de Gravidade. Nos resultados, obtidos na simulação do modelo, quando comparados com os dados experimentais, evidencia-se uma eficiência satisfatória na determinação das respostas produtivas, nas quais os valores de R2 calculados, para consumo de ração, ganho de peso e conversão alimentar, foram de 0,998; 0,981 e 0,980, respectivamente.
PALAVRAS-CHAVE: Lógica fuzzy, ambiência animal, avicultura.
INTRODUCTION
In Brazil poultry stands out for its importance and relevance in the national scene, in which it currently occupies the first position in the ranking as poultry exporter and third place as a global producer (UBABEF, 2013).
adequate nutritional level in aseptic environment and adjusted to the poultry’s needs (YANAGI JÚNIOR et al., 2011).
According to PEREIRA et al. (2011a), the broiler production environment is differentiated in physical, air, thermal, biological, acoustic and social aspects. In the breeding system, thermal factors directly influence the broiler, due to the change in the maintenance of homeothermy (BARBOSA FILHO et al., 2009; MENEGALI et al., 2009).
According to ABREU et al. (2012), in order for the poultry to control its body temperature, it is important that it is placed in an environment that determines thermal comfort which preserves its body temperature. However, the poultry’s thermoregulatory system is not properly formed in the first weeks of life (SILVA et al., 2009) and, if subjected to heat stress during this period, may be affected in its well-being and, as a result, its performance.
In this context, the maintenance of thermal environment within comfort ranges is imperative for broilers, so that all the genetic potential of a lineage can be tapped. Therefore, the development of algorithms (mathematical models) of control that can be embedded in microcontrollers becomes necessary (PEREIRA et al., 2011b; BELTRAME et al., 2012). Among the possible models to be developed, those based on artificial intelligence, specifically, the fuzzy methodology has shown to be the most appropriate.
Studies have shown good efficiency in the use of the fuzzy methodology, when applied to assist in making decisions that are specified by the presence of uncertainty in claims of "yes" and "no" (FERREIRA et al., 2010). Thus, the fuzzy system can be used to predict the performance of broiler chickens under different intensities and durations of heat stress during the second week of life (WANG et al., 2008; ABORISADE & STEPHEN, 2014; MIRZAEE-GHALEH et al., 2015).
In this context, the aim of the present research was to develop a fuzzy model capable of predicting the feed intake, weight gain and feed conversion of broiler chickens raised from 1 to 21 days, subjected to different intensities and heat stress durations during the second week of life, thus enabling to provide critical information for the proper handling of poultry, in order to increase productivity by controlling the thermal environment.
MATERIAL AND METHODS
For modeling development, this research was divided into two steps. The first part consisted of submitting the broilers to different heat stress intensities and periods throughout the second week. The other phase involved data collection to develop a model able to predict feed intake, weight gain and poultry feed conversion.
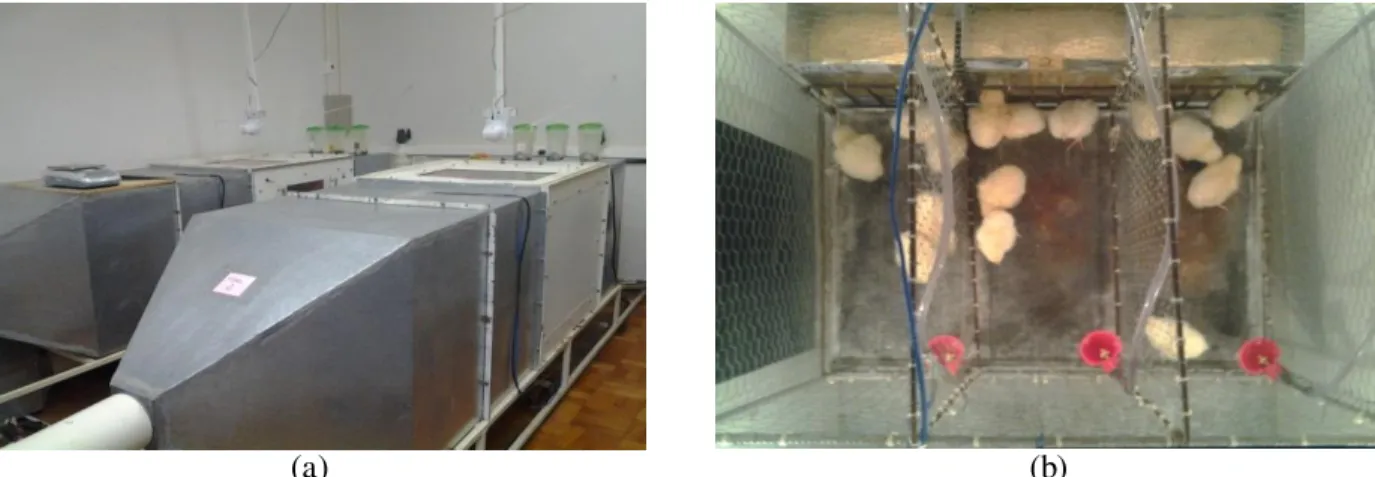
Data collection was carried out in four conditioned wind tunnels, housed in a laboratory with an area of 31.92 m2 (5.6 mx 5.7 m), whose ceiling height is 3.5 m, equipped with two air-conditioning systems with a power of 5,275 kW (18,000 BTUs) each, used to maintain the temperature inside the experimental room. Each air-conditioned tunnel (Figure 1a) has a cage with dimensions of 0.40 x 0.60 meters, divided into 3 equal parts with dimensions of 0.08 m² (Figure 1b).
F
(a) (b)
FIGURE 1. a) Air-conditioned wind tunnels. b) Top view of the cages housing the broilers inside the air-conditioned wind tunnels.
A bird from each partition was removed weekly and taken to a production environment, thus, by the third week of life only three birds remained in each partition, keeping the stocking density recommended by the COBB Manual (2008).
During the trial period, balanced feed was provided to the birds, being formulated based on corn and soybean meal and following the nutritional recommendations of ROSTAGNO et al. (2011). We measured body mass and mean daily ad libitum water and feed intake for each bird. Wind tunnels and cages were also cleaned daily to prevent gas formation and provide a suitable environment for poultry performance. The experiment was conducted in four batteries and 13 different treatments; birds’ performance was assessed for each treatment throughout 21 days, considering three replicates for each treatment. During the first and third weeks of life, temperatures were remained at thermoneutral zone, i.e., 32 to 34 °C and 26 to 28 °C, respectively (CONY & ZOCCHE, 2004). In each battery, four air temperatures were evaluated in the second week of bird life (33 ˚C, 30 ˚C, 27 ˚C and 24 ˚C), from the eighth day of life on. Temperature levels were selected regarding the optimal temperature ranges recommended in literature for the second week of bird life (CONY & ZOCCHE, 2004; CURTIS, 1983), with its lower and upper limits extrapolated to obtain discomfort conditions by low temperatures (27 °C and 24 °C) and high temperature (33 °C).
Four levels of heat stress duration were evaluated: 1, 2, 3 and 4 days, and right after that, temperatures returned normal within comfortable zone. During all tests, relative humidity was maintained at 60 ± 1% and air speed at 0.2 ±-0.1m.s-1, which is characterized as comfortable for animals. Brightness was adjusted by a dimmer with the aid of a light meter (LDR-380, accuracy of ± 3%), and the intensity levels were defined according to the COBB Manual (2008); for the first, second and third weeks, the values were fixed at 25 lux, 10 lux to 5 lux, respectively. Table 1 lists the treatments evaluated.
TABLE 1. Air temperature and stress condition days applied to broilers from 1 to 21 days of age, kept in air-conditioned wind tunnels.
Battery Tunnel 1 a 7 8 9 10 Days of life11 12 13 14 15 a 21
1
A
33°C
33°C 30°C 30°C 30°C 30°C 30°C 30°C
27°C
B 33°C 33°C 30°C 30°C 30°C 30°C 30°C
C 33°C 33°C 33°C 30°C 30°C 30°C 30°C
D 33°C 33°C 33°C 33°C 30°C 30°C 30°C
2
A
33°C
27°C 30°C 30°C 30°C 30°C 30°C 30°C
27°C
B 27°C 27°C 30°C 30°C 30°C 30°C 30°C
C 27°C 27°C 27°C 30°C 30°C 30°C 30°C
D 27°C 27°C 27°C 27°C 30°C 30°C 30°C
3
A
33°C
24°C 30°C 30°C 30°C 30°C 30°C 30°C
27°C
B 24°C 24°C 30°C 30°C 30°C 30°C 30°C
C 24°C 24°C 24°C 30°C 30°C 30°C 30°C
D 24°C 24°C 24°C 24°C 30°C 30°C 30°C
4 A, B, C e D 33°C 30°C 27°C
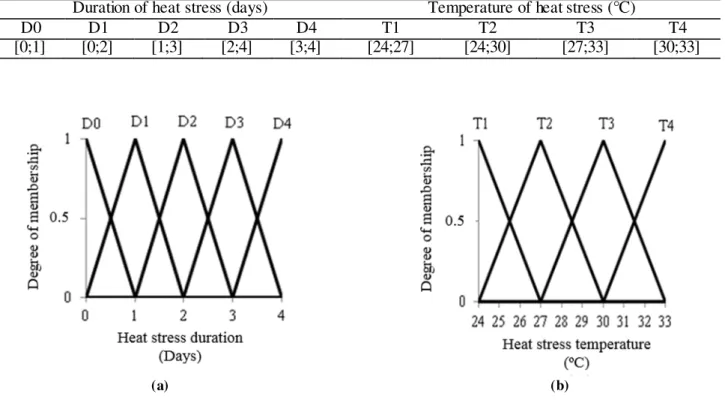
The sets were designed to characterize each variable and a membership function was determined for each set. Seeking to quantify the importance of temperature variation in the second week of life, in this research the input variables attributed were duration (days) and temperature of heat stress (°C). Thus, the ranges for each input variable were determined, as shown in Table 2, and their respective membership functions (Figure 2). For choosing the best curve shape for the membership functions preliminary tests were carried out, in which it was found that the triangular curves would satisfactorily represent the input and output data for resulting in lower standard deviation values.
TABLE 2. Input variables sets.
Duration of heat stress (days) Temperature of heat stress (°C)
D0 D1 D2 D3 D4 T1 T2 T3 T4
[0;1] [0;2] [1;3] [2;4] [3;4] [24;27] [24;30] [27;33] [30;33]
(a) (b)
FIGURE 2. Membership functions for the input variables: a) Duration of heat stress (days), b) Heat stress temperature (°C).
F
preliminary tests, thereby being used by many authors (SANTOS et al., 2009; PONCIANO et al., 2012).
The Mamdani inference method was applied to perform all the fuzzy reasoning. This method provides the responses of a set according to the combinations of input values with their relative membership degrees, through a minimum operator and, then, through definitions of the rules b y the maximum operator (LEITE et al., 2010). The method Center of Gravity (Centroid or Center Area) was used in defuzzification, in which it admits all output alternatives, converting the sets into numerical values (LEITE et al., 2010).
(a) (b)
Caption
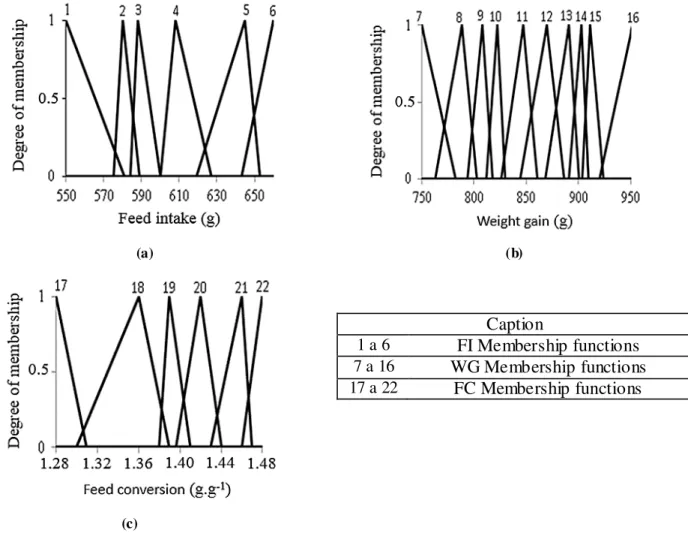
1 a 6 FI Membership functions
7 a 16 WG Membership functions
17 a 22 FC Membership functions
(c)
FIGURE 3. Membership functions for the output variables: a) feed intake (g), b) weight gain (g) and c) feed conversion (g.g-1).
TABLE 3. Fuzzy inference set of rules for heat stress duration (HD) and heat stress temperature (ST).
Rules
1 If (Duration is D1) and (Temperature is T1) then (WG is 16) and (FI is 5) and (FC is 22) 2 If (Duration is D1) and (Temperature is T2) then (WG is 8) and (FI is 3) and (FC is 20) 3 If (Duration is D1) and (Temperature is T3) then (WG is 7) and (FI is 3) and (FC is 17) 4 If (Duration is D1) and (Temperature is T4) then (WG is 15) and (FI is 6) and (FC is 19) 5 If (Duration is D2) and (Temperature is T1) then (WG is 14) and (FI is 4) and (FC is 22) 6 If (Duration is D2) and (Temperature is T2) then (WG is 8) and (FI is 3) and (FC is 18) 7 If (Duration is D2) and (Temperature is T3) then (WG is 7) and (FI is 3) and (FC is 17) 8 If (Duration is D2) and (Temperature is T4) then (WG is 10) and (FI is 2) and (FC is 20) 9 If (Duration is D3) and (Temperature is T1) then (WG is 14) and (FI is 4) and (FC is 21) 10 If (Duration is D3) and (Temperature is T2) then (WG is 13) and (FI is 5) and (FC is 19) 11 If (Duration is D3) and (Temperature is T3) then (WG is 7) and (FI is 3) and (FC is 17) 12 If (Duration is D3) and (Temperature is T4) then (WG is 8) and (FI is 1) and (FC is 19) 13 If (Duration is D4) and (Temperature is T1) then (WG is 12) and (FI is 3) and (FC is 21) 14 If (Duration is D4) and (Temperature is T2) then (WG is 11) and (FI is 2) and (FC is 21) 15 If (Duration is D4) and (Temperature is T3) then (WG is 7) and (FI is 3) and (FC is 17) 16 If (Duration is D4) and (Temperature is T4) then (WG is 9) and (FI is 1) and (FC is 21) 17 If (Duration is D0) and (Temperature is T1) then (WG is 7) and (FI is 3) and (FC is 17) 18 If (Duration is D0) and (Temperature is T2) then (WG is 7) and (FI is 3) and (FC is 17) 19 If (Duration is D0) and (Temperature is T3) then (WG is 7) and (FI is 3) and (FC is 17) 20 If (Duration is D0) and (Temperature is T4) then (WG is 7) and (FI is 3) and (FC is 17)
The methodology proposed by CORNELISSEN et al. (2002) was used for the choice of experts, as used by ESCOBAR & GALINDO (2004), YANAGI JÚNIOR et al. (2012), CAMPOS et al. (2013). Three experts helped in the development of rules, all with over ten years of experience in the areas of animal ambience, zootechnics and mathematical modeling.
According to the combinations of heat stress duration and temperature, 20 rules were defined and, for each rule, a weighting factor of 1 was assigned, since all the rules have the same importance in determining the model responses, as adopted by various authors (CREMASCO et al., 2010; YANAGI JÚNIOR et al., 2012; SCHIASSI et al., 2014). Furthermore, tests performed by assigning other weights to the rules did not result in reduction of simulation errors.
To perform validation of mathematical modeling, all the data collected in the first phase of this research were used, in which broiler chickens of Cobb lineage were submitted to different intensities and stress durations during the second week of life and their performance analyzed for 21 days.
The simulations were employed with the help of the Fuzzy Toolbox® by Matlab®, software version 7,13,0,564 (R2011b), where all the modeling was developed. In the evaluation of the proposed model, the productive responses of poultry were simulated and compared with data experimentally acquired by standard deviation and the percentage error.
In a broader scope, the objective with these tests is to assess the ability of modeling to predict the values for FI, WG and FC, addressing all probable combinations of initial variables. Thus, the performance of broiler chickens provided as system response can be used as a tool for decision making in the control of the productive environment in case of heat stress.
RESULTS AND DISCUSSION
F
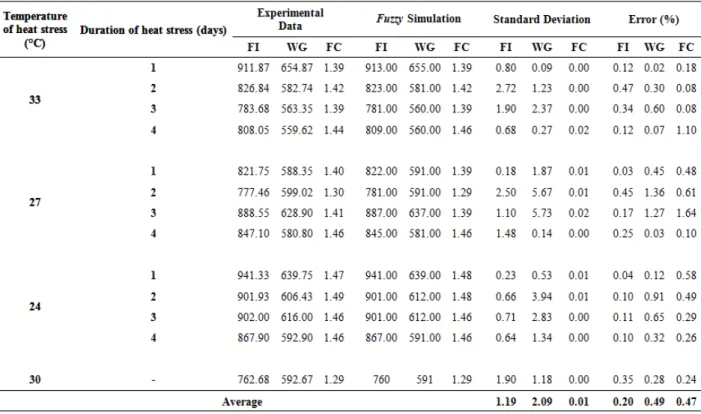
According to ABREU et al. (2000), the birds subjected to heat stress by low temperatures increase their FI, but there is no improvement in bird performance, because part of the energy intake is used to produce heat. This effect is clear in the experiment performed (Table 4), in which the birds subjected to heat stress in a temperature of 24 °C, with an intensity of 4 days during the second week of life had FI, WG and FC of 867.9 g; 592.9 g 1.46 g g-1, respectively, but in the control treatment in which they were submitted to a temperature of 30 °C during the second week, which is considered comfortable (SILVA et al. 2009), they presented FI, WG and FC of 762.68 g; 592.67 g and 1.29 g g-1, i.e., with the thermal stress the birds consumed approximately 100 g more, while the WG was practically the same.
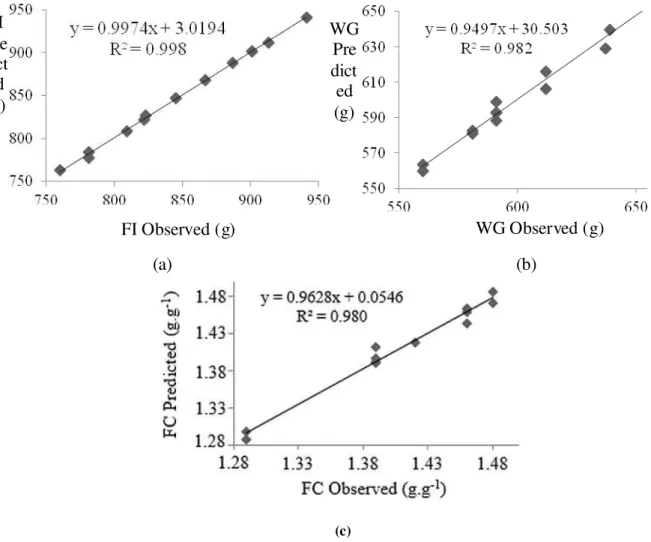
The average values of standard deviations for FI, WG and FC were 1.19 g; 2.09 g 0.01g g-1, respectively, and the respective percentage errors were 0.20%, 0.49% and 0.47% (Table 3). In the research conducted by PONCIANO et al. (2012) to predict the productive performance of broilers from 1 to 21 days old using the mathematical model, average values of standard deviations of 4.31 g; 4.76 g and 0.02 g g-1 were obtained, respectively, and percentage errors of 2.38; 2.94 and 2.16%, thereby demonstrating the efficiency of the fuzzy model proposed to simulate the productive responses.
TABLE 4. Comparison of feed intake values (FI, g), weight gain (WG, g) and feed conversio n (FC, g.g-1), for broilers of 1 to 21 days old, obtained experimentally and simulated b y the model.
(a) (b)
(c)
FIGURE 4. Linear regressions of productive responses measured experimentally and simulated: a) feed intake (FI); b) weight gain (WG) and c) feed conversion (FC) for broilers from 1 to 21 days old.
According to the COBB manual (2008), the cumulative feed conversion for broilers raised in comfortable conditions for mixed birds in the third week is 1.247 g g-1. In the experiment performed, the value of feed conversion found when the birds were not subjected to stress was 1.290 g g-1, thus determining a standard deviation of 0.02 g g-1 and a percentage error of 3.44%.
The birds subjected to a temperature of 30 °C in the second week of life obtained a better feed conversion than with other temperatures. Thus, it is possible to conclude that the ideal temperature for broilers in the second week of life is 30 °C, confirming the comfort temperature during the second week according to YOUSEF (1985); MAY & LOT (2000) and MEDEIROS et al., (2001).
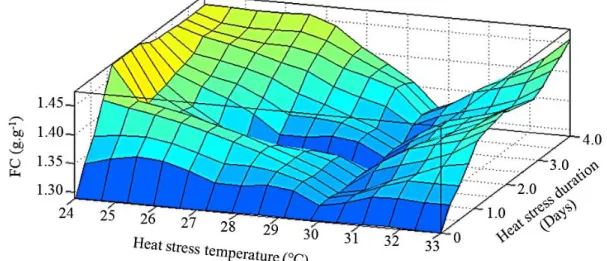
The surface shown in Figure 5 illustrates the interaction between temperature and duration of thermal stress considering the FC. The depressions in the temperature range between 29 and 31 (°C) indicate that the best feed conversion occurred. The analysis can be made with respect to the days of thermal stress and temperature adopted. We can observe that when the stress duration was 4 days, the worst feed conversion values were obtained, and the same occurred with different temperatures, that is, the more outside the comfort range of 28 to 32 °C (MACARI et al., 2004), the worse the feed conversion. Thus, it can be stated that in order to evaluate the performance of broiler chickens subjected to stress, the interaction of heat stress temperature along with the duration of that same temperature should be used.
When the birds were subjected to stress at low temperatures, we can see that as the temperature decreases, feed conversion worsens, so for the duration of 1 to 3 days of stress, feed conversion showed worsening of 0.031 g g-1 and 0.028 g g-1, respectively, for each stress level. For 2 days of stress the surface demonstrates that up to the temperature of 27 °C, birds, even when
FI Observed (g) FI
Pre dict ed (g)
WG Observed (g) WG
F
suffering a thermal stress, still remained with the same performance as the birds subjected to comfort conditions. This may be due to the fact that birds modify their behavior, crowding and thus reducing feed intake, however, from the third day of stress on there was a compensatory gain, increasing feed intake as shown in Table 3.
FIGURE 5. Feed conversion (FC) simulated depending on the temperature of heat stress and duration of heat stress for broilers from 1 to 21 days old.
For 4 days of stress duration at low temperatures, there was a worsening in feed conversion of 0.056 g g-1 for each stress level until the temperature of 27 °C, remaining virtually constant until the temperature of 24 °C. For the thermal stress at high temperatures, the surface shows that, for all durations, feed conversion increases on average 0.041 g g-1 for each stress level the bird has gone through.
Therefore, according to the findings of this study, it is concluded that the proposed fuzzy model can be used to predict the FI, WG and FC, depending on thermal stress temperature and duration. The joint analysis of the thermal environment and production responses of birds provides a more detailed review of the production process, thus permitting a better efficiency in heating and cooling systems.
CONCLUSIONS
The experiment in climate-controlled wind tunnels provided the assessment of air temperature influence on broiler performance during the first 21 days.
The fuzzy modeling can be used to predict efficiently the productive responses of broiler chickens aged between 1 and 21 days, when subjected to different intensities and durations of heat stress, and can thus be adapted to heat-treatment systems to support the decisions.
ACKNOWLEDGEMENTS
REFERENCES
ABREU, P. G.; BAETA, F. C.; ABREU, V. M. N. Desempenho produtivo e bioeconômico de frangos de corte criados em diferentes sistemas de aquecimento. Revista Brasileira de Zootecnia, Viçosa, MG, v. 29, n.1, p.159-167, jan./fev. 2000.
ABREU, P. G. de; ABREU, V. M. N.; COLDEBELLA, A.; HASSEMER, M. J.; TOMAZELLI, I. L. Medidas morfológicas em função do peso e da idade da ave, por meio de imagens. Revista Brasileira de Engenharia Agrícola e Ambiental, Campina Grande, v.16, n.7, p.795‑801, jul. 2012.
ABORISADE, D. O.; STEPHEN, O. Poultry house temperature control using Fuzzy-PID controller. IJETT, Chennai, v.11, n.6, p. 310-314, 2014.
BARBOSA FILHO, J. A. D.; VIEIRA, F. M. C.; SILVA, I. J. O. Transporte de frangos:
caracterização do microclima na carga durante o inverno. Revista Brasileira de Zootecnia, Viçosa, v.38, n.12, p.2442-2446, dez. 2009.
BELTRAME, E. V.; PETRY, C. A.; MUSSA, S. A. implementação de um controlador fuzzy para conversor buck em microcontroldor AVR de 8 bits. Revista Ilha Digital, Florianópolis, v.3, p.41-46, 2012.
CAMPOS, A.T.; CASTRO, J.O.; SCHIASSI, L.; YANAGI JUNIOR, T.; PIRES, M. F. Á.; MATTIOLI, C.C. Prediction of free-stall occupancy rate in dairycattle barns through fuzzy sets. Engenharia Agrícola, Jaboticabal, v. 33, n.6, p.1079-1089, dez. 2013.
CHERRI, A. C.; ALEM JÚNIOR, D. J.; SILVA, I. N. da. Inferência fuzzy para o problema de corte de estoque com sobras aproveitáveis de material. Pesquisa Ope racional, Rio de Janeiro, v.31, n.1, p.173-195, jan./abr. 2011.
COBB. Broiler Management Guide. Arkansas: Cobb-Vantress, 2008. 65p. Disponível em:<http://67.43.0.82/docs/default-source/guides/cobb-broiler-management-guide---english.pdf?sfvrsn=8>. Acesso em: 2 jan. 2014.
CONY, A.V.; ZOCCHE, A.T. Manejo de frangos de corte. In: MENDES, A.; NÄÄS, I. de A.; MACARI, M. (Ed.). Produção de frangos de corte. Campinas: Facta, 2004. p.118‑136. CORNELISSEN, A. M. G.; VAN DEN BERG, J.; KOOPS, W. J.; KAYMAK, U. Elicitation of expert knowledge for fuzzy evaluation of agricultural production systems. Agriculture,
Ecosystems & Environment, Rotterdam, v. 95, n. 1, p. 1-18, set. 2002.
CREMASCO, C.P.; GABRIEL FILHO, L.R.A.; CATANEO, A. Metodologia de determinação de funções de pertinência de controladores fuzzy para a avaliação energética de empresas de avicultura de postura. Revista Energia na Agricultura, Botucatu, v.25, n.1, p.21-39, 2010.
CURTIS, S. E. Environmental management in animal agriculture. Ames: The Iowa State University, 1983. 410 p.
ESCOBAR, C.; GALINDO, J. Fuzzy control in agriculture: simulation software. In: INDUSTRIAL SIMULATION CONFERENCES, 2004, Malaga. p.45-49.
FERREIRA, L.; YANAGI JÚNIOR, T.; LOPES, A. Z.; LACERDA, W. S. Desenvolvimento de uma rede neuro-fuzzy para predição da temperatura retal de frangos de corte. RITA, Porto Alegre, v.17, n.2, p.221-233. 2010.
LEITE, M. S.; FILETI, A. M. F.; SILVA, F. V. Desenvolvimento e aplicação experimental de controladores fuzzy e convencional em um bioprocesso. Revista Controle & Automação, Campinas, v.21, n.2, p. 147-158, mar./abr. 2010.
MACARI, M.; FURLAN, R.L.; MAIORKA, A. Aspectos fisiológicos e de manejo para manutenção da homeostase térmica e controle de síndromes metabólicas. In: MENDES, A.A.; NÄÄS, I.A.;
F
MARCHINI, C. F. P.; SILVA, P. L.; NASCIMENTO, M. R. B. M.; BELETTI, M. E.;
GUIMARÃES, E. C.; SOARES, H. L. Intestinal morphometry of the duodenal mucosa in broiler chickens underwent to high cyclic environment temperature. Arquivo Brasileiro de Medicina Veterinária e Zootecnia, Belo Horizonte, v.61, n.2, p.491-497, abr. 2009.
MAY, J. D.; LOTT, B. D. The Effect of environmental temperature on growth and feed conversion of broilers to 21 days of age. Poultry Science, Savoy, v.79, p.669–671. mai. 2000.
MEDEIROS, C. M. Ajuste de modelos e determinação de índice térmico ambiental de produtividade para frangos de corte. 2001. 115f. Tese (Doutorado em Engenharia Agrícola) - Universidade Federal de Viçosa, Viçosa, 2001.
MENEGALI, I.; TINOCÔ, I. F. F.; BAÊTA, F. C.; CECON, P. R.; GUIMARÃES, M. C. C.; CORDEIRO, M. B. Ambiente térmico e concentração de gases em instalações para frangos de corte no período de aquecimento. Revista Brasileira de Engenharia Agrícola e Ambiental, Campina Grande, v.13, supl.0, p.984–990, nov./dez. 2009.
MIRZAEE-GHALEH, E.; OMID, M.; KEYHANI, A.; DALVAND, M. J. Comparison of fuzzy and on/off controllers for winter season indoor climate management in a model poultry house.
Computers and Electronics in Agriculture, New York, v.110, p.187-195, 2015
PEREIRA, D. F.; OLIVEIRA, S. C.; PENHA, N. L. J. Logistic regression to estimate the welfare of broiler breeders in relation to environment al and behavioral variables. Engenharia Agrícola, Jaboticabal, v.31, n.1, p.33-40, jan./fev. 2011a.
PEREIRA, J. M.; LIMA FILHO, E. D. J.; LIMA, L. R.; DE SOUSA, K. T. Sistema de controle de temperatura em um duto de ar utilizando lógica fuzzy embarcada em um microcontrolador
dspic30F. Revista de Controle e Automação, Belém, v.1, n.1, 2011b.
PONCIANO, P. F.; YANAGI JUNIOR, T.; SCHIASSI, L.; CAMPOS, A. T.; NASCIMENTO, J. W. B. Sistema fuzzy para predição do desempenho produtivo de frangos de corte de 1 a 21 dias de idade. Engenharia Agrícola, Jaboticabal, v.32, n.3, p.446-458, jun. 2012.
ROSTAGNO, H. S.; ALBINO, L. F. T.; DONZELE, J. L.; GOMES, P. C.; OLIVEIRA, R. F.; LOPES, D. C.; FERREIRA, A. S.; BARRETO, S. L. T.; EUCLIDES, R. F. Tabelas brasileiras para aves e suínos: composição de alimentos e exigências nutricionais. 3.ed. Viçosa: Universidade Federal de Viçosa, 2011. 252p.
SANTOS, R. C.; NÄÄS, I. A.; MOREIRA, F. R.; GOMES FILHO, R. Aplicação da lógica
nebulosa na simulação de estro de vacas leiteiras. Enciclopédia Biosfera, Goiânia, v.5, n.8, p.1-6, ago.2009.
SCHIASSI, L.; YANAGI JÚNIOR, T.; DAMASCENO, F. A.; SARAZ, J. A. O.; AMARAL, A. G. Thermal-acoustic comfort index for workers of poultry houses using fuzzy modeling. International Journal of Engineering Research and Applications (IJERA), Ghaziabad, v.4, p.60-64, set. 2014. SILVA, V. K.; SILVA, J. D. T.; GRAVENA, R. A.; MARQUES, R. H.; HADA, F. H.; MORAES, V. M. B. Desempenho de frangos de corte de 1 a 21 dias de idade alimentados com rações contendo extrato de leveduras e prebiótico e criados em diferentes temperaturas. Revista Brasileira de Zootecnia, Viçosa, v.38, n.4, p.690-696, abr. 2009.
UBABEF - UNIÃO BRASILEIRA DE AVICULTURA. Relatório anual 2013. Disponível em:
<http://www.ubabef.com.br/files/publicacoes/732e67e684103de4a2117dda9ddd280a.pdf>. Acesso em: 20 dez. 2013.
YANAGI JÚNIOR, T.; SCHIASSI, L.; ABREU, L. H. P.; BARBOSA, J. A.; CAMPOS, A. T. Procedimento fuzzy aplicado à avaliação da insalubridade em atividades agrícolas. Engenharia Agrícola, Jaboticabal, v.32, n.3, p.423-434, maio/jun. 2012.
YANAGI JÚNIOR, T.; AMARAL, A. G.; TEIXEIRA, V. H.; LIMA, R. R. Caracterização espacial do ambiente termoacústico e de iluminância em galpão comercial para criação de frangos de corte. Engenharia Agrícola, Jaboticabal, v.31, n.1, p.1-12, jan./fev. 2011.