ISSN: 1809-4430 (on-line) www.engenhariaagricola.org.br
2 Federal University of Lavras/ Lavras - MG, Brazil.
Received in: 6-12-2018
Doi: http://dx.doi.org/10.1590/1809-4430-Eng.Agric.v38n6p813-823/2018
PERFORMANCE OF FUZZY INFERENCE SYSTEMS TO PREDICT THE SURFACE
TEMPERATURE OF BROILER CHICKENS
Marcelo Bahuti
1*, Lucas H. P. Abreu
2, Tadayuki Yanagi Junior
2, Renato R. de Lima
2,
Alessandro T. Campos
21*Corresponding author. Federal University of Lavras/ Lavras - MG, Brazil. E-mail: [email protected]
KEYWORDS
pertinence functions,
fuzzy logic,
defuzzification
methods, fuzzy
inference methods,
chicks, infrared
thermography.
ABSTRACT
This study aimed to compare fuzzy systems with different configurations to predict the
surface temperature (t
s) of broiler chickens subjected to different intensities and durations
of thermal challenges in the second week of life. Data on the t
sof broiler chickens aged 8
to 11 days were acquired by infrared thermography and subjected to combinations of four
dry-bulb temperatures (t
db) (24, 27, 30, and 33 ºC) and four durations of thermal
challenges (DTC) (1, 2, 3, or 4 days). The input variables of the fuzzy systems were t
dband DTC, and the output variable was t
s. The Mamdani inference method involving five
defuzzification methods [center of gravity (centroid), bisector of the area (bisector),
largest of maximum (lom), middle of maximum (mom), and smallest of maximum (som)],
and Sugeno inference with two defuzzification methods [weighted average (wtaver) and
weighted sum (wtsum)] were evaluated. For both inference methods, triangular and
Gaussian pertinence functions were tested for input and output variables, except for
Sugeno inference, which used singletons functions as output variables. While developing
fuzzy systems, different configurations must be compared, and the system with smaller
simulation errors should be selected.
INTRODUCTION
The thermal environment affects poultry production in Brazil and is a challenge to the application of confinement techniques because of the large territorial extension of the country (Ferraz et al., 2014). In addition, the increased consumption of chicken meat demands the application of new techniques to better explore the genetic potential of poultry to meet internal and external consumption demands (Nascimento et al., 2011; Abreu et al. 2015).
The microclimatic conditions in the breeding environment have a strong effect on the thermal comfort of broiler chickens (Mirzaee-Ghaleh et al., 2015). Among the environmental factors, air temperature and relative humidity are the most relevant to poultry because they affect the control of body temperature and heat exchange for maintaining homeothermy (Costa et al., 2012; Ferreira et al. 2012).
Energy expenditure to maintain homeothermy leads to physiological changes in the surface temperature of birds and compromises animal performance (Oliveira et al., 2006). Surface temperature is a rapid response to
discomfort caused by changes in ambient temperature (Dahlke et al., 2005).
Among the technologies available for measuring surface temperature, infrared thermography has been used in several studies to identify physiological peaks in birds, including broiler chickens (Nascimento et al., 2014), laying hens (Souza Junior et al., 2013a), quails (Souza Junior et al., 2013b), and turkeys (Mayes et al., 2014), because this technique is noninvasive and does not require contact with the animals, preventing stress.
To perform embedded control in systems and predict the productive responses of broiler chickens, fuzzy models have good efficiency in poultry husbandry (Ponciano et al., 2012; Schiassi et al., 2015) and other fields, including civil engineering (Wang et al., 2005), agriculture (Kisi, 2013), and medicine (Salgado et al., 2016), indicating the diversity of applications and efficiency in data representation.
fuzzy sets, or the Takagi & Sugeno type (1985), in which the consequent is formed by a constant value based on input data (Raj & Mohan, 2016).
This study focused on comparing fuzzy systems with different configurations to predict the surface temperature of broiler chickens subjected to different intensities and times of thermal treatment in the second week of life.
MATERIAL AND METHODS
The study was conducted using four climate-controlled wind tunnels. Each wind tunnel contained a cage (0.24 m²) with three divisions, which corresponded to the repetitions in each cage. Twenty-five broiler chickens of the Cobb 500 breed were used, with 60 animals per stage (a total of four stages) and 15 animals per tunnel (five per division), respecting the housing density and avoiding adverse effects on animal welfare (Cobb, 2013, Castilho et al., 2015). One animal was withdrawn each week to keep the housing density at levels recommended by the Breed Guide, leaving three birds per cage division at the end of the third week.
Broiler chickens aged 8 to 11 days were housed in the climate-controlled wind tunnels and subjected to four dry-bulb temperatures (tdb) (24, 27, 30, and 33 ºC) and four durations of thermal challenge (DTC) (1, 2, 3, or 4 days), totaling 16 treatments. After exposure to thermal treatment, the tdb was maintained at 30 ºC, which is considered the comfort temperature in the second week of life of the animals. In the breeding period preceding the study, i.e., in the first week of bird life, tdb was maintained at 33 C to provide thermal comfort to birds (Cony & Zocche, 2004; Schiassi et al., 2015).
Relative humidity and air velocity were maintained at 60 ± 1% and 0.2 ± 0.1 m s-1, respectively, which are considered comfort conditions for broiler chickens by providing good air quality and meet the oxygen demand of the animals without changing the temperature or decreasing thermal comfort (Medeiros et al., 2005; Carvalho et al., 2011). The light intensities of 25, 10, and 5 lux were used in the first, second, and third weeks of life, respectively (Cobb, 2013).
Water and feed were available ad libitum. The climate-controlled wind tunnels and cages were cleaned daily to avoid the accumulation of gases and making the
environment compatible with the physiological needs of the animals (Sousa et al., 2016).
The thermographic images of the study animals were measured using a thermographic camera (accuracy of 0.05 C) with an emissivity of 0.95 (Nääs et al., 2014). The equipment was positioned above the cages externally to each tunnel. A plastic film was placed over each tunnel near the cage to allow image acquisition. The thermographic images were analyzed using Fluke Smart View software, and the average surface temperature (ts) was obtained on the surface of the head, neck, back, and wings of three birds, one in each division of the cage.
After data collection, fuzzy modeling was started by establishing the membership functions for data input (tdb and DTC) and output (ts). The fuzzy logic toolbox of MATLAB R2009a has two types of controllers, Mamdani and Sugeno, and each controller allows performing defuzzification and membership functions for both input and output data.
Five defuzzification methods were used in Mamdani inference: center of gravity of the area (centroid), the bisector of the area (bisector), largest of maxima (lom), middle of maxima (mom), and smallest of maxima (som). In contrast, the Sugeno controller has only two types of defuzzification: weighted average (wtaver) and weighted sum (wtsum).
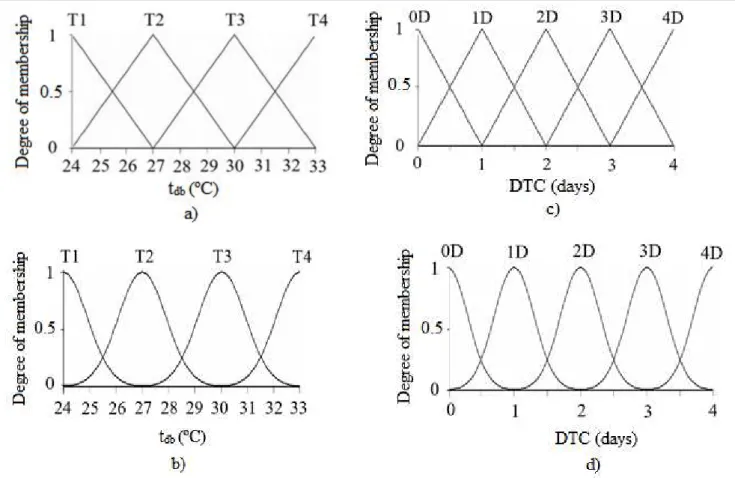
Triangular and Gaussian membership functions were used for the input variables in both inference methods (Figure 1). For the output variable, triangular and Gaussian membership functions were used for the Mamdani controller, and singletons functions were used for the Sugeno controller because these functions were representative of the input variables (Figure 2).
The rule system was developed on the basis of the combinations of inputs (total of 20), which were assigned a weight of 1 to establish relevant equality for each rule and reach associations able to optimized the parameters (Sargolzaei et al., 2008; Abreu et al., 2015).
FIGURE 1. Triangular membership functions (a and c) and Gaussian membership functions (b and d) applied to two input variables: dry-bulb temperature (tdb) and duration of thermal challenge (DTC).
The experimental data obtained using infrared thermography were used to test the fuzzy models. The models were compared using descriptive statistics, including the mean standard deviation (S), mean percentage error (MPE), mean absolute error (MAE), determination coefficient (R2), and root mean square error (RMSE).
RESULTS AND DISCUSSION
In the first three weeks of life, the maintenance of thermal comfort conditions is essential in broiler chickens, and ts varies as a function of tdb (Abreu et al., 2012). The
results of this study corroborate those of the above study, in which ts was increased or decreased when birds were subjected to high or low tdb values, respectively, and this variation was dependent on the age of the animals.
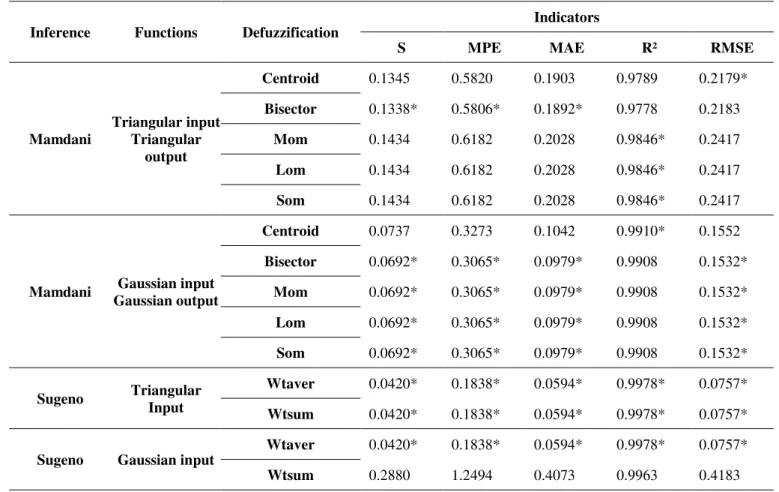
Since the interaction between tdb and DTC was significant (p<0.05, F test) for the mean ts values, 14 fuzzy systems were developed by applying different methods of inference and defuzzification and different types of pertinence functions for predicting ts. The statistical indices used to compare the systems and their respective configurations are shown in Table 1.
TABLE 1. Statistical analysis used to evaluate the configurations of different fuzzy inference systems.
Inference Functions Defuzzification
Indicators
S MPE MAE R² RMSE
Mamdani
Triangular input Triangular
output
Centroid 0.1345 0.5820 0.1903 0.9789 0.2179*
Bisector 0.1338* 0.5806* 0.1892* 0.9778 0.2183
Mom 0.1434 0.6182 0.2028 0.9846* 0.2417
Lom 0.1434 0.6182 0.2028 0.9846* 0.2417
Som 0.1434 0.6182 0.2028 0.9846* 0.2417
Mamdani Gaussian input Gaussian output
Centroid 0.0737 0.3273 0.1042 0.9910* 0.1552
Bisector 0.0692* 0.3065* 0.0979* 0.9908 0.1532*
Mom 0.0692* 0.3065* 0.0979* 0.9908 0.1532*
Lom 0.0692* 0.3065* 0.0979* 0.9908 0.1532*
Som 0.0692* 0.3065* 0.0979* 0.9908 0.1532*
Sugeno Triangular Input
Wtaver 0.0420* 0.1838* 0.0594* 0.9978* 0.0757*
Wtsum 0.0420* 0.1838* 0.0594* 0.9978* 0.0757*
Sugeno Gaussian input
Wtaver 0.0420* 0.1838* 0.0594* 0.9978* 0.0757*
Wtsum 0.2880 1.2494 0.4073 0.9963 0.4183
* Indicates the best results for each fuzzy system in the column.
Legend: S, mean standard deviation; MPE, mean percentage error; MAE, mean absolute error; R2, determination coefficient; RMSE,
root-mean-square error.
Defuzzification methods: center of gravity of the area (centroid), the bisector of the area (bisector), largest of maximum (lom), middle of maximum (mom), smallest of maximum (som), weighted average (wtaver), and weighted sum (wtsum).
Through the Mamdani inference system, the indicators of Gaussian functions were pointed out as better compared to those of triangular functions, regardless of the defuzzification method applied.
The best results were obtained using Sugeno inference, which provided numerically equal results for both triangular and Gaussian functions, except in cases in which wtsum was applied with Gaussian functions. The calculated values of S, MPE, MAE, R2, and RMSE were 0.0420, 0.1838, 0.0594, 0.9978, and 0.0757, respectively.
Kisi (2013) found that Sugeno inference produced better estimates than Mamdani inference, and the analysis of reference evapotranspiration indicated that MAE, RMSE, and R2 values were 0.233, 0.345, and 0.978, respectively, using Mamdani inference, and 0.073, 0.102, and 0.998, respectively, using Sugeno inference. In addition, the
accuracy of Sugeno inference was higher than that of artificial neural networks and empirical models.
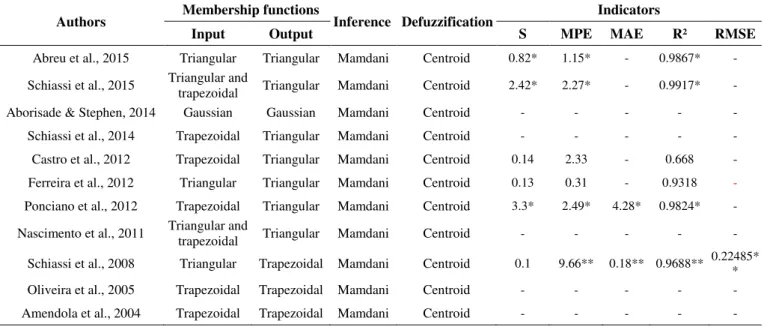
The studies on animal husbandry using broiler chickens and fuzzy composition and performance are shown in Table 2. The analysis of different fuzzy system configurations allowed testing the combinations of pertinence functions, inference and defuzzification methods, and determine the accuracy of these methods (Table 1).
TABLE 2. Fuzzy system configurations used in predictions in poultry and respective statistical indicators.
Authors Membership functions Inference Defuzzification Indicators
Input Output S MPE MAE R² RMSE
Abreu et al., 2015 Triangular Triangular Mamdani Centroid 0.82* 1.15* - 0.9867* -
Schiassi et al., 2015 Triangular and trapezoidal Triangular Mamdani Centroid 2.42* 2.27* - 0.9917* -
Aborisade & Stephen, 2014 Gaussian Gaussian Mamdani Centroid - - - - -
Schiassi et al., 2014 Trapezoidal Triangular Mamdani Centroid - - - - -
Castro et al., 2012 Trapezoidal Triangular Mamdani Centroid 0.14 2.33 - 0.668 -
Ferreira et al., 2012 Triangular Triangular Mamdani Centroid 0.13 0.31 - 0.9318 -
Ponciano et al., 2012 Trapezoidal Triangular Mamdani Centroid 3.3* 2.49* 4.28* 0.9824* -
Nascimento et al., 2011 Triangular and trapezoidal Triangular Mamdani Centroid - - - - -
Schiassi et al., 2008 Triangular Trapezoidal Mamdani Centroid 0.1 9.66** 0.18** 0.9688** 0.22485**
Oliveira et al., 2005 Trapezoidal Trapezoidal Mamdani Centroid - - - - -
Amendola et al., 2004 Trapezoidal Trapezoidal Mamdani Centroid - - - - -
* Average values.
** Values calculated using data from the present study.
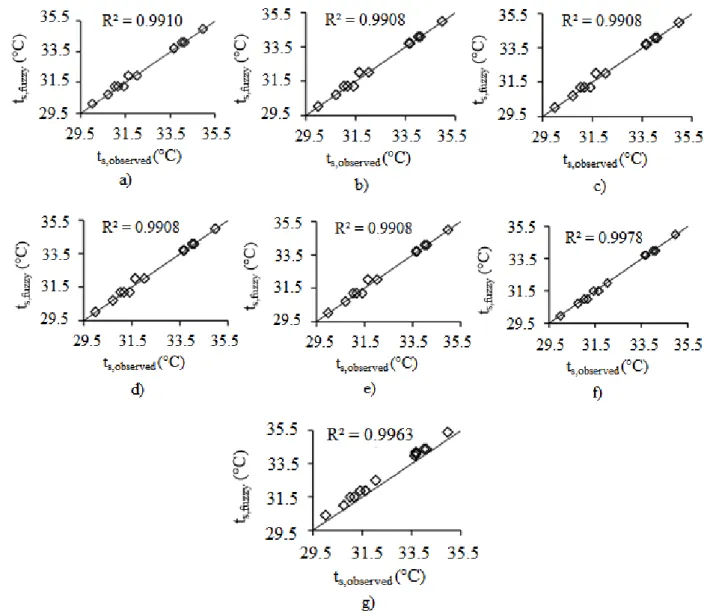
The correlation graphs of ts values obtained experimentally and predicted by fuzzy systems and respective R2 values are shown in Figures 3 and 4. The adjustment of the line with a slope of 45º that passes through the origin allows determining the accuracy and the values of equivalence, overestimation, or underestimation between the observed and predicted data using the fuzzy systems.
FIGURE 4. Functional relationship between experimental surface temperatures (ts,observed) and temperatures predicted by fuzzy systems (ts,fuzzy) with Gaussian functions, using Mamdani inference, and different defuzzification methods: (a) centroid, (b) bisector, (c) mom, (d) lom, (e) som; and Sugeno inference with (f) wtaver and (g) wtsum defuzzification.
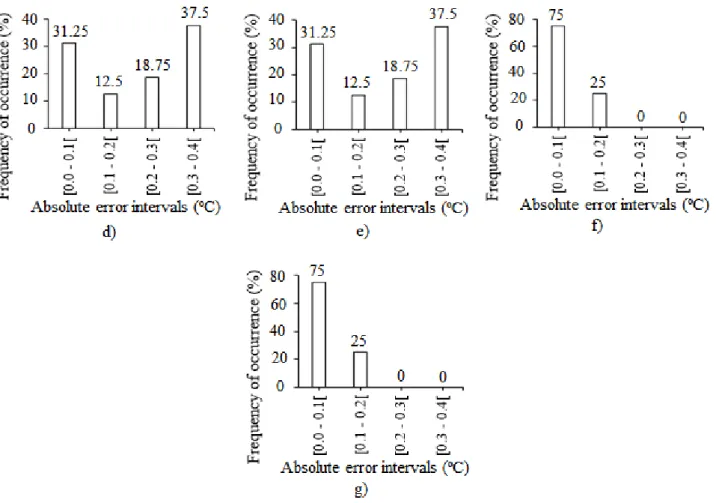
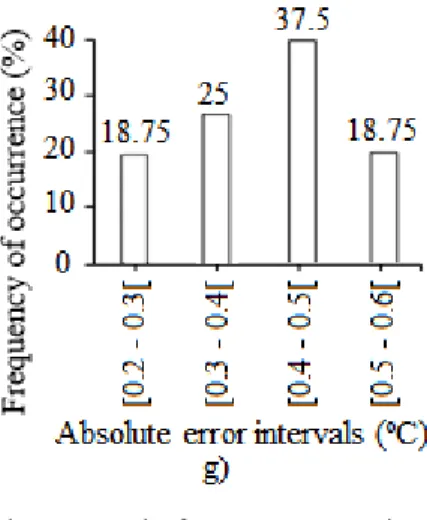
The distributions of absolute errors indicate that the ts values simulated by fuzzy systems were accurate because the errors were below 0.6 °C (Figures 5 and 6). In the models that yielded the best estimates (Sugeno inference with either wtaver and wtsum defuzzification and triangular functions or wtaver defuzzification and Gaussian functions), 75% of errors occurred in the range
FIGURE 6. Frequency of occurrence of absolute errors in fuzzy systems using Gaussian functions, Mamdani inference, and different defuzzification methods: (a) centroid, (b) bisector, (c) mom, (d) lom, (e) som; and Sugeno inference with (f) wtaver and (g) wtsum defuzzification.
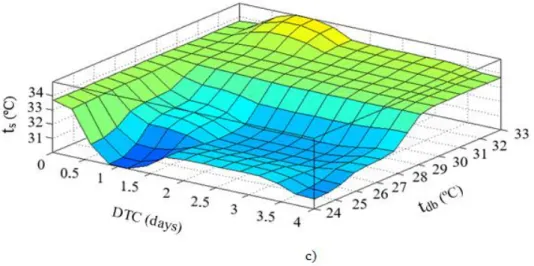
FIGURE 7. Response surfaces of the surface temperature of broiler chickens (ts) as a function of air dry-bulb temperature (tdb) and the duration of thermal challenge (DTC) in fuzzy systems using Sugeno inference with triangular pertinence functions of input variables, and (a) wtaver and (b) wtsum defuzzification; and Gaussian membership functions with (c) wtaver defuzzification.
The analysis of ts indicated that from the second day of heat treatment, the animals became adapted, retaining or dissipating heat at both low and high temperatures (< 26 ºC and > 30.5 ºC, respectively) (Figure 7). By contrast, near a tdb of 30 ºC, recommended as the comfort temperature for poultry in the second week of life (Schiassi et al., 2015), the average surface temperature remained constant, evidencing the thermal comfort of the animals and lower energy expenditure for temperature maintenance.
The fuzzy systems (triangular functions with wtaver and wtsum defuzzification and Gaussian functions with wtaver defuzzification) represented by the response surfaces (Figures 7a, b, and c) yielded the same statistical indices when compared with the experimental data (Table 1). However, Student’s t-test for equality of means (α = 5%) was applied to compare the other ts values not evaluated experimentally as a function of tdb and DTC, i.e., the temperature difference between 90 points equally spaced on each surface.
The responses were similar using different defuzzification methods (Figures 7a and b). However, there was a significant difference (p<0.05) in two response surfaces using the same defuzzification method (wtaver) (Figures 7a and c). This difference is due to the membership functions of the input variables because Gaussian functions produced smaller overlaps when compared with triangular functions, consequently reducing the degree of the pertinence of one curve over the other in the process of wtaver for conversion of the output response, therefore producing distinct points of prediction.
CONCLUSIONS
The selection of the inference and defuzzification methods and pertinence functions that compose fuzzy systems may result in different levels of prediction errors, and these errors should be evaluated for each set of input and output variables using statistical indicators.
For the analyzed data, the simulation errors were comparatively smaller in the fuzzy systems using Sugeno inference and triangular pertinence functions of input variables independent of the defuzzification method (weighted average or weighted sum) and Gaussian pertinence functions with weighted average defuzzification.
Fuzzy systems with Mamdani inference, which included triangular pertinence functions of input and output variables and bisector defuzzification, generated smaller simulation errors.
ACKNOWLEDGMENTS
This study was financed in part by the Coordenação de Aperfeiçoamento de Pessoal de Nível Superior – Brasil (CAPES) – Finance code 001, Conselho Nacional de Desenvolvimento Científico e Tecnológico (CNPq) (Processo 307746/2014-3) and Fundação de Amparo a Pesquisa do Estado de Minas Gerais (FAPEMIG).
REFERENCES
Aborisade DO, Stephen O (2014) Poultry house temperature control using Fuzzy-PID controller. IJETT 11(6):310-314.
Abreu LH, Yanagi Junior T, Fassani ÉJ, Campos AT, Lourençoni D (2015) Fuzzy modeling of broiler performance, raised from 1 to 21 days, subject to heat stress. Engenharia Agrícola 35(6): 967-978. DOI:
http://dx.doi.org/10.1590/1809-4430-Eng.Agric.v35n6p967-978/2015
Abreu PG, Abreu VM, Coldebella A, Hassemer MJ, Tomazelli IL (2012) Medidas morfológicas em função do peso e da idade da ave, por meio de imagens. Engenharia Agrícola e Ambiental 16(7):795–801.
Amendola M, Castanho MJ, Nääs IA, Souza AL (2004) Análise matemática de condições de conforto térmico para avicultura usando a teoria dos conjuntos Fuzzy.
Biomatemática Brasil 14(1):87-92.
Castilho VAR, Garcia RG, Lima NDS, Nunes KC, Caldara FR, Nääs IA, Barreto B, Jacob FG (2015) Bem-estar de galinhas poedeiras em diferentes densidades de alojamento. Revista Brasileira de Engenharia de Biossistemas 9(2):122-131. DOI:
http://dx.doi.org/10.18011/bioeng2015v9n2
Castro JDO, Veloso AV, Yanagi Junior T, Fassani EJ, Schiassi L, Campos AT (2012) Estimate of the weight of japanese quail eggs through fuzzy sets theory. Ciência e Agrotecnologia 36(1):108-116. DOI:
http://dx.doi.org/10.1590/S1413-70542012000100014 Cobb (2013) Broiler management guide. Cobb-Vantress, 73p. Cony AV, Zocche AT (2004) Manejo de frangos de corte. In: Mendes A, Nääs I de A, Macari M (ed). Produção de frangos de corte. Fundação APINCO de Ciência e Tecnologia Avícolas, p118- 136.
Costa JHS, Saraiva EP, Santos LD (2012) Efeito do ambiente sobre indicadores fisiológicos na produção de frangos de corte. Revista Verde de Agroecologia e Desenvolvimento Sustentável 7(4):54-58.
Dahlke F, Gonzales E, Furlan RL, Gadelha A, Maiorka A, Rosa PS (2005) Efeito da temperatura ambiente sobre hormônios tireoideanos, temperatura corporal e
empenamento de frangos de corte, fêmeas, de diferentes genótipos. Acta Scientiarum. Animal Sciences 27(3):391-397. DOI:
https://doi.org/10.1590/S0100-69162012000300004
Ferraz PFP, Yanagi Junior T, Yamid FHJ, Castro JDO, Gates RS, Reis GM, Campos AT (2014) Predicting chick body mass by artificial intelligence-based models. Pesquisa Agropecuária Brasileira 49(7):559-568. DOI: http://dx.doi.org/10.1590/S0100-204X2014000700009 Ferreira DF (2010) Programa de análises estatísticas (Statistical Analysis Software) e planejamento de
Experimentos-SISVAR 5.3. Lavras, Universidade Federal de Lavras.
Ferreira L, Yanagi Junior T, Lacerda WS, Rabelo GF (2012) A fuzzy system for cloacal temperature prediction of broiler chickens. Ciência Rural 42(1):166-171.
Kisi O (2013) Applicability of Mamdani and Sugeno fuzzy genetic approaches for modeling reference
evapotranspiration. Journal of hydrology 504:160-170. DOI: https://doi.org/10.1016/j.jhydrol.2013.09.043 Mamdani EH (1974) Application of fuzzy algorithms for control of simple dynamic plant. In Proceedings of the Institution of Electrical Engineers 121(12):1585-1588. Mayes SL, Strawford ML, Noble SD, Classen HL, Crowe TG (2014) Cloacal and surface temperatures of tom turkeys exposed to different rearing temperature regimes during the first 12 weeks of growth. Poultry Science Association 94(6):1105-1114. DOI:
http://dx.doi.org/10.3382/ps/peu058
Medeiros CM, Baêta FDC, Oliveira RD, Tinôco IDFF, Albino LFT, Cecon PR (2005) Efeitos da temperatura, umidade relativa e velocidade do ar em frangos de corte. Engenharia na Agricultura 13(4):277-286.
Mirzaee-Ghaleh E, Omid M, Keyhani A, Dalvand MJ (2015) Comparison of fuzzy and on/off controllers for winter season indoor climate management in a model poultry house. Computers and Electronics in Agriculture 110:187-195. DOI:
https://doi.org/10.1016/j.compag.2014.11.017
Nääs IA, Garcia RG, Caldara FR (2014) Infrared thermal image for assessing animal health and welfare. Journal of Animal Behavior and Biometeorology 2(3):66-72. DOI: http://dx.doi.org/10.14269/2318-1265/jabb.v2n3p66-72 Nascimento GR, Nääs IA, Baracho MS, Pereira DF, Neves DP (2014) Termografia infravermelho na estimativa de conforto térmico de frangos de corte. Revista Brasileira de Engenharia Agrícola e Ambiental 18(6):658-663.
Nascimento GR, Pereira DF, Nääs IA, Rodrigues LHA (2011) Índice fuzzy de conforto térmico para frangos de corte. Engenharia Agrícola 31(2):219-229.
Oliveira RFM, Donzelle JL, Abreu MLT, Ferreira RA, Vaz RGMV, Cella PS (2006) Efeitos da temperatura e da umidade relativa sobre o desempenho e o rendimento de cortes nobres de frangos de corte de 1 a 49 dias de idade. Revista Brasileira de Zootecnia 35(3):797-803.
Oliveira HLD, Amendola M, Nääs IDA (2005) Estimativa das condições de conforto térmico para avicultura de postura usando a teoria dos conjuntos fuzzy. Engenharia Agrícola 25(2):300-307.
Ponciano PF, Yanagi Junior T, Schiassi L, Campos AT, Nascimento JW (2012) Sistema fuzzy para predição do desempenho produtivo de frangos de corte de 1 a 21 dias de idade Fuzzy system to predict productive performance of broiler chicks from 1 to 21 days old. Engenharia Agrícola 32(3):446-458.
Raj R, Mohan BM (2016) Modelling and analysis of the simplest fuzzy PI/PD controllers of Takagi-Sugeno type. IFAC-PapersOnLine 49(1):537-542. DOI:
https://doi.org/10.1016/j.ifacol.2016.03.110
Salgado CM, Vieira SM, Mendonça LF, Finkelstein S, Sousa JM (2016) Ensemble fuzzy models in personalized medicine: Application to vasopressors administration. Engineering Applications of Artificial Intelligence 49:141-148. DOI: https://doi.org/10.1016/j.engappai.2015.10.004 Sargolzaei J, Khoshnoodi M, Saghatoleslami N, Mousavi M (2008) Fuzzy inference system to modeling of crossflow milk ultrafiltration. Applied Soft Computing 8(1):456-465. DOI:
https://doi.org/10.1016/j.asoc.2007.02.007
Schiassi L, Yanagi Junior T, Damasceno FA, Saraz JAO, Amaral AG (2014) Thermal-Acoustic Comfort Index for Workers of Poultry Houses Using Fuzzy Modeling. IJERA 4(9):60-64.
Schiassi L, Yanagi Junior T, Reis GM, Abreu LHP, Campos AT, Castro JO (2015) Modelagem Fuzzy aplicada na avaliação do desempenho de frangos de corte. Revista Brasileira de Engenharia Agrícola e Ambiental 19(2):140-146. DOI:
Schiassi L, Yanagi Junior T, Ferreira L, Damasceno FA, Yanagi SNM (2008) Metodologia fuzzy aplicada à avaliação do aumento da temperatura corporal em frangos de corte. Engenharia na Agricultura 16:181-191.
Sousa FC, Tinôco IFF, Paula MO, Silva AL, Souza CF, Batista FJF, Barbari M (2016) Medidas para minimizar a emissão de amônia na podução de frangos de corte: revisão. Brazilian Journal of Biosystems Engineering 10(1):51-61.
Souza Junior JBF, Arruda AMV, Domingos HGT, Costa LLM (2013a) RETRACTED ARTICLE: Regional differences in the surface temperature of Naked Neck laying hens in a semi-arid environment. International journal of biometeorology 57(3):377-380. DOI: http://dx.doi.org/10.1007/s00484-014-0884-7
Souza Junior JBF, Domingos HGT, Torquato JL, Sá Filho GF, Costa LLM (2013b) Avaliação termográfica de codornas japonesas (Coturnix coturnix japonica). Journal of Animal Behavior and Biometeorology 1(2):61-64. DOI: http://dx.doi.org/10.14269/2318-1265.v01n02a05
Takagi T, Sugeno M (1985) Fuzzy identification of systems and its applications to modeling and control. IEEE
Transactions on Systems, Man, and Cybernetics 1:116-132.