Received March 16, 2011 and accepted September 21, 2011. Correspondig author: [email protected]
Chemical composition and fermentative losses of sugar cane ensilage with
different Brix degrees, with or without calcium oxide
1Felipe Antunes Magalhães2,Sebastião de Campos Valadares Filho3, Gustavo Chamon de Castro Menezes2, Marcelo Grossi Machado4, Diego Zanetti5, Douglas dos Santos Pina6,
Odilon Gomes Pereira3, Mário Fonseca Paulino3
1Partially funded by Fapemig/INCT de Ciência Animal. 2Programa de Mestrado em Zootecnia – UFV.
3Departamento de Zootecnia – UFV. Membro do INCT Ciência Animal. 4Curso de graduação em Zootecnia – UFV. Bolsista de IC da Fapemig.
5Curso de graduação em Zootecnia – UFV. Bolsista de IC do INCT Ciência Animal. 6Instituto de Ciências Agrárias e Ambientais – UFMT.
ABSTRACT - The objective of this study was to evaluate the effect of sugar cane ensilage with different Brix degrees, with or without the addition of 0.5% of calcium oxide (lime) on the chemical composition and fermentation losses of silages. A complete random design in a 9 × 2 factorial arrangement was used. Experimental silos were used, ensilage was done every 15 days with Brix measuring, and they were opened after 30 days of fermentation. As the Brix degree of the ensiled material increased, the contents of dry matter (DM) increased and contents of ash, crude protein (CP) and fibers (neutral and acid detergent fiber corrected for proteins – NDFap and ADFap) reduced. After fermentation, DM content of the silage presented a linear increase with the Brix degree content concentration, positively correlating with content of lime, but the contents of ash, CP, EE and NDFap were linearly reduced with the Brix increase. Content of ADFap suffered linear reduction for the treated silage whereas quadratic behavior was found in the untreated silage. Production of ethanol was presented in a quadratic manner for the silages without lime, and cubically in silages with lime, according to the Brix degree. The treated or untreated silages presented an average pH of 3.98 and 3.50, respectively. Contents of acetic acid and butyric acid were not affected by the lime content and Brix degree. Untreated silages presented reduction of contents of propionic acid as the Brix degree increased. The higher the Brix degree value, the higher the total losses of dry matter in the sugar cane silages with or without treatment. The treatment of the sugar cane with 0.5% calcium oxide on the natural matter basis is effective in reducing the undesired fermentation of the ensilage material.
Key Words: Brix, calcium oxide, ethanol, sugar cane silage
www.sbz.org.br
Introduction
The great issue of ensiled sugar cane is the alcoholic fermentation caused mainly by yeast which uses the soluble carbohydrates as energy source, with ethanol as the main byproduct, thus contributing to the loss of dry matter. Indeed, the non-use of additives in cane sugar silage results in increased losses of dry matter, reduction of the nutritional value of the feed and reduction of the voluntary intake and animal performance, as quoted by several authors in the literature (Pedroso et al., 2005).
Currently, studies on the use of basic additives represent most of the studies on sugar cane silage, in which lime stands out for its lower cost and greater safety in handling. Lime may contribute to the preservation of soluble nutrients by inhibiting the growth of yeasts which act on the ensiled forage, reducing the loss of nutritive value during ensiling
and after silo opening, with the level of 0.5% of lime in green matter as the best indicated.
Considering that the high content of soluble carbohydrates in the cane sugar is responsible for alcoholic fermentation when ensiled (Van Soest, 1994), the use of sugar cane with low sucrose content, low Brix, can be an interesting alternative to reduce fermentation losses for silage, as well as to provide new shoots of the plant before the beginning of the dry season, enabling two cuts in one year. Thus, this experiment was conducted to evaluate the effect of the presence or lack of 0.5% lime on the fermentative profile of silages of sugar cane ensiled with different Brix degrees.
Material and Methods
Silage and cuts were made every 15 days, remaining ferment for 30 days.
Brix was determined by the juice extracted by grinding the sugar cane. Samples randomly taken from 10 whole plants were divided into three parts: the distal section, medial and apical sections. Each part was ground separately, determining Brix by using a field refractometer (ATAGO N-1a model), and later, a general average of the parts of the plant was calculated, in which the value of Brix of the plant was used. The sugar cane was crushed together with the straw in knife stationary equipment, set to 1-cm particles average size cut. After grinding, half of the forage was immediately treated with 0.5% calcium oxide (lime) on a natural matter basis, with broadcast pulverization and homogenized manually, and the other half received no treatment of the forage. Representative samples were collected for further analysis right after. After treatment, the forage was immediately ensiled in 20-L plastic buckets. Each bucket had a lid fitted with Bunsen type valve and approximately 2 kg of dry sand on the bottom inside a cotton bag. Bucket + lid + dry sand + bag was measured before ensiling, and the weight of the buckets filled and lidded was also measured for the quantitative determination of gas losses, total DM losses and losses by effluents, based on gravity differences. The forage was compressed by using the feet so that the density reached approximately 550 kg of fresh matter (FM)/m3 (± 11 kg of forage/bucket), in order to ensure similar conditions of porosity to the silages. After filling, the experimental silos were closed with the lids, sealed with adhesive tape and kept in a protected environment. After 30 days of storage, silos were opened and submitted to the predicted evaluations.
Initially, individual weighing of buckets was carried out. The determination of effluent production was done by the difference of weighing of bucket + sand before and after the ensiling, in relation to the amount of fresh matter ensiled. The determination of dry matter loss due to gas production was calculated by the difference between the gross weight of ensiled DM, subtracting the weights of silo + dry sand. The total loss of dry matter was estimated by the difference between the gross weight of ensiled DM minus the weight of silo + dry sand in the ensilage and silo + wet sand at the opening.
Homogeneous and representative samples of sugar cane with and without lime were collected at the time of ensiling, taken from each plot. Right after silo opening, the initial layer of silage, of approximately 10 cm, was discarded and the remainder was homogenized, and two samples were taken from each silo. Samples were placed in paper bags and oven-dried (55 °C, 72 hours). Subsequently, they were
ground in a “Willey” type grinder to 1 mm and packed in jars with lids for further analysis. Analyses of dry matter (DM), total nitrogen (TN), ether extract (EE) and ash were performed by following procedures described by Silva & Queiroz (2002). Neutral detergent fiber (NDF) and acid detergent fiber (ADF) were determined by the autoclave technique according to Rennó et al. (2002); the levels of crude protein and ash of NDF and ADF were quantified as described by Silva & Queiroz (2002) for determination of NDF and ADF corrected for ash and protein (NDFap and ADFap).
A fresh sample of sugar cane silage was collected for juice extraction and determination of the concentration of ammonia nitrogen (N-NH3), as described by Bolsen et al. (1992). The content of ethanol, acetic acid, propionic acid, butyric and lactic acid were determined according to the method described by Kung Jr. (1996). Briefly, 25 g of wet sample of the silages were processed in 225 mL of Ringer solution (Oxoid) by using a blender for 1 minute. After that, the material was filtered in a Whatman 54® filter paper, acidified with sulfuric acid at 50% and centrifuged (5,000 g) for 15 minutes, and the resulting liquid extract was stored in a freezer (-5 °C) until analysis. The pH was determined in the extracts, before filtering through a digital pH meter.
The contents of ethanol, acetic acid, propionic and butyric acid were determined by gas chromatograph model CG - 17A Shimadzu, equipped with a FID detector. For ethanol, a PAG capillary column (30 m × 0.25 mm) was used, and Nukol capillary column (30 m × 0.25 mm) was used for acetic acid, propionic acid and butyric acid. Values of lactic acid were determined by high performance liquid chromatography (HPLC) (Shimadzu, model SPD-10A VP) coupled to a ultra-violet detector, using 210-nm wavelength. SCR-101 H column, with 30 cm × 7.9 mm of diameter with a 0.8 mL/minute to 24-kgf flow in the column was used.
For determination of silage ammonia nitrogen, 5 g of wet silage was used and left to sit with 250 mL of distilled water for 30 minutes, shortly after addition of 2 g of magnesium oxide, distilled and titrated (Silva & Queiroz, 2002).
PROC REG of SAS (SAS, version 8). The treatment means were compared with a significance level of 5%.
Results and Discussion
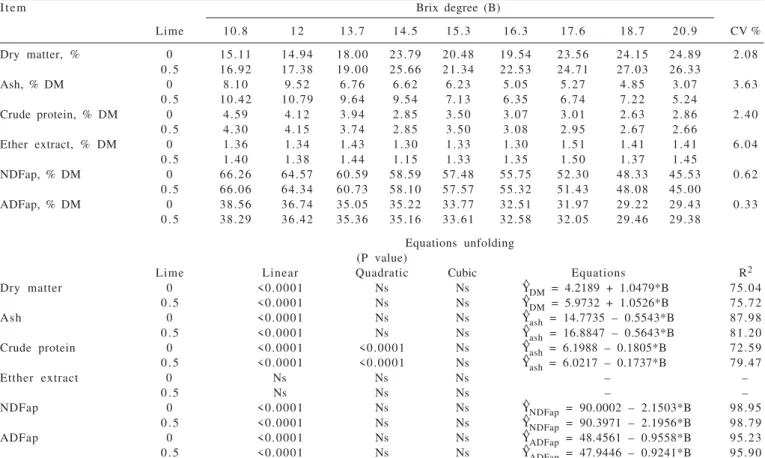
Except for the content of EE, an interaction (P<0.05) between levels of lime and Brix levels for the other variables was found. By assessing the content of DM in the ensiled material, as sugar cane matures, i.e., its content of Brix increases, there is a linear increase (P<0.05) in the percentage of its DM (Table 1). This can be explained by the increase in the content of the cell wall in relation to cell content, as well as the greater accumulation of soluble carbohydrates, in which sucrose is the major constituent.
By comparing the sugar cane treated or not treated with 0.5% lime, the former showed higher DM content than the later, which is a consequence of the dry matter content of lime being close to 100%.
As sugar cane matured, percentages of ash, NDFap and ADFap reduced (P<0.05) as a result of the accumulation of sugars, leading to a dilution effect in the final material. The mean values of the NDFap and ADFap in sugar cane at the time of ensiling were 56.45 and 33.60% DM, respectively
(Table 1). These values were close to those found by Santos et al. (2008) for NDF and ADF of 51.20 and 30.87% of the DM. Higher levels of ash were found in sugar cane treated with lime as compared with that which received no treatment. This increase is reported in the literature by several authors, such as Simkins et al. (1965) and Alcântara et al. (1989).
The increase in Brix linearly decreasingly influenced (P<0.05) the contents of CP of the material to be ensiled, showing that as the material gets mature, there is a reduction of CP content due to the increase of cell wall constituents and total sugars (Table 1). Kung Jr. & Stanley (1982), studying the effect of stage of maturity on the nutritive value of whole sugar cane plant, found lower CP content in sugar cane at 24 months of age compared with those at younger ages.
Interaction (P<0.05) between levels of lime and Brix levels was found for all variables analyzed (Table 2). The DM content of silages increased linearly with the concentration of Brix, and this increase was positively correlated with the content of lime. For higher Brix levels, greater contents of DM for silages treated with lime were found.
Contents of ash, CP, EE and NDFap presented linear decrease (P<0.05) with the increase of Brix, which was
Item Brix degree (B)
Lime 10.8 1 2 13.7 14.5 15.3 16.3 17.6 18.7 20.9 CV %
Dry matter, % 0 15.11 14.94 18.00 23.79 20.48 19.54 23.56 24.15 24.89 2.08 0 . 5 16.92 17.38 19.00 25.66 21.34 22.53 24.71 27.03 26.33
Ash, % DM 0 8.10 9.52 6.76 6.62 6.23 5.05 5.27 4.85 3.07 3.63
0 . 5 10.42 10.79 9.64 9.54 7.13 6.35 6.74 7.22 5.24
Crude protein, % DM 0 4.59 4.12 3.94 2.85 3.50 3.07 3.01 2.63 2.86 2.40 0 . 5 4.30 4.15 3.74 2.85 3.50 3.08 2.95 2.67 2.66
Ether extract, % DM 0 1.36 1.34 1.43 1.30 1.33 1.30 1.51 1.41 1.41 6.04 0 . 5 1.40 1.38 1.44 1.15 1.33 1.35 1.50 1.37 1.45
NDFap, % DM 0 66.26 64.57 60.59 58.59 57.48 55.75 52.30 48.33 45.53 0.62 0 . 5 66.06 64.34 60.73 58.10 57.57 55.32 51.43 48.08 45.00
ADFap, % DM 0 38.56 36.74 35.05 35.22 33.77 32.51 31.97 29.22 29.43 0.33 0 . 5 38.29 36.42 35.36 35.16 33.61 32.58 32.05 29.46 29.38
Equations unfolding (P value)
Lime Linear Quadratic Cubic Equations R2
Dry matter 0 <0.0001 Ns Ns Y^DM = 4.2189 + 1.0479*B 75.04
0 . 5 <0.0001 Ns Ns Y^DM = 5.9732 + 1.0526*B 75.72
Ash 0 <0.0001 Ns Ns Y^ash = 14.7735 – 0.5543*B 87.98
0 . 5 <0.0001 Ns Ns Y^ash = 16.8847 – 0.5643*B 81.20 Crude protein 0 <0.0001 <0.0001 Ns Y^ash = 6.1988 – 0.1805*B 72.59 0 . 5 <0.0001 <0.0001 Ns Y^ash = 6.0217 – 0.1737*B 79.47
Etther extract 0 Ns Ns Ns – –
0 . 5 Ns Ns Ns – –
NDFap 0 <0.0001 Ns Ns Y^NDFap = 90.0002 – 2.1503*B 98.95
0 . 5 <0.0001 Ns Ns Y^NDFap = 90.3971 – 2.1956*B 98.79
ADFap 0 <0.0001 Ns Ns Y^ADFap = 48.4561 – 0.9558*B 95.23
0 . 5 <0.0001 Ns Ns Y^ADFap = 47.9446 – 0.9241*B 95.90
NDFap - neutral detergent fiber corrected for ash and protein; ADFap - acid detergent fiber corrected for ash and protein; CV - coefficient of variation; R2 - coefficient of
determination of linear, quadratic or cubic equations; Ns - non-significant.
influenced by the level of lime as follows: the treated silage showed higher levels of ash and EE, and the levels of NDFap and CP were lower in silages treated with lime (Table 2).
Contents of ash, CP, EE and NDFap linearly reduced (P<0.05) as Brix increased, which was influenced by the level of lime as follows: the treated silages showed higher levels of EE and ash inasmuch as the levels of NDFap and CP were lower in silages treated with lime (Table 2).
Values of EE showed little variation, but a linear decrease (P<0.05) of their contents was found when Brix was increased. The content of ADFap was linearly reduced for treated silage whereas a quadratic behavior was found for non-treated silage, with a minimum value of 42.46% DM estimated for the Brix content of 14.05.
After ensilage, contents of ash showed a reduction with the raise in the Brix, and this reduction was of 0.56 and 0.58 for each degree of Brix in the silages treated with and without lime, respectively.
Santos et al. (2009) found an increase in the content of ash in silages of sugar cane treated with 1% lime, obtaining an average value of 6.1%. As previously mentioned, the use of lime resulted in higher percentages of ash, as compared with non-treated silages.
A reduction (P<0.05) in the content of CP for silages treated or not treated with lime was found with the increase in Brix.
It can be observed that the values of NDFap reduced as Brix increased, and there was an increase in the percentage of fibrous fraction in the DM after the fermentation process. This is a consequence of the loss of soluble constituents by the production of effluents (Van Soest, 1994), and especially by the conversion of sugars into ethanol, resulting in an increase in the percentage of the fibrous fraction.
Silages of treated sugar cane presented a lower raise in the contents of NDFap and ADFap than those without lime, showing that the additive was effective in reducing losses during the fermentation process. Contents of NDFap and ADFap presented an average increase of 17.1 and 29.0% DM for non-treated silages and 10.4 and 15.6% of DM for silages with lime, respectively. These values are above those reported by Santos et al. (2008), who found an increase in the contents of NDF and ADF by 14 and 11% of DM for silages of sugar cane without treatment, and 1.7 and 4.5% of DM for the silage treated with 1 or 1.5% calcium oxide or calcium carbonate, respectively.
When silages of sugar cane that had not received lime were evaluated, ethanol production behaved quadratically
Item Brix degree (B)
Lime 10.8 1 2 13.7 14.5 15.3 16.3 17.6 18.7 20.9 CV %
Dry matter, % 0 17.52 17.15 16.79 26.27 16.81 17.51 20.98 23.06 23.47 2.93 0 . 5 18.39 18.88 19.55 28.18 19.62 22.19 22.78 25.91 25.54
Ash, % DM 0 8.70 10.26 7.49 7.42 6.80 5.47 5.81 5.74 3.62 3.25
0 . 5 10.97 11.31 10.44 10.14 7.54 6.57 7.15 7.85 5.57
Crude protein, % DM 0 4.24 3.55 3.71 4.06 3.22 3.32 3.42 3.52 3.23 5.15 0 . 5 4.00 2.90 3.36 3.48 3.38 3.26 3.05 3.12 2.77
Ether extract, % DM 0 1.32 1.41 1.39 1.38 1.34 1.28 1.34 1.28 1.29 4.87 0 . 5 1.49 1.46 1.40 1.39 1.38 1.37 1.29 1.38 1.21
NDFcp, % DM 0 70.66 68.64 67.74 66.43 66.83 66.59 63.55 61.20 60.10 0.61 0 . 5 67.81 66.19 63.87 62.41 61.49 60.94 57.45 58.76 56.19
ADFcp, % DM 0 43.40 42.24 42.48 41.43 42.41 43.25 43.46 43.58 44.54 0.48 0 . 5 40.06 39.12 39.33 39.00 38.27 38.24 38.31 38.27 36.80
Interactions unfolding (P value)
Lime Linear Quadratic Cubic Equations R2
Dry matter 0 0.0038 Ns Ns Y^DM = 10.5282 + 0.6067*B 28.95
0 . 5 0.0002 Ns Ns Y^DM = 11.1357 + 0.7211*B 42.50
Ash 0 <0.0001 Ns Ns Y^CZ = 15.5210 – 0.5606*B 85.63
0 . 5 <0.0001 Ns Ns Y^CZ = 17.7170 – 0.5860*B 78.32
Crude protein 0 0.0009 Ns Ns Y^CP = 4.7532 – 0.0751*B 36.14
0 . 5 0.0004 Ns Ns Y^CP = 4.4092 – 0.0742*B 39.79
Ether extract 0 0.0339 Ns Ns Y^EE = 1.4839 – 0.0096*B 16.78
0 . 5 <0.0001 Ns Ns Y^EE = 1.7398 – 0.0236*B 56.73
NDFap 0 <0.0001 Ns Ns Y^NDFap = 81.9705 – 1.0443*B 93.11
0 . 5 <0.0001 Ns Ns Y^NDFap = 79.9491 – 1.1762*B 94.75 ADFap 0 0.0007 <0.0001 <0.0001 Y^ADFap = 52.6282 – 1.4583*B + 0.0519*B2 69.38
0 . 5 <0.0001 Ns <0.0001 Y^ADFap = 42.7163 – 0.2650*B 83.39
NDFap - neutral detergent fiber corrected for ash and protein; ADFap - acid detergent fiber corrected for ash and protein; CV - coefficient of variation; R2 - coefficient of
determination of linear, quadratic or cubic equations and Ns - non-significant.
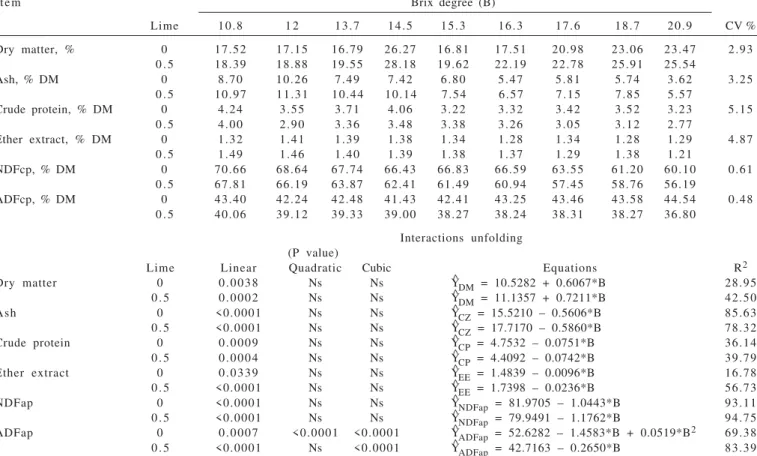
(P<0.05) in function of Brix (Table 3), estimating maximum value of ethanol (5.10) in silages with 18.22 °Bx. But, in silages with lime, ethanol production presented cubic effect (P<0.05), estimating minimum value of ethanol of 0.62 with 17.28 °Bx whereas maximum value of 0.78 was estimated with 13.39 °Bx.
The content of ethanol indicated numerical difference between silages without lime in comparison to those treated with alkalinizing additive, whose mean values were 3.92 and 0.69% DM, respectively. These values are close to those obtained by Santos et al. (2008), who evaluated silages of sugar cane and obtained ethanol contents of 4.78 and 0.38% in DM for the control silages and silages treated with 1% lime, respectively.
The smaller production of ethanol in treated silages indicates that the additive controlled the intense activity of the yeast, which may have been inhibited by the weak acid produced during fermentation. According to McDonald et al. (1991), ethanol production represents losses of about 49% DM of the substrates, and this loss is mainly composed of soluble carbohydrates. The results found for silages with no treatment confirm this information because a significant increase in ethanol content (P<0.05) was found in these silages, which resulted in silages with greater fibrous constituents. Therefore, the use of 0.5% lime was effective in reducing the alcoholic fermentation.
Contents of N-NH3 for sugar cane silages treated with lime showed a significant linear increase (P<0.05) as Brix was raised whereas there was no effect (P>0.05) of Brix in the control silage. Mean contents of N-NH3 for silage with or without lime were 9.90 and 9.66% of total nitrogen, respectively. These values can be considered satisfactory inasmuch as they were below 12%, considered by McDonald
et al. (1991) the limit below which good-quality silages are classified.
According to Rodrigues et al. (2005), low levels of ammonia nitrogen are the result of low proteolysis from the small activity of enzymes of the plant inasmuch as part of the plant enzymes that disintegrates the forage protein inside the silo is activated only at pH above 5.0.
Moreover, this fact is confirmed not only by the low pH of this study (mean of 3.74), but also by the low protein content in ensiled sugar cane, resulting in low rate of proteolysis.
The pH of non-treated silages showed quadratic behavior in function of the Brix, with an estimated maximum value of 3.55 at 14.52 °Bx (Table 3). The pH of silage treated with lime was not affected (P>0.05) by Brix. The pH of non-aditivated silages reached values similar to those found in the literature, close to 3.5 (Kung Jr. & Stanley, 1982; Pedroso et al., 2005). The greatest numerical values of pH obtained for the silages treated with lime (average of 3.98) are consistent with those observed in the literature. Balieiro Neto et al. (2005), working with different doses of lime in sugar cane silage, observed significant raise of values of final pH (4.44 for silages with 1.0% lime and 3.66 for the control silage). Cavali et al. (2006), by adding 1.0 and 1.5% lime to silage of sugar cane, found values of 4.3 and 4.8, respectively. According to Santos et al. (2008), the highest values of pH in the silage treated with alkalinizing additives are caused by its buffering power inasmuch as the dissociation of atoms present in the chemical additives generates anionic charges able to neutralize hydrogen ions from the organic acids produced during fermentation.
According to McDonald et al. (1991), enterobacteria predominate in the initial phase of fermentation of the
Item Brix degree (B)
Lime 10.8 1 2 13.7 14.5 15.3 16.3 17.6 18.7 20.9 CV %
Etanol, % DM 0 1.06 1.56 4.97 2.61 6.26 5.61 3.94 3.90 5.37 8.04 0 . 5 0.53 0.56 0.46 0.91 0.75 0.80 0.49 0.43 1.24
N-NH3, % N Total 0 9.23 9.61 10.67 8.65 10.78 11.14 10.30 8.56 10.15 5.55 0 . 5 8.33 9.17 10.04 8.75 10.56 10.18 10.03 8.34 11.52
pH 0 3.53 3.43 3.47 3.70 3.53 3.57 3.50 3.47 3.27 1.46
0 . 5 3.93 3.90 3.93 4.17 3.97 3.97 3.90 4.07 4.00
Interactions unfolding (P value)
Lime Linear Quadratic Cubic Equations R2
Etanol 0 Ns <0.0001 Ns Y^ETA = –19.3563 + 2.6852*B – 0.0737*B2 57.21
0 . 5 Ns Ns 0.0002 Y^ETA = –18.4054 + 3.8465*B – 0.2539*B2 + 0.0055*B3 56.97
N-NH3 0 Ns Ns Ns – –
0 . 5 0.0106 Ns 0.0035 Y^N-NH3 = 6.8455 + 0.1812*B 23.37 pH 0 0.0244 <0.0001 Ns Y^pH = 2.0200 + 0.2120*B – 0.0073*B2 54,31
0 . 5 Ns Ns Ns – –
N-NH3 - ammonia nitrogen; DM - dry matter; CV - coefficient of variation; R2 - coefficient of determination of linear, quadratic and cubic equations; Ns - non-significant.
forages and survive until the homofermentative lactic acid bacteria present ideal development conditions (low pH), initiating the conversion of sugars into lactic acid. Thus, with the drop in pH, inhibition of enterobacteria occurs, with lactic acid bacteria prevailing in the ensiled mass. Thus, it can be inferred that the increase in values of pH of the silage after the addition of lime, and direct antimicrobial effect of hydrate lime on the yeasts were the main factors that set the fermentative pattern in silages with and without lime.
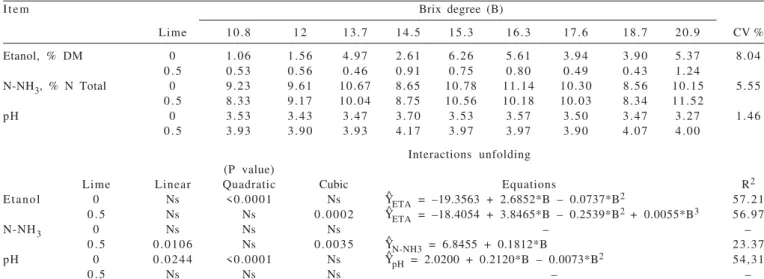
The content of lactic acid of non-treated silages showed cubic behavior in function of the Brix, estimating maximum concentration of lactic acid (8.00% of DM) at 13.17 °Bx and minimum concentration (6.92% of DM) at 17.81 °Bx (Tabela 4). For silages treated with lime, a linear reduction (P<0.05) in the concentration of lactic acid was found as Brix increased. The finding suggests a competition between the lactic acid-producing bacteria with ethanol-producing yeasts, in which the increase in the availability of fermentable carbohydrates tends to favor alcoholic fermentation.
By comparing silages with no treatment with silages added with lime, a greater numerical concentration of lactic acid in silages with additives was found. According to Alli et al. (1983), when there is high production of ethanol, a significant growth of yeasts takes place, which, in addition to increasing the DM losses, contributes to the low production of lactic acid. This statement explains the results found in this study, in which silages of sugar cane treated with lime showed the lower production of ethanol, as well fewer losses of DM and higher concentration of lactic acid.
The silage with lower pH (Table 3) showed lower concentrations of lactic acid (Table 4). The treatment of sugar cane with lime resulted in silages with high pH values and higher concentrations of lactic acid at the opening of silos, which evidences the presence of a synergism between these parameters, contradicting the tendency of classical fermentation. This can be explained by the basic characteristic of lime, of raising the pH of the material, making more lactic acid be produced so a good fermentation and inhibition of undesirable fermentations occurs. The positive correlation of lactic acid with final pH found in the study (Table 4), as well as the relative resistance of yeast to grow in acidic environments neutralize the importance of pH at ranking of sugar cane silage.
Contents of acetic acid and butyric acid were not affected (P>0.05) by levels of lime and Brix. The concentration of acetic acid showed an average of 2.20 and 2.32% DM in silages of sugar cane free of additive and in the ones with lime, respectively, and they are within the acetic acid standard (from 1 to 3%) cited as normal by Kung Jr. et al. (2000). Schmidt et al. (2007) found for silages of sugar cane treated with chemical and microbial additives mean values of 2.3% of acetic acid in DM, which are very close to the ones in this research. According to Moon (1983) and McDonald et al. (1991), acetic acid has negative influence on the metabolism of yeasts and filamentous fungi.
Therefore, its presence in silage is very important to reduce the alcoholic fermentation and for aerobic stability as well. Good quality silage has low levels of butyric acid, produced by genus Clostridium bacteria through the use
Item Brix degree (B)
Lime 10.8 1 2 13.7 14.5 15.3 16.3 17.6 18.7 20.9 CV %
Lactic acid, % DM 0 6.5330 8.0117 8.0620 8.4680 6.4647 6.7490 5.7563 8.3230 8.3047 7.29 0.5 12.3553 13.9830 10.6400 9.6960 14.5590 10.7593 6.1980 10.0870 6.8980
Acetic acid, % DM 0 1.9773 2.2750 1.6660 2.8370 1.5880 1.5887 3.0823 2.3447 2.4403 9.45 0.5 2.2650 2.2687 3.1223 2.3963 1.0987 2.8253 2.4417 2.2197 2.2027
Propionic acid, % DM 0 0.7140 0.7820 0.8780 0.7527 0.8050 0.4867 0.5710 0.5603 0.5790 8.81 0.5 0.5020 0.6547 0.5620 0.6810 0.3237 0.2557 0.5230 0.4733 0.4760
Butyric acid, % DM 0 0.0177 0.0137 0.0153 0.0163 0.0087 0.0190 0.0137 0.0120 0.0197 10.81 0.5 0.0187 0.0117 0.0117 0.0187 0.0147 0.0123 0.0113 0.0163 0.0120
Interactions unfolding (P value)
Lime Linear Quadratic Cubic Equations R2
Lactic acid 0 Ns Ns 0.0488 Y^LAT = –67.8688 + 15.2847*B – 1.0089*B2 + 0.0217*B3 28.48
0 . 5 <0.0001 Ns Ns Y^LAT = 20.0739 – 0.6115*B 46.67
Acetic acid 0 Ns Ns Ns – –
0 . 5 Ns Ns Ns – –
Propionic acid 0 0.0006 Ns <0.0001 Y^PRO = 1.1079 – 0.0275*B 38.31
0 . 5 Ns Ns Ns – –
Butyric acid 0 Ns Ns Ns – –
0 . 5 Ns Ns Ns – –
DM - dry matter; CV - coefficient of variation; R2 - coefficient of determination of linear, quadratic or cubic equations; Ns - non-significant.
of amino acids and sugar (McDonald et al., 1991). The mean found for butyric acid was 0.02 and 0.01% DM in silages of sugar cane without additive and with lime, respectively. These values close to zero indicate that undesirable changes did not occur in the ensiled mass. Schmidt et al. (2007) found butyric acid mean concentration of 0.05% DM when assessing silages of sugar cane treated with additives.
Silages of sugar cane with no treatment had a decreasing linear effect (P<0.05) for contents of propionic acid as Brix increased. This shows that the higher the levels of sugars, the lower the production of propionic acid in silages without additives. Silva et al. (2008) also found reduction in the content of propionic acid with the increase in soluble carbohydrates. There was no difference (P>0.05) for the concentration of propionic acid in silages treated with lime. The mean concentrations of propionic acid in the silages with and without lime were 0.68 and 0.49% DM, respectively. According to Mahanna (1993), the silages can be classified as good quality inasmuch as concentrations of propionic acid are within the range from 0 to 1% of DM.
Propionate is one of the short-chain acids with the greatest antimicrobial effect because it reduces yeast growth even at small concentrations (Freese et al., 1973). Therefore, a good production of propionic acid in sugar cane silages results in lower alcoholic fermentation.
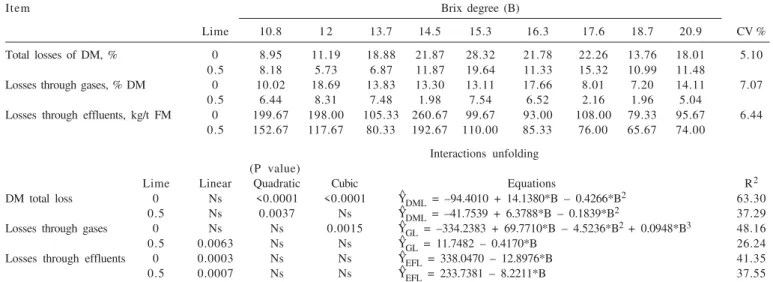
Total loss of DM showed a quadratic behavior for both silages treated with and without lime in function of Brix. For the non-treated silages, the maximum loss of DM (22.73%) was estimated at 16.57 °Bx (Table 5). But, for the treated silages, the maximum loss of DM (13.56%) was estimated at 17.34 °Bx. As the Brix value increased, the total losses of dry matter in sugar cane silage with and without treatment raised as well (P<0.05). The raise in the concentration of
soluble sugars in the silage favored a greater fermentation due to increased supply of substrate. Consequently, there was a greater production of ethanol and also a greater development of yeast, which have optimum pH for growth of approximately 3.5 and contribute significantly to the increase in DM losses, according to Ranjit & Kung Jr. (2000). Losses through gases presented a cubic behavior for non-treated silages, in which a minimum value of 11.54% for the DM and 18.67 °Bx and a maximum of 16.58% of DM at 13.14 °Bx were estimated. There was a linear decrease (P<0.05) in the losses through gases with an increase in the Brix degree in the silage treated with lime. When silages of sugar cane with and without treatment were compared, losses through gases numerically smaller were found in the material added with lime.
Silages without lime presented average loss through gases of 12.9% of DM, but for the treated silage, this loss was 5.3% of DM. Balieiro Neto et al. (2005) evaluated the effect of doses of lime during sugar cane ensiling and found gaseous losses of 9.7% in the silage treated with 1% of this additive.
Silages of sugar cane with and without treatment presented a linear decreasing reduction (P<0.05) of losses through effluents as Brix rose. The high production of effluents in low Brix silages is because of the reduced content of DM of the material at the time of ensiling. Means of effluent production for silages of sugar cane without and with lime were 137.7 and 106.0 kg/t of fresh matter, respectively. These values were greater than those found in the literature, which ranged around 43.8 kg/t of fresh matter as found by Sousa et al. (2008). This large difference is mainly because in this research, low DM sugar cane was used, in which Brix degree was the reference at the time of ensiling.
DM - dry matter; FM - fresh matter; CV - coefficient of variation; R2 - coefficient of determination of linear, quadratic or cubic equations; Ns - non significant.
Item Brix degree (B)
Lime 10.8 1 2 13.7 14.5 15.3 16.3 17.6 18.7 20.9 CV %
Total losses of DM, % 0 8.95 11.19 18.88 21.87 28.32 21.78 22.26 13.76 18.01 5.10 0.5 8.18 5.73 6.87 11.87 19.64 11.33 15.32 10.99 11.48
Losses through gases, % DM 0 10.02 18.69 13.83 13.30 13.11 17.66 8.01 7.20 14.11 7.07 0.5 6.44 8.31 7.48 1.98 7.54 6.52 2.16 1.96 5.04
Losses through effluents, kg/t FM 0 199.67 198.00 105.33 260.67 99.67 93.00 108.00 79.33 95.67 6.44 0.5 152.67 117.67 80.33 192.67 110.00 85.33 76.00 65.67 74.00
Interactions unfolding (P value)
Lime Linear Quadratic Cubic Equations R2
DM total loss 0 Ns <0.0001 <0.0001 Y^DML = –94.4010 + 14.1380*B – 0.4266*B2 63.30
0.5 Ns 0.0037 Ns Y^DML = –41.7539 + 6.3788*B – 0.1839*B2 37.29
Losses through gases 0 Ns Ns 0.0015 Y^GL = –334.2383 + 69.7710*B – 4.5236*B2 + 0.0948*B3 48.16
0.5 0.0063 Ns Ns Y^GL = 11.7482 – 0.4170*B 26.24
Therefore, treatment of sugar cane with 0.5% lime on the natural matter basis, was effective in inhibiting yeast growth because silages treated with this product showed a decrease in alcoholic fermentation (Table 3), fewer total losses of DM, less gas and effluent production (Table 5), even with relatively high pH values (Table 3).
Conclusions
With the maturation of sugar cane, the values of soluble carbohydrates increase and the contents of dry matter, crude protein and fiber reduce proportionately. The use of 0.5% lime during ensiling of sugar cane results in reduction of fermentative losses.
References
ALCÂNTARA, E.; AGUILERA, A.; ELLIOT, R. Fermentation and utilization by lambs of sugarcane fresh and ensiled with and without NaOH. Animal Feed Science and Technology, v.23, p.323-331, 1989.
ALLI, I.; FAIRBAIRN, R.; BAKER, B.E. et al. The effects of ammonia on the fermentation of chopped sugarcane. Animal Feed Science and Technology, v.9, p.291-299, 1983. BALIEIRO NETO, G.; SIQUEIRA, G.R.; NOGUEIRA, J.R. et al.
Perdas na ensilagem da cana-de-açúcar cv. IAC86/2480 (Saccharum officinarum L.) com doses de óxido de cálcio. In: REUNIÃO ANUAL DA SOCIEDADE BRASILEIRA DE ZOOTECNIA, 42., 2005, Goiânia. Anais... Goiânia: Sociedade Brasileira de Zootecnia, 2005. (CD-ROM).
BOLSEN, K.K.; LIN, C.; BRENT, B.E. et al. Effect of silage additives on the microbial succession and fermentation process of alfalfa and corn silages. Journal of Dairy Science, v.75, p.3066-3083, 1992.
CAVALI, J.; PEREIRA, O.G.; SOUSA, L.O. et al. Silagem de cana-de-açúcar tratada com óxido de cálcio: composição bromatológica e perdas. In: REUNIÃO ANULA DA SOCIEDADE BRASILEIRA DE ZOOTECNIA, 43., 2006, João Pessoa. Anais... João Pessoa: Sociedade Brasileira de Zootecnia, 2006. (CD-ROM).
FREESE, E.; SHEW, C.; GALLIERS, E. Function of lipophilic acids as antimicrobial food additives. Nature, v.24, p.321-325, 1973. KUNG JR., L. Preparation of silage water extracts for chemical analyses. Standard operating procedure – 001 2.03.96. Worrilow: University of Delaware, Ruminant Nutrition Laboratory, 1996. 309p.
KUNG JR., L.; ROBINSON, J.R.; RANJIT, N.K. et al. Microbial populations, fermentation en-products, and aerobic stability of corn silage treated with ammonia or a propionic acid-based preservative.
Journal of Dairy Science, v.83, n.7, p.1479-1486, 2000.
KUNG JR., L.; STANLEY, R.W. Effect of stage of maturity on the nutritive value of whole-plant sugarcane preserved as silage.
Journal of Animal Science, v.54, p.689-696, 1982. MAHANNA, B. Troubleshooting silage problems. In: STATE
APPLIED NUTRITION CONFERENCE, 4., 1993, Wisconsin.
Proceedings... Wisconsin, 1993. 1-21p.
McDONALD, P.; HENDERSON, A.R.; HERON, S.J.E. T h e biochemistry of silage. 2.ed. Marlow: Chalcomb Publication, 1991. 340p.
MOON, N.J. Inhibition of the growth of acid tolerant yeasts by acetate, lactate and propionate and their synergistic mixtures.
Journal of Applied Bacteriology, v.55, p.453-460, 1983. PEDROSO, A.F.; NUSSIO, L.G.; PAZIANI, S.F. et al. Dinâmica da
fermentação e da microflora epífita em silagem de cana-de-açúcar. Scientia Agrícola, v.62, n.5, p.427-432, 2005. RANJIT, N.K.; KUNG JR., L. The effects of Lactobacillus buchneri,
Lactobacillus plantarum, or a chemical preservative on the fermentation and aerobic stability of corn silage. Journal of Dairy Science, v.83, n.3, p.526-535, 2000.
RENNÓ, L.N.; VALADARES FILHO, S.C.; PAULINO, M.F. et al. Indicadores interno ou externo e efeito da contaminação da fibra em detergente neutro sobre a digestibilidade aparente total em novilhos. In. REUNIÃO ANUAL DA SOCIEDADE BRASILEIRA DE ZOOTECNIA, 39., 2002, Recife. Anais... Recife: Sociedade Brasileira de Zootecnia, 2002. (CD-ROM)
RODRIGUES, P.H.M.; BORGATTI, L.M.O.; GOMES, R.W. et al. Efeito da adição de níveis crescentes de polpa cítrica sobre a qualidade fermentativa e o valor nutritivo da silagem de capim-elefante.
Revista Brasileira de Zootecnia, v.34, n.4, p.1138-1145, 2005. SANTOS, M.C.; NUSSIO, L.G.; MOURÃO, G.B. et al. Influência da utilização de aditivos químicos no perfil da fermentação, no valor nutritivo e nas perdas de silagens de cana-de-açúcar. Revista Brasileira de Zootecnia, v.37, n.9, p.1555-1563, 2008. SANTOS, M.C.; NUSSIO, L.G.; MOURÃO, G.B. et al. Nutritive
value of sugarcane silage treated with chemical additives.
Scientia Agricola, v.66, n.2, p.159-163, 2009.
SCHMIDT, P.; MARI, L.J.; NUSSIO, L.G. et al. Aditivos químicos e biológicos na ensilagem de cana-de-açúcar. 1. Composição química das silagens, ingestão, digestibilidade e comportamento ingestivo.
Revista Brasileira de Zootecnia, v.36, n.5, p.1666-1675, 2007 (supl.).
SILVA, D.J.; QUEIROZ, A.C Análise de alimentos: métodos químicos e biológicos. Viçosa, MG: UFV, Imprensa Universitária, 2002. 235p. SILVA, E.J.A.; BORGATTI, L.M.O.; MEYER, P.M. et al. Efeitos do teor de carboidratos solúveis sobre as características da silagem de cana-de-açúcar. Revista Brasileira de Zootecnia, v.37, n.8, p.1375-1382, 2008.
SIMKINS, K.L.; BAUMGARDT, B.R.; NIEDERMEIER, R.P. Feeding value of calcium carbonated-treated corn silage for dairy cows.
Journal of Dairy Science, v.48, p.1315-1318, 1965. SOUSA, D.P.; MATTOS, W.R.S.; NUSSIO, L.G. et al. Efeito de aditivo
químico e inoculantes microbianos na fermentação e no controle da produção de álcool em silagens de cana-de-açúcar. Revista Brasileira de Zootecnia, v.37, n.9, p.1564-1572, 2008. Van SOEST, P.J. Nutritional ecology of the ruminant. 2.ed.