A data mining approach to fraud
detection in e-tail
A case study in an online luxury fashion retailer
Nuno Abrunhosa Carneiro
Master’s Dissertation
Supervisor: Prof. Dr. Gon¸calo Figueira
Integrated Master in Industrial Engineering and
Management
Dedicated to all the teachers who inspired me.
Abstract
Payment fraud has been a problem for merchants for a long time. More recently, e-commerce has transformed the way that most retailers do business. However, the possibility of reaching anyone in the world through the internet also makes it easier for fraudsters to hide their identity. Payment fraud leads to billions of dollars in losses for merchants. With the development of machine learning algorithms, researchers have been finding increasingly sophisticated ways to detect fraud without ever seeing a fraudster.
We propose a data mining approach to the problem of detecting fraud in e-tail businesses. Our approach is based on extracting the most information from the data available to the merchants, such as customer history, payment details, order data and customer behaviour. An exploratory analysis is done on the data from the online marketplace for luxury fashion Farfetch. Several feature engineering functions are used. Three different machine learning algorithms are applied for the classification problem: Random Forests, Logistic Regression and Support Vector Machines. A deployment solution for classification of incoming orders is proposed and implemented at the case study company.
This dissertation details the many steps needed to develop a fraud detection solution by data mining. We conclude that machine learning algorithms are essential in supporting human workers in classifying orders efficiently. The results show that the features which are used are very important for the performance of the classifier and that Random Forests is a very effective and versatile model to use.
Resumo
A fraude de pagamento ´e h´a muito tempo um problema para os comerciantes. O com´ercio electr´onico transformou a forma de como retalhistas fazem neg´ocio, trazendo a possibilidade de chegar a clientes de todo o mundo atrav´es da inter-net. No entanto, esses desenvolvimentos tornaram tamb´em mais f´acil a oculta¸c˜ao da indentidade de indiv´ıduos que cometem atividades fraudulentas. A fraude de pagamento ´e respons´avel por perdas de muitos milhares de milh˜oes de d´olares para os comerciantes. Com o desenvolvimento de algoritmos de machine learning, tˆem sido estudados m´etodos cada vez mais sofisticados de detetar fraude.
Propomos uma abordagem de data mining para o problema de dete¸c˜ao de fraude no contexto de retalho online. A nossa abordagem ´e baseada em extrair a m´axima informa¸c˜ao a partir dos dados que est˜ao dispon´ıveis ao comerciante, tais como o hist´orico de cliente, detalhes de pagamento, detalhes da encomenda e comporta-mento do cliente. ´E feita uma an´alise explorat´oria com os dados disponibilizados pela plataforma online de venda de artigos de luxo Farfetch. S˜ao criadas v´arias vari´aveis novas atrav´es de engenharia de vari´aveis. S˜ao aplicados trˆes algoritmos para o problema de classifica¸c˜ao: Random Forests, Logistic Regression e Support Vector Machines. ´E feita uma implementa¸c˜ao da solu¸c˜ao proposta para classifica¸c˜ao de encomendas na empresa de estudo de caso.
Esta disserta¸c˜ao inclui detalhes sobre os v´arios passos necess´arios para o desen-volvimento de uma solu¸c˜ao de data mining para dete¸c˜ao de fraude. Conclu´ımos que os algoritmos de machine learning s˜ao essenciais como sistema de apoio `a de-cis˜ao humana para classifica¸c˜ao eficiente de encomendas. Os resultados mostram que a decis˜ao de quais vari´aveis utilizar ´e muito importante para o desempenho dos modelos e que Random Forests ´e o modelo mais vers´atil e com a maior efic´acia.
Acknowledgements
I would like to thank Farfetch for giving me the opportunity to develop this project. In particular, I owe my gratitude to my supervisor Francisca Marinho who guided me from day one, to Joana Fernandes for showing me the direction to follow, to Jo˜ao Gomes from whom I learned how to be a data scientist, to Miguel Costa for the great technical input which improved the project and for his persistent feedback, to Inˆes and Andr´e for their friendship and to everyone else at Farfetch who supported me in any way.
I would also like to thank my dissertation supervisor, Prof. Gon¸calo Figueira, who’s help was invaluable for the completion of this document. Thank you for the guidance, for the great feedback and the constant availability. I would like to thank Prof. Jos´e Lu´ıs Moura Borges, Prof. Henriqueta N´ovoa and Prof. Isabel Horta for their support with statistics.
There were many defining moments in the path which led me from the enrolment at this Master to the conclusion of this dissertation. I would like to appreciate all those professors, friends and family who provided me the right opportunities and motivated me to seek to learn more everyday and become, in some way, a better person.
Contents
Contents i List of figures v List of tables vi 1 Introduction 1 1.1 Motivation . . . 11.1.1 E-commerce: how online payments work . . . 2
1.1.2 The fraud detection problem . . . 3
1.2 Objectives and methodology . . . 3
2 State of the Art 5 2.1 Different approaches to fraud detection in card-not-present transactions 5 2.2 Data mining techniques for fraud detection . . . 6
2.2.1 Review of unsupervised methods for fraud detection . . . 6
2.2.2 Review of supervised methods for fraud detection . . . 7
2.2.3 Final perspective on data mining techniques for fraud detection 7 3 Farfetch Case Study 9 3.1 Fraud at Farfetch . . . 9
3.2 Current practice of fraud detection at Farfetch (As-Is) . . . 10
3.2.1 List-based evaluation . . . 11
3.2.2 Key performance indicators . . . 11
3.3 Resources . . . 11
3.4 Proposed approach for Farfetch (To-Be) . . . 12
4 Data understanding and preparation 15 4.1 Building the dataset for study . . . 15
4.1.1 Collection of the data . . . 15
4.1.2 How to label the orders as fraudulent? . . . 16
4.1.3 Time to Chargeback – how to choose the data set . . . 18
4.1.4 Training and Testing set . . . 19
4.2 Exploratory analysis on the training data . . . 20
4.2.1 Time when an order is placed . . . 20
4.2.2 Product gender . . . 21
4.2.3 Order quantity and value . . . 22
iv Contents
4.2.5 Browser . . . 23
4.2.6 Interaction with photos . . . 23
4.2.7 Distribution of frauds per country . . . 24
5 Modelling and evaluation 27 5.1 Data transformation . . . 27
5.1.1 Feature selection . . . 27
5.1.2 One-hot-encoding for low-dimensional categorical variables . 28 5.1.3 Risk-level grouping for high-dimensional categorical variables 28 5.1.4 Engineered variables . . . 29
5.1.5 Imputing missing values . . . 29
5.1.6 Standardization of numerical variables using the Min-Max method 30 5.2 Model Selection . . . 30 5.2.1 Performance measures . . . 30 5.2.2 Cross-validation . . . 32 5.2.3 Testing results . . . 36 5.2.4 Discussion of results . . . 38 5.3 Deployment at Farfetch . . . 42
5.3.1 Order Classification Service . . . 42
5.3.2 Results of implementation . . . 43
6 Conclusion and Future Work 45
Appendices 51
A List of features used in training the algorithms 53
B Comparing Random Forests performance with balanced and
imbal-anced training sets. 55
List of Figures
1.1 Diagram of online payments steps. Source: Montague [2010] . . . . 3
1.2 CRISP-DM reference model phases. Source: Chapman et al. [2000] . 4 3.1 Current process for fraud detection at Farfetch . . . 10
3.2 Proposed process for fraud detection at Farfetch . . . 13
4.1 Criteria for labelling an order as fraudulent. . . 18
4.2 Cumulative distribution of the number of weeks before a chargeback is communicated (Farfetch data) . . . 18
4.3 Distribution of orders by time of day when they are placed. . . 21
4.4 Distribution of variable product gender. . . 22
4.5 Distribution of variables quantity and order value. . . 22
4.6 Distribution of variable PaymentType. . . 23
4.7 Distribution of variable Browser. . . 24
4.8 Occurrence of fraud and total number of orders when user interacted with product photos before purchase or not. . . 24
4.9 Fraudulent orders in each destination country. . . 25
5.1 Example of a Receiver Operating Characteristic curve (ROC) . . . . 32
5.2 Example of the division of the dataset for cross-validation and testing 33 5.3 ROC and PR curves of testing results with Random Forests algorithm. 37 5.4 Histograms of score predictions for each of the labels. . . 38
5.5 Plot of Recall and Specificity for each threshold. . . 38
5.6 Plot of automation level and fraud. . . 39
5.7 Diagram of the Order Classification System . . . 43
5.8 Comparison of scores distributions of orders approved vs. cancelled by Order Processing Team. . . 44
List of Tables
3.1 Data mining goals . . . 13
4.1 Summary of Input Variables . . . 17
4.2 Key statistics of non-binary numeric variables . . . 20
4.3 Division of fraudulent orders between day and night periods . . . 21
5.1 Example of one-hot-encoding: variable PaymentType is transformed into 4 dummy variables . . . 28
5.2 Example of confusion matrix . . . 31
5.3 Results of cross-validation . . . 35
5.4 Testing results of the Random Forests model. . . 36
5.5 Number of legitimate and fraudulent orders whose score falls into each range . . . 37
5.6 Confusion matrix of results when setting threshold at c=0.22. . . 39
5.7 Confusion matrix of results when automatically approving 80% records with lowest estimated suspicion scores. . . 40
5.8 Relative importance of the top 10 attributes. . . 41
A.1 Final list of features used in training. . . 54
Chapter 1
Introduction
1.1
Motivation
“Fraud is nothing new to the merchant. Since the beginning of time, man has always looked for the opportunity to defraud others - to gain goods or services without making payment.” Montague [2010]
Despite not being new, fraud is a major problem for merchants, particularly in the online sector. According to the 14th annual report of CyberSource [CyberSource, 2013] the total revenue loss for e-commerce merchants in North America amounted to $3.5bi in 2012, which represents 0.9% of the total revenue. The report also states that the fraud rate for orders outside of North America was almost twice as high, averaging 1.6%.
Bhatla et al. [2003] define credit card fraud as the action of an individual who uses a credit card for personal reasons without the consent of the owner of the credit card and with no intention of repaying the purchase made. Contrary to what many consumers believe, merchants are responsible for paying the bill when a fraudster steals goods or services in a consumer-not-present(CNP) transaction. These include all transactions where the physical card is not given to the merchant, such as in mail and telephone orders and in e-commerce. On the other hand, card associations protect the merchants in the case of consumer-present (CP) transactions [Montague, 2010]. In case of e-commerce fraud, when an individual has made an unauthorized purchase with a credit card, the merchant who accepted the transaction will loose the product sold (if it has been shipped), may face chargeback fees and loss of reputation [Bhatla et al., 2003].
In order to avoid losses related to fraud, merchants must implement strategies for fraud prevention and fraud detection. Fraud detection is often mistaken for fraud prevention. Bolton et al. [2002] make this distinction clear, “Fraud prevention describes measures to stop fraud from occurring in the first place (...) In contrast, fraud detection involves identifying fraud as quickly as possible once it has been perpetrated.”
Measures for fraud prevention are the key to solving problems of fraud. A very effective measure of fraud prevention in credit cards is the chip-and-pin technology. Despite the prevalence of this technology in Europe, it is still not mainstream in most other regions, including North-America. However, even when fraud prevention is highly effective, fraud detection is still required, since even the most advanced system
2 Chapter 1. Introduction
is prune to fail. Moreover, as fraud detection techniques become more sophisticated, so do fraudsters. Quah and Sriganesh [2008] claim that the key for accurate fraud detection lies in developing dynamic systems that can adapt to new fraud patterns in the e-marketplace. Fraud prevention and detection must therefore evolve hand in hand, faster than fraudsters.
Fraud detection has been explored in several industries with different ap-proaches. When large volumes of data are involved, manual detection becomes impractical. In these cases, the so-called “data mining” techniques, based on statis-tical methods and artificial intelligence, are imperative. Some studied applications of statistical fraud detection methods include:
• Credit applications • Telecommunications • Credit card transactions
The first type of fraud consists in presenting false documentation with the purpose of obtaining credit from a financial institution. The other two applications, telecommunications and credit card transaction fraud were according to Phua et al. [2010] the two most published applications of data mining for fraud detection by 2010. Telecommunications fraud mainly occurs in two forms, subscription fraud (e.g. obtaining a subscription with no intention of paying) or surfing fraud (e.g. mobile phone cloning) [Bolton et al., 2002]. We are concerned about the latter application, credit card fraud detection. Despite the fact that most literature focuses on the bank perspective, this study aims at exploring fraud detection in online payments from the perspective of an e-commerce merchant. Credit card fraud is indeed a big part of the fraud perpetrated in online payments, as explained in the following section.
1.1.1 E-commerce: how online payments work
There are many possibilities for online merchants to accept payments. Montague [2010] mentions examples such as credit card, direct debit, cash alternative payments (such as PayPal, Alipay) or mobile payments. Cash alternative and mobile payments are becoming more popular and are a must for merchants who want to sell in specific overseas regions. However credit card transactions still dominate the market of e-commerce business [Montague, 2010]. Thus, it is fundamental to understand how credit card payments work.
Figure 1.1 describes the steps involved in an online credit card transaction. The merchant first verifies that the card number provided by the customer could be a legitimate card number (Card Authentication). After this step, the merchant will seek feedback from the bank who issued the credit card to be sure that there are funds available in the card account (Card Authorization). Finally, the merchant requests the Settlement of the transaction, the physical transfer of the funds to the merchant’s bank. These steps of the transaction, which can be seen left on Figure 1.1, lead to the conclusion of the sale.
Further steps occur only in case a consumer requests a chargeback by claiming that he did not get the products or services requested or that the order was placed by a fraudster. In this case, the merchant can dispute the chargeback by providing
1.2 Objectives and methodology 3 Start Card Authentication Authorization Settlement Chargeback Successful Sale Represent No Sale
Figure 1.1: Diagram of online payments steps. Source: Montague [2010]
documentation about the order (Representment ). If the merchant cannot reverse the chargeback, he will have to return the money to the customer’s account and the sale is lost. Moreover, merchants can be subject to chargeback fees and fines from card associations if the chargeback rate is above their thresholds [Montague, 2010].
1.1.2 The fraud detection problem
Fraud detection is a data mining problem of increased difficulty, because fraudsters make their best efforts to make their behaviour appear legitimate. This undifferen-tiated behaviour creates a higher challenge in separating good and bad transactions. Another difficulty with fraud detection is that the number of legitimate records is far greater than the number of fraudulent cases [Bolton et al., 2002]. Such imbal-anced data sets require additional precautions from the data analyst. In most cases, fraud detection applications can make use of large records of data. Bolton et al. [2002] mention the example of a credit card company carrying 350m transactions each year. However, such data is very rarely available for study.
The aim of a fraud management solution is to minimize the financial losses due to fraud and the overhead costs of preventing such losses [Bhatla et al., 2003]. An efficient solution must balance the trade-off between the cost of reviewing a transaction and the potential savings due to fraud detection [Bhatla et al., 2003].
1.2
Objectives and methodology
The goal of this study is to develop a risk scoring solution for e-tail merchants based on data mining techniques. As it was noted previously, fraud detection problems involve a trade-off between several objectives. On one hand, the solution must be able to quickly evaluate a large number of transactions. Additionally, it must meet two key metrics: maximize the number of fraudulent transactions detected (i.e. number of chargebacks avoided) and minimize the number of customer insults (i.e. number of legitimate transactions refused).
A proof of concept was built around the case study of the e-tail merchant Farfetch. This case study provided a real setting, which is certainly
representa-4 Chapter 1. Introduction
Figure 1.2: CRISP-DM reference model phases. Source: Chapman et al. [2000]
tive of many business situations. The work was developed with access to factual data and the chance to compare the results with current practice. We followed the methodology suggested in the Cross Industry Standard Process for Data Mining (CRISP-DM), Chapman et al. [2000]. This methodology was published in the year 2000 as a guide for data mining practitioners. It draws a process model for data mining projects organized into phases, generic tasks, specialized tasks and process instances. In this study we went through all main phases of the data mining project as described in Figure 1.2.
At first, we tried to gain understanding of the key business concepts and objectives involved. Thereafter, we tried to collect and understand the data. From there, the data was prepared and modelled with machine learning algorithms. Lastly, we have evaluated the results and deployed the solution at the company of the case study.
The remainder of the dissertation is organised in five more chapters. Chapter 2 comprises a review of the state of the art in fraud detection. Chapter 3 describes the case study of Farfetch. Chapter 4 reports the steps taken in finding the right data and the outcomes of the exploratory analysis performed on it. Chapter 5 describes the use of the machine learning methods for modelling and the results obtained, as well as the deployment process. Chapter 6 presents conclusions of the work done and gives suggestions for future work in this area.
Chapter 2
State of the Art
2.1
Different approaches to fraud detection in
card-not-present transactions
Fraud detection has been the objective of research for a long time. With the increase in online payments, an increase in fraud has followed and merchants and banks must innovate to keep ahead of ever more sophisticated fraud perpetrators. Different approaches have been developed to face the threat of e-commerce fraud. Montague [2010] suggests the following techniques:
• Identity proofing • Guaranteed payments • Expert-rules • Data sharing • Technology • Data mining
Montague [2010] defines each of the techniques in the following way. Identity proofing techniques have the aim of verifying that the customer really is who he says he is. These techniques can include e-mail, phone or address authentication through public data to get proof of the buyer’s identity or calling the customer to assure that he is the owner of the phone. Guaranteed payments include merchandise insurance or authentication services provided by card associations, which guarantee that the merchant is not responsible for chargebacks. Guaranteed payments are very effective, but implemented in exchange of a fee. Expert-rules comprise all the techniques which are based on rules created from the experience of fraud analysts, including the use of positive and negative lists of users or the manual revision of orders. Such rules can be very effective, but it is hard to maintain them up to date. Data sharing allows merchants to have more information about the customer, by acquiring such information from an external provider. This data can include credit records, social network activity or address confirmation. Data sharing can be very useful when used in combination with scoring models. Technology services can be used to enhance the available information on the user. A merchant can use
6 Chapter 2. State of the Art
biometrics systems to confirm identity or detect the use of proxy servers to hide the IP address of the device used in the purchase. Although technological advancements help stopping fraud, fraudsters also innovate and make use of them to hide their identity.
Data mining techniques take into account past transactions to estimate the probability of a new transaction being fraudulent, by the use of advanced statistical methods. The output of data mining techniques can be a suspicion score or a direct advise to accept or reject the order. Due to the technical complexity of these techniques, a high experience is needed in order to implement them and they require an organised history of orders to learn from. We will now go into more detail on data mining techniques.
2.2
Data mining techniques for fraud detection
According to Phua et al. [2010], “it is impossible to be absolutely certain about the legitimacy of and intention behind an application or transaction. Given the reality, the best cost effective option is to tease out possible evidences of fraud from the available data using mathematical algorithms.” Data mining techniques for fraud detection are divided in two main approaches:
• Supervised methods • Unsupervised methods
Both of these approaches are based on training an algorithm with a record of observations from the past. Supervised methods require that each of those observa-tions used for learning has a label about which class it belongs to. In the context of fraud detection, this means that for each observation we know if it belongs to the class “fraudulent” or to the class “legitimate”. Supervised methods could also be used to learn multi-class problems (more than two classes), but this is usually not the case in fraud detection.
As noted before (cf. Introduction), fraud detection classification problems suf-fer from the issue of imbalanced class sizes, i.e. the number of fraudulent records is much smaller than that of legitimate transactions. Moreover, existing fraud de-tection measures usually reduce the number of frauds available for study to an even lower number. Most supervised methods perform best when trained on a balanced data set.
It is common to face data mining problems when we do not know to which class an observation belongs. For example, take the case of an online order which payment was rejected. One will never know whether this was a legitimate order or whether it had been correctly rejected. Such occurrences favour the use of unsupervised methods, which do not require data to be labelled. These methods look for extreme data occurrences or outliers. In order to get the best of two worlds, some solutions combine supervised and unsupervised techniques.
2.2.1 Review of unsupervised methods for fraud detection
Unsupervised methods are often used for exploratory analysis of data and prepro-cessing. When trying to reduce the dimensionality of samples, it is very useful to
2.2 Data mining techniques for fraud detection 7
use unsupervised methods such as clustering or principal component analysis to find interesting directions to explore. In fraud detection, unsupervised methods imple-mentations focus on finding outlier transactions, which do not agree with normal patterns. However, such methods are not adequate for complete fraud detection so-lutions. Indeed, almost all authors studied preferred the use of supervised learning. Moreau et al. [1999] compared the use of supervised and unsupervised neural networks. Their experiment had results where the unsupervised method performed far below the supervised neural network. Cortes et al. [2001] explored the use of Graph analysis for fraud detection in a telecommunications setting. Given its nature, telecommunications fraud is a logical candidate area to use graph analysis. Quah and Sriganesh [2008] proposed a mixed approach with the use of a self-organising map which feeds a Neural Network if a transaction does not fall into an identified normal behaviour for the given customer.
2.2.2 Review of supervised methods for fraud detection
Most of the published work on statistical methods for fraud detection falls under the category of supervised methods.
Ghosh and Reilly [1994] proposed the use of a neural network for fraud de-tection at a commercial bank, which proved more accurate than the previously implemented rule based expert system. Fawcett and Provost [1997] studied the use of a profiling approach to telecommunications fraud. The creation of profiles of user behaviour is favoured if there is a high usage of the service, such as in the case of telecommunications. Merchants usually do not have access to payment data other than the transactions made at this specific merchant, which makes it hard to trace a consumer spending profile. Chan and Stolfo [1998] discussed the combination of multiple classifiers in an attempt to create scalable systems which would be able to deal with large volumes of data. In general, the emphasis of research in the late 90s and early 2000s was on Artificial Neural Networks. Bolton et al. [2002] noted in 2002 that the published literature about fraud detection was scarce.
More recently, some other works have been published, making use of newer classification techniques. Srivastava et al. [2008] built a model based on a Hid-den Markov Model, with focus on fraud detection for credit card issuing banks. Whitrow et al. [2009] also worked on credit-card fraud detection with data from a bank, in particular addressing the way of pre-processing the data. They studied the use of aggregation of transactions when using Random Forests, Support Vector Machines, Logistic Regression and K-Nearest Neighbour techniques. Bhattacharyya et al. [2011] compared the performance of Random Forests, Support Vector Ma-chines and Logistic Regression for detecting fraud of credit-card transactions in an international financial institution. Random Forest proved to be the most effective and most versatile method in this case.
2.2.3 Final perspective on data mining techniques for fraud detec-tion
Phua et al. [2010] pinpoint two criticisms to the data mining studies of fraud detec-tion: the lack of publicly available data and the lack of published literature on the
8 Chapter 2. State of the Art
topic. Moreover, despite the fact that there are many research papers about statisti-cal methods for fraud detection, Phua et al. [2010] point out that only seven studies claimed to have been implemented in practice by 2010. Most literature on credit card fraud detection has focused on classification models with data from banks. Such data invariably consists of transaction registries, where it is possible to find fraud evidence such as “collision” or “high velocity” events, i.e. transactions hap-pening at the same time in different locations. Some authors have also addressed the techniques for finding the best derived features. Whitrow et al. [2009] proved that transaction aggregation improved performance in some situations, with the aggre-gation period being an important parameter. However, none of these particularities seems to apply to a case of detecting fraud with data from one single merchant as in our case.
In this study, we chose to use methods of supervised learning for the classifica-tion problem, because it is common for fraud detecclassifica-tion applicaclassifica-tions to have labelled data for training. We chose to test three different models. Logistic regression be-cause of its popularity, and Random Forests and Support Vector Machines, which have been used in a variety of applications showing superior performance [Bhat-tacharyya et al., 2011]. Meyer et al. [2003] showed that Support Vector Machines perform well in classification problems. Bhattacharyya et al. [2011] claim that Ran-dom Forests are very attractive for fraud detection due to the ease of application and being computationally efficient.
Chapter 3
Farfetch Case Study
3.1
Fraud at Farfetch
Farfetch is one of the leading online luxury fashion retailers in 2015. The company follows a marketplace business model, selling items from more than 300 partner bou-tiques on a commission basis. The partner boubou-tiques place their items online on the Farfetch.com portal, which allows small-medium boutiques to reach a global audi-ence with economies of scale. Farfetch provides an omni-channel buying experiaudi-ence through the website, mobile or via telephone order. The value proposition for bou-tiques includes payment processing, branding, online content creation, out-bound logistics and customer service.
Farfetch was founded in 2008 and had substantial growth since then. Its focus is on retailing luxury items, which results in an average order value of around $650. The gross merchandise revenue in 2014 amounted to $300m and the company expects to grow by 70% in 2015, reaching $500m in sales.
As part of payment processing, fraud detection is included as an added value service provided by Farfetch. Moreover, being acknowledged by customers and card associations as a trustworthy merchant is even more important when doing business online. Farfetch wants to provide its customers high payment acceptance rates in order to convert as many sales as possible, while keeping the number of fraud occurrences to a minimum level. The company’s prospects for the mid-term future foresee a sustained growth rate around 50-70%/year. This means that it must find a way to quickly evaluate a large number of orders in order to maintain the efficient service to its growing customer base.
Besides handling its own website, one of the pillars of the strategy of Farfetch is the provision of its platform as a service for brands to manage their e-commerce operations for them. This project, named “Black & White” is planned to launch in 2016. In this case, payment processing and fraud detection are again part of the value proposition of Farfetch.
Farfetch provides a good case study for a data mining solution for fraud detec-tion, because it is representative of an online retailer and there is a large record of orders to study from. Furthermore, the company’s interest in exploring this solution in-house is high, since fraud detection is aligned with the company’s strategy.
10 Chapter 3. Farfetch Case Study
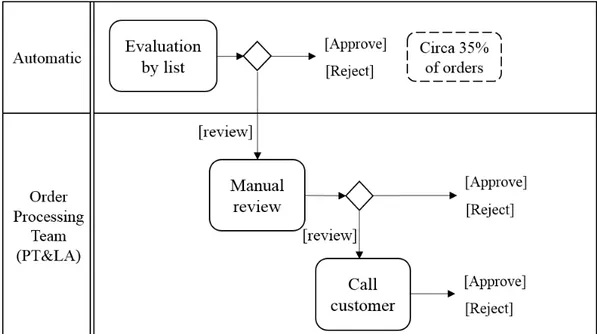
Figure 3.1: Current process for fraud detection at Farfetch
Each case has its own particular characteristics, different areas and merchants are affected by fraud differently. At Farfetch, the history of orders to study from is skewed towards more recent dates due to its high growth rate. This means that there are not so many old orders to learn fraud patterns from, as more recent orders. The evolution of Farfetch’s business also presents another challenge: it became a more popular target for fraud as it became more famous.
Furthermore, Farfetch ships to anywhere in the world. Such service is of high value to attract customers, but also comes with challenges in terms of fraud pre-vention and detection. Shipping goods to countries where it is almost impossible to verify addresses is a big risk. The diversity of locations also adds to the complexity of detecting geographical patterns of fraud.
3.2
Current practice of fraud detection at Farfetch
(As-Is)
Fraud detection at Farfetch is called order approval, as the final decision to take is whether to approve or reject the order. This is done in 2 main steps:
1. An automatic screening based on lists of trusted users 2. A manual review process for the rest of the orders
Figure 3.1 illustrates the different steps in the order approval process. At first, the user which made the order is compared against a positive list of trusted users and a negative list of fraudulent users. In case the user is found on one of the lists, the order is immediately approved or refused, respectively. The generation of the lists is based on expert-rules and described in Section 3.2.1. This first screening step processes circa 35% of all orders. Very few orders are refused at this step, as
3.3 Resources 11
fraudsters quickly learn that the user account they used before has been blocked. Most processed orders are approvals of orders by long-time clients.
The second step of the approval process requires direct human intervention and is handled by the Order Support Team. This team handles all global orders and is divided between the Farfetch office in Porto, Portugal and Los Angeles, USA, providing service 24/7.
The details of the orders are checked by the team for any indications of fraud. The kind of indications that they are looking for is described in Section 3.3. If this team suspects that the order is fraudulent, they will either cancel it or call the customer to get more details.
In the case that doubts remain after calling the customer (no confidence that the order is legitimate nor fraudulent), the fraud analyst can decide to subject the order to an evaluation by a third-party evaluation provider. This external provider acts as an insurance: it can approve the order collecting a share of the sale and it will cover the cost in case of a chargeback. Recurring to this provider is expensive and only a residual number of orders go through that evaluation.
The Farfetch office in Brazil has its own order approval process and is not in the scope of our research. All other orders, except those being shipped to Brazil, are included in this study.
3.2.1 List-based evaluation
The positive list which contains the trusted users, whose orders are automatically approved, is updated on a regular basis. The criteria for considering a user trust-worthy is based on her/his history of orders. If its values surpass the established thresholds, this user in put on the positive list. Likewise, any user whose order was flagged as fraudulent will be put on the negative list, whose orders get automatically rejected. It is important to note that not all rejected orders are flagged as fraudu-lent, only those for which the Order Support Team is certain of fraudulent activity or the orders which originated a chargeback.
3.2.2 Key performance indicators
Farfetch tracks several key performance indicators (KPIs) related to fraud detection in daily, weekly and monthly reports. The main KPIs consist of: the automation level - percentage of orders automatically processed; chargeback level - percentage of orders which originate a chargeback (calculated by order value); rate of refused payments - percentage of payments which are refused (calculated by order value); speed of processing - time it takes to approve or reject an order payment; level of proof of billing - percentage of orders which require a call to the customer.
3.3
Resources
The fraud analysts at Farfetch review most orders manually and thus have an ex-tensive experience about fraud detection. According to their practical observations, the important signs to look for when evaluating an order are:
12 Chapter 3. Farfetch Case Study
• Accordance of shipping and billing addresses with the country of the credit card being used (e.g. a credit card from the UK being used in an order to be shipped to Australia would be noticed as a riskier transaction);
• Past fraud occurrences with the same shipping address (e.g. certain cities were considered of higher risk);
• Number of previous orders from the same customer (long time customers were almost always considered legitimate);
• Type and brand of products (specific brands were preferred targets of fraud); • Number of cards used by customer (a high number of cards tested would be
considered highly suspicious);
• Sudden increases in order values (e.g. it was thought that fraudsters would generally attempt to purchase lower value items first and only later place orders on their real targets: high value products);
• Orders placed by other users with the same name or to the same address (might be an indication of multiple accounts used by the same individual); • Publicly available information on the internet about the customer (trying to
understand whether the customer is a real person and not a fake alias).
We were given access to all the data related to transactions, orders and prod-ucts in the database of Farfetch. However, this data was not organised for fraud detection and must be mined for relevant information.
3.4
Proposed approach for Farfetch (To-Be)
The objective of Farfetch is to develop a process which will result in a higher number of orders approved automatically, while not increasing the chargeback rate (i.e. the number of fraudulent orders approved).
The company wants fraud detection to continue being a part of its value proposition, even with the expected increase in the number of orders to process. The current fraud detection process is not sustainable, because it would require Farfetch to keep growing its Order Processing Team, which brings two challenges: increasing costs and increasing difficulty to coordinate the team.
Hence, the proposed solution should achieve a higher automation rate than the current process, keep the chargeback level stable and not increase the rate of refused payments. In the medium-term the proposed solution should allow Farfetch to reach a level of automation of 80% by the end of 2016, with a chargeback rate under 1% and a payment refused rate under 4.5%. The data mining goals listed in Table 3.1 state in technical terms the desired outcomes to achieve these business goals [Chapman et al., 2000].
The proposed approach consists in building a risk scoring system based on ma-chine learning methods which will estimate a Fraud Suspicion Score for each order. This system would replace the current list-based order processing step. As opposed
3.4 Proposed approach for Farfetch (To-Be) 13
Table 3.1: Data mining goals
Goal Indicator
Increase number of orders automatically processed
Number of orders with a suspicion score which falls in the extremes of the range (i.e. close to 0 or close to 1).
Low chargeback rate Number of false negatives (i.e. Fraudulent orders with a low suspicion score)
Low rate of refused pay-ments
Number of false positives (i.e. Legitimate orders with a high suspicion score)
Figure 3.2: Proposed process for fraud detection at Farfetch
to comparing each order with a list of trustworthy users built by expert-rules, the risk scoring should take many more characteristics of the order into consideration (e.g. shipping destination, products being purchased, time of the order, etc.). A diagram of the proposed process can be seen on Figure 3.2.
The suspicion score estimated by the model should be a number between 0 and 1. The risk scoring model would also evaluate whether the score falls below a certain threshold (e.g. lower than 30%), where the order would be automatically approved; or higher than an upper threshold (e.g. higher than 70%), where the order would be automatically rejected. Orders with a score between the lower and the upper thresholds would be manually evaluated by the order processing team, which could also count on the suspicion score for a better evaluation. It is expected that the number of orders whose score fall in the extreme areas is higher than 35% of all orders, in order to reach a higher automation rate than with the currently used list-based evaluation.
As a first step, we tried to gain a complete business understanding of the problem. We had interviews with the involved parties at the company and shadowed their fraud analysts at work. Finally we agreed on the objectives of the study and the expected outcomes for the company.
14 Chapter 3. Farfetch Case Study
The second step involved building the data set of orders history. After a short exploratory analysis we went to write a query to extract the data from the databases. A thorough exploratory statistical analysis followed, where we identified possible patterns of fraud by looking at individual variable distributions. The outcome was a report which could be presented to the case study company to guide them in their own analysis.
Next, the work on data modelling and data preparation evolved in parallel. The variables which could not be included in the deployed model were left out; the rest was prepared for modelling. During the modelling of the data we sequentially performed training of three distinct machine learning algorithms: Logistic Regres-sion, Random Forests and Support Vector Machines. This included performing validation to find good model parameters and testing the solutions. The last step was the deployment at Farfetch.
Chapter 4
Data understanding and
preparation
4.1
Building the dataset for study
Building the dataset on which to base the study is not a trivial activity and requires decisions which can greatly affect the quality of the data mining project. Which data to use? Where is this data to be found? Is all available data correct? The following sections describe the reasoning behind the building of the data set which was the basis of this study.
The handling of the data was done with the use of the programming lan-guage Python [Rossum, 1995], version 2.7 available through the Python Software Foundation at http://www.python.org. Two particular modules for Python, Pan-das data structures [McKinney, 2010] and Scikit-Learn [Pedregosa et al., 2011], were especially useful for the modelling of the algorithms.
4.1.1 Collection of the data
Taking in consideration the input from the Order Processing Team described in Section 3.3 and the examples in the literature, we decided that the main unit to analyse would be each individual order. With that in mind, the objective at this stage was to build a table where each row would correspond to one order and each column would represent different attributes of such order.
The bulk of data was queried from a table where each line describes one product item in an order. Hence, a function of aggregation was applied so that each observation would correspond to one order. At this point, several issues arose: each order could have multiple products and for each line to represent an order, one must aggregate the characteristics of the products purchased. Thus, a column was created for each product gender (“Men”, “Women” or “Other”) and a count of the number of products corresponding to each gender in the order was made. The same was done for the product family (“Clothing”, “Shoes”, etc.). Aggregating the brand of the product could not be done in the same way, because there were more than 2.500 possible brands – it would imply adding 2.500 columns to the table. To overcome this problem, we chose to create individual columns for the 20 best-selling brands only. Other products attributes such as item price or quantity were simply summed. The aggregation steps were:
16 Chapter 4. Data understanding and preparation
1. Read all order-product lines 2. Group by order
(a) Sum item price, quantity
(b) Create one column for each gender, category and sum occurrences (c) Aggregate product brand
i. Find the 20 top brands
ii. Create one column for each of the top 20 brands, count the rest under the column BrandOther
3. Read and append data on the transaction (payment provider feedback) 4. Read and append data on user session (e.g. number of pageviews)
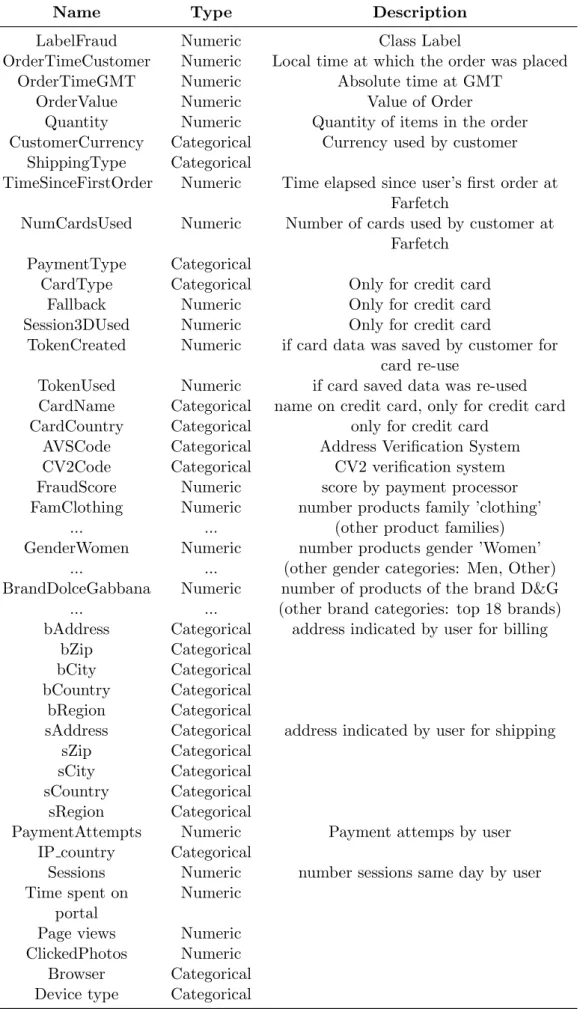
Building the data set and aggregating data involves a trade-off. A higher level of aggregation results in a larger (more significant) number of occurrences per category. On the other hand, the loss of information can be substantial if the aggregation level is too high. Therefore, a balance had to be found. The final list of variables in the data set can be read in Table 4.1.
4.1.2 How to label the orders as fraudulent?
One of the challenges in classification is the definition of the class for each data entry. In our case, we faced a binary classification problem. Accordingly, each data entry – an order – should be labelled as belonging to one of two classes: fraudulent or non-fraudulent.
While it is possible to know which orders originated a chargeback transaction, this does not comprise the whole set of fraudulent orders, because fraudulent orders which were rejected did not lead to a transaction and naturally no chargeback. Hence, a broader definition of the class fraudulent had to be found. The available information on each order included:
• Approved or rejected by Order Processing Team
• If rejected, expressly marked as fraudulent by Order Processing Team • If approved, led (or not led) to a chargeback
Therefore, two criteria are taken into consideration when defining the classes of the dataset and we created a variable which is called LabelFraud with a value of 0 or 1, such that:
1. Order originated a chargeback or was marked as fraudulent (see Fig 4.1) → Label as fraudulent (LabelFraud =1)
4.1 Building the dataset for study 17
Table 4.1: Summary of Input Variables
Name Type Description
LabelFraud Numeric Class Label
OrderTimeCustomer Numeric Local time at which the order was placed
OrderTimeGMT Numeric Absolute time at GMT
OrderValue Numeric Value of Order
Quantity Numeric Quantity of items in the order
CustomerCurrency Categorical Currency used by customer ShippingType Categorical
TimeSinceFirstOrder Numeric Time elapsed since user’s first order at Farfetch
NumCardsUsed Numeric Number of cards used by customer at Farfetch
PaymentType Categorical
CardType Categorical Only for credit card
Fallback Numeric Only for credit card
Session3DUsed Numeric Only for credit card
TokenCreated Numeric if card data was saved by customer for card re-use
TokenUsed Numeric if card saved data was re-used
CardName Categorical name on credit card, only for credit card
CardCountry Categorical only for credit card
AVSCode Categorical Address Verification System
CV2Code Categorical CV2 verification system
FraudScore Numeric score by payment processor
FamClothing Numeric number products family ’clothing’
... ... (other product families)
GenderWomen Numeric number products gender ’Women’
... ... (other gender categories: Men, Other)
BrandDolceGabbana Numeric number of products of the brand D&G
... ... (other brand categories: top 18 brands)
bAddress Categorical address indicated by user for billing
bZip Categorical
bCity Categorical
bCountry Categorical
bRegion Categorical
sAddress Categorical address indicated by user for shipping
sZip Categorical
sCity Categorical
sCountry Categorical
sRegion Categorical
PaymentAttempts Numeric Payment attemps by user
IP country Categorical
Sessions Numeric number sessions same day by user Time spent on
portal
Numeric
Page views Numeric
ClickedPhotos Numeric
Browser Categorical
18 Chapter 4. Data understanding and preparation Order Rejected Marked explicitly as fraud? Approved Chargeback Occurred?
Figure 4.1: Criteria for labelling an order as fraudulent.
Figure 4.2: Cumulative distribution of the number of weeks before a chargeback is communicated (Farfetch data)
4.1.3 Time to Chargeback – how to choose the data set
It takes a long time for the merchant to realise that a fraudulent transaction has occurred. Most commonly, the alarm is first raised by the legitimate owner of the credit card, who notices a transaction in his bank statement that he did not make. Next, he must place a complaint on that transaction, which will originate a chargeback. It seems natural, that with such lengthy procedures, it takes several weeks between the time that the fraudsters uses the credit card and the merchant is noticed of the chargeback.
This restricts the orders we can use for data mining, because the most recent frauds won’t have been detected yet, i.e. the client did not submit a chargeback or it was not yet communicated to the merchant. Hence, the first question to ask is: which data can we study? How long does it take to know if an order was legitimate or fraudulent?
The answer to these questions lies in knowing how long it will take between the time that the order is placed and the chargeback is registered in the system of the merchant. We found the answer by studying the chargeback history at Farfetch. We can see from Figure 4.2 that 80% of the chargebacks arrive within the first 11
4.1 Building the dataset for study 19
weeks after the transaction.
Knowing this, it was decided that the data to be analysed should be no more recent than 16 weeks (circa 4 months). Thus, the data set was trimmed to only include orders older than July 2015. At the deployment stage, this criterion was also included in order not to take the most recent data in consideration when training the algorithm in the future.
4.1.4 Training and Testing set
The data set is split in two: a training and a testing set. Part of the data (the training set) is then used for the algorithm to learn how to classify orders. The remaining data (the testing set) is kept isolated, to be used just at the end of the modelling procedure to estimate the performance of the chosen model, removing the overfitting effect, i.e. the increase in performance that the algorithm has on the instances it has based its learning on, when evaluating new orders, due to the random error present in those particular instances.
According to the literature, the division between the number of observations in the testing set should lay between 20-40% of the total number of data entries. We chose to use 20% of them for testing, hence 80% of the data set was used for training.
Besides deciding the amount of entries which belong in each set, we must also decide which entries they are. The purpose of a testing set is to replicate as close as possible the performance of the model when evaluating new data. It stands to reason that randomly selected observations would emulate new data closer than observations filtered by any variable. However, we chose to take into account the date when the order was placed and consider the most recent 20% of orders for testing. The reasoning behind this was that patterns of fraud change over time and more recent orders would better emulate new orders.
The result of the division is a training set containing the orders placed be-tween 2015-01-01 and 2015-06-21, totalling 347.572 observations; and a testing set containing the orders placed between 2015-06-22 and 2015-08-04, in a total of 86.893 orders.
20 Chapter 4. Data understanding and preparation
Table 4.2: Key statistics of non-binary numeric variables
Name Count Mean Std Skewness Kurtosis
Quantity 347572 1.84 1.65 7.28 159.82 OrderValue 347572 502.25 682.91 9.62 336.67 TimeCustomer 347572 13.87 6.45 -0.58 -0.51 TimeGMT 347572 12.34 6.63 -0.21 -1.07 TimeSinceFirstOrder (Weeks) 347572 39.48 58.34 1.84 3.23 NumCardsUsed 347572 1.65 2.31 10.19 220.43 FraudScore 347572 1.59 22.77 -9.38 156.89 PaymentAttempts 347572 1.46 1.95 18.03 843.38 Sessions 338579 3.33 3.13 3.17 25.68 TimeSpent 338579 53.71 64.28 3.92 30.31 TotalPageViews 338579 45.79 49.31 3.9 28.8
4.2
Exploratory analysis on the training data
The analysis in this chapter is done with data from the training set only. Before analysing the data, it is important to get an idea about the distributions of the nu-meric variables. Table 4.2 shows some statistics of the non-binary nunu-meric variables. The first thing to note is that the variables related to the browser session of the user (sessions, TimeSpent and TotalPageViews) only count 338.579 observations. This means that there are 8.993 orders for which the data on these variables is missing.
Looking at the table we can also note the high values of standard deviation (at the same level as the mean). This suggests that there are very distinct patterns of behaviour. The high kurtosis values indicate a peak around the mean value and a long tail of extreme values. We can also learn from the table that some variables’ distributions are highly skewed, which is a sign that those distributions are not symmetric.
Considering that the orders in our sample correspond to a period of 172 days, we have on average 2020 orders per day. The classification algorithm must be fast enough to evaluate larger amounts of data per day, as the company is growing rapidly, so are its sales.
The following sub-sections present the most relevant results from the ex-ploratory analysis on the relationship between individual variables and the occur-rence of fraud.
4.2.1 Time when an order is placed
In order to have a better understanding of the influence of the time dimension in the data, we studied the variable OrderTimeCustomer which holds the information about the time at the customer’s location when he placed the order.
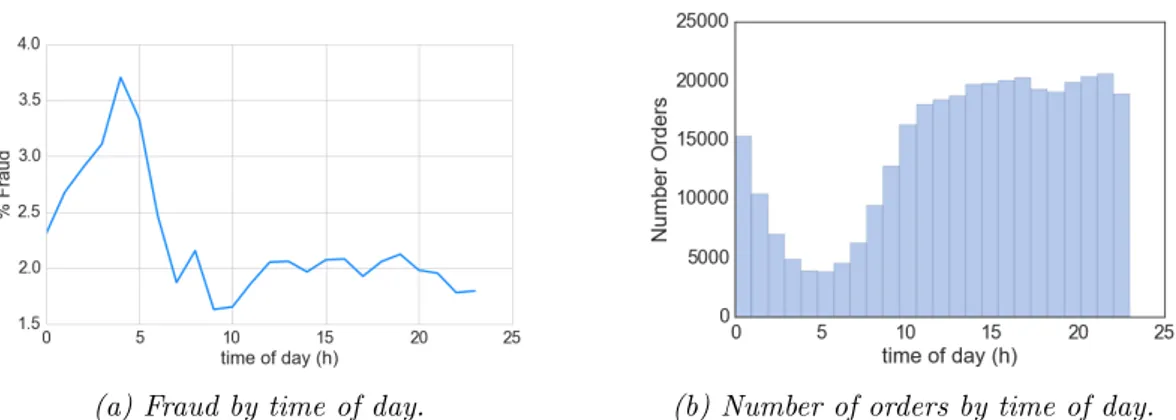
On Figure 4.3a we can notice that there is a peak in the chart around 4am. This chart plots the ratio of fraudulent orders among all the orders placed in that hour of the day. Hence, the peak tells us that about 3.7% of all orders placed between 4 and 5am were fraudulent. We can tell from this figure that there is a trend for
4.2 Exploratory analysis on the training data 21
(a) Fraud by time of day. (b) Number of orders by time of day.
Figure 4.3: Distribution of orders by time of day when they are placed. Table 4.3: Division of fraudulent orders between day and night periods
23pm to 10am 10am to 23pm
% all fraudulent orders 31% 69%
orders placed between midnight and 6am to have a higher number of fraudulent orders among them.
On the right, on Figure 4.3b, we can see the number of orders placed at each time of the day. A slope in the number of orders placed is noticeable between 1 and 9am. It is interesting to note that the number of orders placed at each hour is relatively stable between 10am and 23pm.
We can conclude that the great majority of fraudulent orders are placed during day time (10-23h) as is confirmed on Table 4.3. However, the orders placed during the night have a higher probability of being fraudulent.
We recommend the fraud analysts to place a special attention to the orders which are placed during the period when it is night at the location of the customer.
4.2.2 Product gender
Very few orders include both products for men and for women. Hence, we consider an order of the gender “Women” if the majority of products in that order are of that type (e.g. three items for women and one item for men). The same goes for products of the gender “Men” and “Other”, which includes all unisex products. This abstraction makes it easier for us to study the patterns of fraud related to product genders.
There is a noticeable majority of orders whose products’ gender is “Women”, as can be seen from Figure 4.4b. Despite the majority of orders being for products with gender “Women”, two thirds (65%) of all fraudulent orders are of products of the gender “Men”.
When taking a closer look at the occurrence of fraud in each of the genders in Figure 4.4a, we notice that only 0.9% of “Women” product orders are fraudulent, while this number reaches 3.9% for “Men” and 3.1% for “Other”. One can conclude, that there is a higher prevalence of fraud in orders of products for men and unisex
22 Chapter 4. Data understanding and preparation
(a) Fraudulent orders by Gender. (b) Number of orders by Gender.
Figure 4.4: Distribution of variable product gender.
(a) Distribution of variable quantity in le-gitimate and fraudulent orders.
(b) Distribution of variable order value in legitimate and fraudulent orders.
Figure 4.5: Distribution of variables quantity and order value.
products.
4.2.3 Order quantity and value
As both the order quantity and value had a very high number of outliers, we applied a winsorizing technique to remove outliers before drawing the chat on Figures 4.5a and 4.5b. The data was only altered for plotting purposes, the data used for training was not subjected to this function.
It can be seen on Figure 4.5a that fraudulent orders have a tendency to include a higher quantity of items than legitimate orders. It can be seen from the box plot that only 5% of all legitimate orders have more than three items, while that level corresponds to 25% of the fraudulent orders.
When it comes to the value of the order, we can observe the same pattern: fraudulent orders have on average a higher value. This can been seen on Figure 4.5b, where to two box plot graphs are slightly misaligned.
4.2.4 Payment type
Credit card and PayPal are the two main types of payment used in this dataset. Other payment types exist, but are negligible as can be seen on Figure 4.6b.
4.2 Exploratory analysis on the training data 23
(a) Fraudulent orders by Payment Type. (b) Number of orders by Payment Type.
Figure 4.6: Distribution of variable PaymentType.
fraudulent more often than purchases using PayPal. In fact, almost 2.5% of all credit card purchases are fraudulent, vs. 0.6% for PayPal. This is mainly due to the security measures implemented by the PayPal service, which make it such a popular alternative to credit cards as was discussed in Chapter 1 (Introduction).
4.2.5 Browser
The next analysis focused on recognizing differences in the level of fraud of orders made with different web browsers. On Figure 4.7a, we notice a significant difference in the level of fraud between browsers. Circa 6% of all orders made with the Firefox browser were fraudulent, while this value only reached circa 1.2% of the orders made with Safari. On an intermediate level, 3% of the orders made with Chrome were fraudulent.
In order to know how many orders (legitimate and fraudulent) were made with each browser, we studied Figure 4.7b. About half of all orders were made with Safari (of which only circa 1.2% were fraud, as seen before).
These results tell us that the Browser used is probably a very explanatory variable. Before this study, the information about Browser used to make the pur-chase was not available for the Order Processing Team. We recommend that this variable be taken in consideration by this team, in particular that special attention is paid to orders made with the Browser Firefox.
4.2.6 Interaction with photos
In the scope of studying the variables about the behaviour of the user on the website before making the purchase, we studied the variable InteractedWithPhotos which tells us whether the user has clicked on photos of products. The rationale behind this, was the intuition that fraudsters are not as interested in the product they are buying as legitimate users and might add items to their basket without inspecting their images.
In fact, orders where the user did not interact with photos on the day of the purchase have a higher probability of fraud. On Figure 4.8a we see that there are circa 3.6% of fraudulent orders out of all those where there was no interaction with photos, while only 1.4% in the case that inspection of the photos had happened.
24 Chapter 4. Data understanding and preparation
(a) Occurrence of frauds by browser. (b) Number of orders by browser.
Figure 4.7: Distribution of variable Browser.
(a) Occurrence of fraud. (b) ’Number of orders.
Figure 4.8: Occurrence of fraud and total number of orders when user interacted with product photos before purchase or not.
Figure 4.8b shows the occurrence of each of the two cases in the total amount of orders studied. We see that circa one third of all orders are not preceded by interaction with the photos.
As with the information about the Browser used in the purchase, the behaviour of the user towards photographs, was not taken into account or even available to the Order Processing Team. After our analysis, we recommended that this information be displayed in the order approval dashboard and that the fraud analysts consider no interaction with photos as a suspicious sign of fraud.
4.2.7 Distribution of frauds per country
In order to understand the geographical dimension of fraud, we studied the occur-rence of frauds in orders shipped to different countries. First, we calculated the ratio of fraudulent orders over the total number of orders in each country i :
F raudratioi =
F raudulentOrdersi
T otalOrders (4.1)
Countries with less than 30 orders, have been considered not significant and excluded from this analysis.
4.2 Exploratory analysis on the training data 25
Figure 4.9: Fraudulent orders in each destination country.
The result of equation (4.1) is a list of pairs (country,ratio). We have plotted this list on a map of the world, as seen on figure 4.9. The darker colours represent countries where a bigger share of orders shipped to this country were fraudulent. The lighter colours represent the countries with a lower fraud level and countries in white are those which were excluded.
Mexico, Peru, Algeria, Angola, France, Ireland, South-Africa and Indonesia are some of the countries with a higher rate of frauds. This result is in line with the empirical experience of the Order Processing Team. When an order for any of these countries is placed, a fraud analyst must pay especial attention to it and look for other indications of fraud.
Chapter 5
Modelling and evaluation
5.1
Data transformation
The exploratory analysis presented in the previous chapter gives a first insight re-garding the relevance and behaviour of each variable when detecting fraud. In this chapter we show how to transform and include the studied data set in machine learning algorithms, which will automatically combine those variables in a system-atic and effective way. At the end, models are compared and the best is chosen for deployment in the case study.
In order to use machine learning algorithms such as Support Vector Machines, one must transform all categorical variables into numerical. Moreover, these must also be transformed through a standardization process, so that all values have the same scale [Miner et al., 2009].
We begin by filtering the variables which could not be used in the model, as described in Section 5.1.1. Next we perform transformations in order to make sure that all variables have a numeric representation, through one-hot-encoding (Section 5.1.2) and risk-level grouping (Section 5.1.3). We engineer new features through the use of several functions, detailed in Section 5.1.4.
It was seen on Section 4.2 that some variables had missing values. This is corrected by imputing a likely value, as described in Section 5.1.5. Lastly, the variables are standardized to the same value range, which is done according to Section 5.1.6.
All these transformations were applied separately on the training and testing set in order not to “contaminate” the data. For instance, the parameters for stan-dardization of the training set were saved and used for the stanstan-dardization of the testing set, as it would not be possible to calculate such parameters from a single new observation.
5.1.1 Feature selection
Unfortunately, not all variables which were studied in Chapter 4 could be used in the deployment stage. This constraint comes from the difficulty in calculating such variables when evaluating a new order. In particular, the variables related to the session of the user: device and browser used, number of page views, number of sessions, time spent on the website and interaction with photos, could not be
28 Chapter 5. Modelling and evaluation
Table 5.1: Example of one-hot-encoding: variable PaymentType is transformed into 4 dummy vari-ables
Order Payment Type
1 Type A 2 Type B 3 Type C 4 Type A 5 Type A 6 Type D
−
→
Order Type A Type B Type C Type D
1 1 0 0 0 2 0 1 0 0 3 0 0 1 0 4 1 0 0 0 5 1 0 0 0 6 0 0 0 1
accessed from the database in real time.
It would be possible to use them to train the algorithm, because they exist in the order history. However, we chose not to count on them in order to use a model which would work as closely as possible to the reality. The use of theses variable is an option for a future upgrade of the model.
The categorical variables which were considered for feature engineering, but had no meaning by themselves, were also deleted. This included all the address and name information. Other categorical variables were transformed as seen in sections 5.1.2 and 5.1.3.
5.1.2 One-hot-encoding for low-dimensional categorical variables Categorical variables with few categories were transformed into several features through one-hot-encoding. One-hot-encoding is a method which consists of en-coding a variable through binary numbers. In our case, we created one column for each of the categories of the variable. An example of this transformation can be seen on Table 5.1. This technique will allow the model to fit such variables, but as the dimensionality grows the model looses generality [Miner et al., 2009]. Hence, one-hot-encoding should not be applied to variables with an extensive number of categories, as to do so would increase the dimensionality of the sample too much. 5.1.3 Risk-level grouping for high-dimensional categorical variables Variables such as the address country include too many categories (more than 200 different countries) to be transformed into individual features through one-hot-encoding. The choice was to transform the variables sCountry and sCity into features which translate the risk associated with each of the countries.
We calculated the value of the fraud ratio for each country as described in Section 4.2.7. Following that, the countries have been clustered in four groups. The clustering technique used is called Jenks natural breaks optimization (one-dimensional variant of k-means)and was developed by the cartographer George Jenks [of Kansas. Dept. of Geography and Jenks, 1977]. This technique seeks to minimize within-group variance, while maximizing between-group variance.
The number of clusters (four) was chosen by considering what could be a rea-sonable number of risk levels in such a problem. Alternatively, an iterative method for choosing the number of classes could have been used (North [2009] proposes such
5.1 Data transformation 29
a solution). Further alternatives could include creating individual features only for each of the most represented categories (e.g. US as the most represented category of variable sCountry).
The chosen method, to group categories into risk-level groups, does not take into account any multivariate effect, because the label “fraud” is the only criterion used for this risk evaluation. The method was however, the most practical way to transform the categories without greatly increasing the dimensionality of the sample. This transformation was calculated using data from the training set only. When transforming an entry from the testing set, we check which risk-level had been assigned to that category in the training. Had such a category not been assigned a risk-level before (e.g. a country where no order from the training set was shipped to), the risk-level is set to the intermediate level 2.
5.1.4 Engineered variables
In order to get more significant variables to train the models with, we engineered new variables through abstraction and combination of variables.
The first engineered variables were created to represent the degree of similarity between certain pairs of categorical variables. We created a binary function which generated a new feature with the value of 1 in case of a match and 0 in case of no match. This function was applied to the pairs of variables {(billing country, shipping country), (billing country, card country), (shipping country, card country)}. These were all predefined country fields, which ensured the match could be done by a simple comparison of strings.
On the other hand, the variables referring to names (e.g. name on card, user name) would often not match because the names were spelled in different order. Hence, we used another function which calculates the similarity between two names. This function is based on n-gram similarity and its output is a continuous number in [0,1]. It was applied to the pairs of variables {(UserName, CardName), (billing city, shipping city), (billing zip-code, shipping zip-code)}.
A function which confirms that the customer has entered a valid telephone number was also created, by checking whether the input of the user is a number.
Lastly, a function summarizing the customer’s recent buying behaviour was created. This function counts the number of orders by this customer in the ten days prior to the current purchase. The complete list of variables which were used in training can be seen in Table A.1.
5.1.5 Imputing missing values
In order to get the best performance of the machine learning algorithms, the data must be clean and complete. As was seen in section 4.2, there were missing values in the data set. We chose to complete these data entries by imputing a value in the missing variables, as suggested by Miner et al. [2009].
In the case of categorical variables, a missing value would correspond to a zero in each of the corresponding columns after the one-hot-encoding transformation. Hence, no further action was required.
In the case of numerical variables, the missing value was replaced by the mean of the sample. As an example, a missing value for OrderValue would be substituted
![Figure 1.1: Diagram of online payments steps. Source: Montague [2010]](https://thumb-eu.123doks.com/thumbv2/123dok_br/18235992.878438/17.892.317.613.146.397/figure-diagram-online-payments-steps-source-montague.webp)
![Figure 1.2: CRISP-DM reference model phases. Source: Chapman et al. [2000]](https://thumb-eu.123doks.com/thumbv2/123dok_br/18235992.878438/18.892.227.617.158.517/figure-crisp-dm-reference-model-phases-source-chapman.webp)