A Work Project, presented as part of the requirements for the Award of a Master’s Degree in Economics from NOVA – School of Business and Economics
ANALYSIS OF THE AUSTRALIAN SOCIAL AND AFFORDABLE HOUSING MARKET FROM THE PERSPECTIVE OF AN INSTITUTIONAL INVESTOR
Consulting report for National Australia Bank
JULIA MARISSA FUECHSL, 724
A Project carried out on the CEMS6011 course of the University of Sydney Business School, under the supervision of:
Megan Davis
2
I. Abstract
There is a lack of investment in the Australian social and affordable housing market. To address this issue, the government proposed four potential financial models. The business project, conducted in partnership with National Australia Bank (NAB), aimed to provide NAB with insights into the social and affordable housing sector. Furthermore, it used the four financial models to assess the potential attractiveness of this sector. The recommendations focus on possible actions NAB may take. The business project is extended by a literature review of ethnic residential segregation and policies that aim to reduce the negative effects of segregation.
Keywords:
Social and affordable housing
National Australia Bank
Governmental policies Residential segregation
3
Table of Contents
II. TABLE OF FIGURES ... 4
III. ABBREVIATIONS... 5
IV. DEFINITIONS... 5
1. BRIEF CONTEXT ... 6
1.1. Introduction of the client ... 6
1.2. The banking sector situation in general and in Australia ... 6
1.3. The current client situation ... 7
1.4. The social and affordable housing market ... 8
1.5. The business project goal ... 9
2. REFLECTION ON THE BUSINESS PROJECT AND INDIVIDUAL CONTRIBUTION ... 9
2.1. Situation in the social and affordable housing market ... 9
2.2. Four financial models proposed by the government ... 15
2.3. Conclusion and recommendations ... 20
2.4. Shortcomings of the report ... 22
2.5. Individual contribution ... 23
3. ACADEMIC DISCUSSION... 24
3.1. Reasons and effects of segregation ... 24
3.2. Governmental policies... 26
3.3. Research gap ... 27
4. PERSONAL REFLECTION... 28
4.1. Emergence of personal characteristics ... 28
4.2. My role in the team and my contribution to the team ... 29
4.3. Areas of personal improvement ... 30
V. APPENDIX ... 31
4
II. Table of Figures
FIGURE 1:THE MECHANISM OF SOCIAL IMPACT BONDS... 16 FIGURE 2:THE MECHANISM OF THE HOUSING TRUST ... 18 FIGURE 3:THE MECHANISM OF THE BOND/LOAN AGGREGATOR MODEL ... 19
5
III. Abbreviations
AHURI Australian Housing and Urban Research Institute CFFR Council of Federal Financial Relations
CHPs Community housing providers
CSR Corporate Social Responsibility
LIHTC Low Income Housing Tax Credit
NAB National Australia Bank
NSW New South Wales (a state in Australia)
SAH Social and affordable housing
$ Australian Dollar
IV. Definitions
Social and affordable housing:
Affordable Housing:
‘Housing that is appropriate for the needs of a range of very low to moderate income households and priced so that these households are also able to meet other basic living costs such as food, clothing, transport, medical care and education. As a rule of thumb, housing is usually considered affordable if it costs less than 30 percent of gross household income.’
Social Housing:
‘Housing that is provided for people on low incomes or with particular needs by government agencies or non-profit organizations.’
6
1. Brief context
1.1. Introduction of the client
National Australia Bank (NAB) is one of the four largest financial institutions in Australia1. With approximately 42,000 employees and 560,000 shareholders, it primarily operates in the Australian and New Zealand market and services over 12mil customers. Their competencies range from private to business banking, including offerings to micro, small-/ medium enterprises as well as global institutions2. NAB’s main competitors are Commonwealth Bank (CBA), Australia and New Zealand Banking Group (ANZ) and Westpac Banking Corporation (WBC). NAB positions itself as the largest within the banking sector in terms of its total assets (in 2015 = $955,052mil). However, out of the four big banks, it is ranked last in terms of market capitalization (02/2016 = $65,288mil).3
1.2. The banking sector situation in general and in Australia
Due to the recent financial crisis, it can be assumed that globally the banking sector struggles with a negative image in society. Jean Rogers, the Executive Director of the Sustainability Accounting Standards Board, reflected this sentiment by saying ‘banks and financial sectors are the institutions least trusted by the U.S. society’4. There is good reason that this statement may be generalized for more developing markets since Ana Botín, the Executive Chairman of Santander
1 Gable, Michael. 2015. “Where to for the big four?” ASX, August. http://www.asx.com.au/education/investor-update-newsletter/201508-where-to-for-the-big-four.htm.
2 NAB. 2015. Annual Financial Report 2015, National Australia Bank.
https://www.nab.com.au/content/dam/nabrwd/About-Us/shareholder%20centre/documents/annual-financial-report-2015.pdf (accessed June 15, 2016).
3 A more detailed comparison of the banks’ key figures can be found in Appendix 1.
4 Eccles, Robert G., and George Serafeim. 2013. “Sustainability in financial services is not about being green.”
Harvard Business Review, May 15.
7 Group and one of the most powerful female bankers in the world5 also raised the point that banks have to undergo a cultural change and put more focus on private customers6, thus the society. In order to positively boost brand image, banks have begun undertaking more social operations by looking into social asset classes. This includes social impact investments, which combine a positive social impact with diversification towards lower, but less risky returns. Diversification is especially important for the Australian big four banks. Analyzing the banks’ balance sheets, at least 50% of the banks’ total assets are estimated to be loans and 50% of the gross loans are for the domestic residential and commercial housing market7. Over the last decade, the Australian housing market has experienced a high price growth and banks have been excessively distributing home loans8. Thus, the banks’ health and financial stability strongly depends on their volatile housing mortgage portfolios and relies on the continuous increase in residential and commercial housing prices. However, it is unlikely that the housing market will continue to grow indefinitely9.
1.3. The current client situation
NAB has currently shown great interest in entering the market for social and affordable housing as an investor (in debt and/or equity)10 in order to broaden its portfolio, to react to the social
5 Fry, Erika. 2014. “Meet the NEW most powerful woman in banking.” Fortune, September 11. http://fortune.com/2014/09/11/the-most-powerful-woman-in-banking/.
6 Neumann, Jeannette. 2015. “Banco Santander Chief Ana Botín rethinks father’s legacy.” The Wall Street Journal, June 10. http://www.wsj.com/articles/banco-santander-chief-ana-botin-rethinks-fathers-legacy-1433989803. 7 View Appendix 1.
8 ABS. 2015. Feature article: The Australian residential property market, catalogue no. 6416.0, Australian Bureau of
Statistics. http://www.abs.gov.au/ausstats/abs@.nsf/Lookup/6416.0Feature+Article1Sep%202015 (accessed April
18, 2016).
9 McKenna, Greg. 2016. “Satyajit Das: Australian banking is more vulnerable than people realise.” Business Insider
Australia, May 30.
http://www.businessinsider.com.au/satyajit-das-says-australian-banking-is-more-vulnerable-than-people-realise-2016-5.
10 NAB. 2016a. Response to Issues Paper, January 2016, National Australia Bank, Melbourne.
8 pressure to improve the affordability of housing and to follow its vision in becoming the most respected bank in Australia and New Zealand2. Thus, the market entry goal is to diversify its portfolio and to improve its risk-return profile while profiting from the side effect of a more positive image. NAB currently runs early stage assessments of the social and affordable housing (SAH) market with an unspecified scope of timing and size of potential investment.
1.4. The social and affordable housing market
Governmental studies show a significant undersupply of SAH in Australia. Its data from January 2016 indicate that around 975,000 low-income households face rental and mortgage housing stress and spend more than 30% of their income on housing costs. Additional 187,500 households are registered on the public and community housing waiting lists11. This significant undersupply warrants government action as well as engagement from the private sector, such as institutional investors.
Institutional investors could help to overcome the undersupply, however, a market entry by institutional investors seems unattractive due to several existing market barriers like the yield gap or lack of scale12. To diminish these sub-market characteristics, an Affordable Housing Working Group was established by the Council of Federal Financial Relations (CFFR) to raise the discussion about possible improvement strategies in the SAH sector. The Working Group released an issue paper in January 2016 proposing four innovative financial models that aim to
ordable%20Housing%20Working%20Group/Submissions/PDF/National_Australia_Bank.ashx (accessed May 20, 2016).
11 CFFR. 2016. Affordable Housing Working Group: Issues paper, Council on Federal Financial Relations, Canberra.
http://www.treasury.gov.au/~/media/Treasury/Consultations%20and%20Reviews/Consultations/2016/CFFR%20Aff ordable%20Housing%20Working%20Group/Key%20Documents/PDF/Issues_Paper.ashx (accessed April 15, 2016). 12 AHURI. 2016a. Attracting large institutional investors for affordable housing developments. Australian Housing and Urban Research Institute (AHURI), Melbourne. https://www.ahuri.edu.au/policy-development/institutional-investment (accessed May 20, 2016).
9 increase institutional investment as well as maximize the effectiveness of government expenditure. Four financial models were proposed: the housing cooperatives, the social impact bond, the housing trust and the bond/loan aggregator model11. In response, 77 stakeholders, including NAB, submitted their feedback and provided new suggestions with nine submissions labeled as confidential13.
1.5. The business project goal
The aim of the business project was to provide insights into the SAH markets and the four proposed financial models to then identify the attractiveness of the SAH sector for NAB. In the first part of the business project, the team conducted an analysis of Australia’s SAH sector and the interest and involvement of the major stakeholders. The second part of the business project entailed an evaluation of the four financial models proposed by the government. In order to unveil implications for NAB, the team analyzed advantages and disadvantages and the financial models’ capabilities to overcome major market entry barriers. The business project concluded by recommending NAB various possible courses of action.
2. Reflection on the business project and individual contribution
2.1. Situation in the social and affordable housing market
In the following part, the supply and demand gap in the SAH sector will be highlighted. While the market experiences a lack of investment, the sector does present attractive opportunities for institutional investors. It may be assumed that investors primarily invest in the SAH market as a matter of CSR. The situation and the prevailing reasons are outlined.
13 Treasury. 2016. Council on Federal Financial Relations Affordable Housing Working Group – Innovative financing models- Submissions. http://www.treasury.gov.au/ConsultationsandReviews/Consultations/2016/CFFR-Affordable-Housing-Working-Group/Submissions (accessed May 20, 2016).
10
2.1.1. Supply and demand gap in the social and affordable housing market
Over the recent decade (2005-2015) Australian rental and property prices have increased by 55% and 62% respectively8. The corresponding price pressure in the housing market led to a decrease in national housing affordability that has strongly affected low- and medium income households.
Several factors from the demand and supply side indicate the reasons for the existing price pressure14,15. The increase in demand for housing was accelerated by a growing and ageing population, where the population is concentrated in a few large cities as well as increasing levels of overseas migration and foreign investment. In contrary, the supply is suppressed by the contract building system, the shortfall of land, imposed taxes on new housing and delays in providing supporting infrastructure. Therefore, the supply is not able to keep pace with the underlying demand of housing that currently lacks 187,500 dwellings in the SAH sector. Assuming that socioeconomic and demographic trends persist, the lack of SAH is expected to increase to 663,000 dwellings by 203116.
To estimate the potential size of investment needed in the SAH sector, the Social Housing Initiative, which built 19,700 new social housing dwellings in 2012, was used as a benchmark.
14 Lawson, Julie., Vivienne Milligan, and Judith Yates. 2012. “Housing supply bonds – a suitable instrument to channel investment towards affordable housing in Australia?” Australian Housing and Urban Research Institute
(AHURI), May.
https://www.ahuri.edu.au/__data/assets/pdf_file/0027/1998/AHURI_Final_Report_No188_Housing_Supply_Bonds-a_suitable_instrument_to_channel_investment_towards_affordable_housing_in_Australia.pdf.
15 ERC. 2015. “Out of reach? The Australian housing affordability challenge.” Parliament of Australia, Canberra, May.
http://www.aph.gov.au/Parliamentary_Business/Committees/Senate/Economics/Affordable_housing_2013/~/media/ Committees/economics_ctte/Affordable_housing_2013/report.pdf.
16 NHSC. 2012. “Housing supply and affordability – key indicators, 2012.” National Housing Supply Council, 2012. http://www.treasury.gov.au/~/media/Treasury/Publications%20and%20Media/Publications/2012/NHSC/Downloads/ PDF/housing_supply_affordability_report.ashx.
11 Taking the average cost per dwelling of $265,672 (in $2013)17 as a reference, we concluded that over $50bn of new investments are needed to close the existing supply and demand gap of 187,500 dwellings. However, the potential investment scale can be expected to be even greater since the maintenance and renewal costs of existing SAH (approximately 400,000 dwellings) were not incorporated18.
2.1.2. Undersupply of private investment via institutional investors
Despite the potential size of the market for institutional investors, there are several barriers that make investing in the SAH sector unattractive. The major entry barriers are related to market uncertainty driven by government actions and the inefficient supply of housing by community housing providers. This relates to further barriers, such as the yield gap, a lack of credit rating and scale.
The government plays a key role in the market as a funding party, a policy maker and an implementer and thus, is one of the major stakeholders from the perspective of NAB19. The government’s commitment to the SAH market, however, has not been consistent. The market has been affected by shifting policies and support from the supply side to the demand side20, a lack of support for large-scale attempts of private investment and a continuous reduction in governmental subsidies21. Altogether, this has not only increased the gap between supply and demand, but also increased the uncertainty in the market, which is not perceived well by
17 Social Housing Initiative, 2013. Fact Sheet.
https://www.dss.gov.au/sites/default/.../social_housing_initiative_fact_sheet.pdf.docx (accessed April 26, 2016). 18 Shelter WA. 2014. Housing Australia fact sheet: A quick guide to housing facts and figures.
http://www.shelter.org.au/index.php?option=com_docman&task=doc_view&gid=30&Itemid=127 (accessed April 17, 2016).
19 For a detailed overview, please refer to Appendix 2
20 Hooker, L. Janusy. 2014. “Australia’s essential housing crisis: Collaborative solutions involving institutional capital & public private partnerships.” March 25. http://www.aph.gov.au/DocumentStore.ashx?id=43a53e07-3a52-4be7-b7c9-00dfa014d47d&subId=206044.
12 investors. Investors cannot be certain that current government plans will be translated into future action due to shifts in governing parties, for instance22. In order to attract institutional investors, the SAH sector needs long-term commitment from the government which would help reduce further existing barriers.
From NAB’s perspective, besides the government, community housing providers (CHPs) also play a key role. CHPs have the duty to provide living options for low- and moderate income households across Australia. There are currently over 200 CHPs operating in Australia with 77 CHPs managing 32,500 tenancies in the state of New South Wales (NSW)23. In NSW, they have a capital base of $3bn and bank debt of $200mil in new SAH23. The CHP market is challenged by two factors which causes institutional investors to be reluctant to invest in the SAH market. Firstly, the CHP market is very fragmented which entails low level economies of scale, ineffective expenditure management practices and a lack of monitoring and control24. Thus, CHPs are generally unable to yield a competitive return. Secondly, the fragmentation of the CHP market and insufficient assessment frameworks do not allow investors to adequately credit rate CHPs. Taking international standards for credit rating as a reference, only four CHPs would be large enough and thus, be eligible for Moody’s rating criteria10. The lack of credit rating and the inefficiency and ineffectiveness of CHPs lead to a lack of investment. In order to attract large-scale investment to cover the SAH demand, structural reforms within the CHP market are
22 AEC. 2016. 2016 federal election timetable. http://www.aec.gov.au/election/timetable.htm (accessed May 20, 2016).
23 Hayhurst, Wendy. 2016. “Increasing affordable housing – How community housing providers in NSW could deliver more.” NSW Federation of Housing Associations, Sydney, March.
http://www.treasury.gov.au/~/media/Treasury/Consultations and Reviews/Consultations/2016/CFFR Affordable Housing Working Group/Submissions/PDF/NSW_Federation_of_Housing_Associations.ashx.
24 AHURI. 2016b. “Assessing management costs and tenant outcomes in social housing.” Australian Housing and
Urban Research Institute (AHURI), Melbourne, January.
http://www.ahuri.edu.au/__data/assets/pdf_file/0028/5797/AHURI_RAP_Issue_206_Assessing_management_costs_ and_tenant_outcomes_in_social_housing.pdf.
13 needed. It is assumed that long-term government commitment and long-term investments by institutional investors would cause the CHPs to become more professional.
Apart from the investors’ general limited awareness of the asset class and certain financial models which complicates investors’ decision making10, the following market entry barriers were identified by NAB and other stakeholders:
lack of scale: investors are required to search for their suitable ‘at-scale’ project, which is costly and not always available;
low risk-adjusted returns and the yield gap: the yield provided by the market is unable to meet the expectations of investors and to cover the risks.
Overall, the uncertainty and characteristics of the SAH market do not present a basis for large-scale investment into the market. However, there are institutional investors involved in the market, but they have different goals other than achieving sustainable returns.
2.1.3. Current investment in the sector SAH aligned with social impact goals
Investors may not generally consider the SAH market a viable asset class capable of competing against existing asset classes. The reason institutional investors currently invest in the market may be due to corporate social responsibility (CSR) goals. Out of NAB’s three biggest competitors, Westpac Banking Corporation is the only bank actively involved in the SAH sector25,26. Westpac has committed to invest $2bn by 2017; representing 0.36% of their five-year
25 Johanson, Simon. 2011. “Two big banks shun low-income housing.” Sydney Morning Herald, September 19. http://www.smh.com.au/business/property/two-big-banks-shun-lowincome-housing-20110918-1kfu3.html. 26 For an overview of Westpac’s involvement, please refer to Appendix 7.
14 average loans of $550bn27,28. It may be assumed that Westpac does not consider their engagement as a ‘classical’ commercial banking practice rather as a CSR tool. Their involvement in the SAH sector is not only promoted in their 2013-2017 Sustainability strategy paper, but also via their company vision, which includes helping individuals gain SAH access27.
The second biggest category of investors competing with NAB, representing an important source of investment for the SAH market29, are superannuation funds. The main funds HESTA, AustralianSuper and Hostplus have invested $6.7mil, $1bn and $400mil respectively30. Their investment is driven by the opportunity to diversify their portfolio31 and to follow their mandate of support their clients once they have retired32. Since the clients’ funds are not accessible until retirement, superfunds are able to follow long-term investment strategies with steady, yet lower returns.
Given the estimated conservative investment potential of $50bn and the investment commitment by Westpac and superannuation funds, it is apparent that the SAH market leaves room for more investors, such as NAB, to enter the market.
27 Westpac. 2013a. 2013-2017 Sustainability strategy. https://www.westpac.com.au/docs/pdf/aw/sustainability-community/2013-2017_Sustainability_Strategy.pdf (accessed May 23, 2016).
28 Westpac. 2015. 2015 Annual report. http://www.westpac.com.au/docs/pdf/aw/ic/2015_WBC_Annual_Report.pdf (accessed May 23, 2016).
29 Wu, Kevin. 2016. IBISWorld Industry Report K6330 Superannuation funds in Australia, IBISWorld (accessed May 12, 2016).
30 Cranston, Matthew. 2016. “Super fund HESTA invests in Queensland social housing.” Australian Financial
Review, January 13.
http://www.afr.com/real-estate/superfund-hesta-invests-in-queensland-social-housing-20160112-gm4o18.
31 Milligan, Vivienne, Hal Pawson, Peter Williams, and Judith Yates. 2015. “Next moves? Expanding affordable rental housing in Australia through institutional investment.” University of New South Wales, Sydney, March. https://cityfutures.be.unsw.edu.au/documents/81/Next_moves_report.pdf.
32 ISA. 2016. “Options for unlocking institutional investment in affordable housing.” Industry Super Australia, March.
http://www.treasury.gov.au/~/media/Treasury/Consultations%20and%20Reviews/Consultations/2016/CFFR%20Aff ordable%20Housing%20Working%20Group/Submissions/PDF/Industry_Super_Australia.ashx.
15
2.2. Four financial models proposed by the government
In order to attract large-scale institutional investment, the Affordable Housing Working Group has proposed four financial models that aim to overcome existing market entry barriers and increase the effectiveness of government expenditure. To assess the financial models’ attractiveness from NAB’s perspective, the hypothesis was tested as to what extent the financial models were capable of overcoming the aforementioned entry barriers. The team analyzed each model’s advantages and disadvantages and drew implications from it. The analysis is based on the assumption that each model will be adequately supported by the government.
2.2.1. Methodology
To reach our conclusions, the methodology of the project is primarily based on secondary research. Based on the qualitative analysis of credible sources, such as the 68 publicly available submissions from interested stakeholders, research papers and relevant web documents, the team followed the approach of synthesizing, extracting and structuring relevant information33. Additionally, to prove certain assumptions and to gather further information, the team directly contacted and interviewed an Australian investment advisor and specialists from Westpac Banking Corporation and the Housing Action Network.
2.2.2. Analysis of the four financial models
Housing cooperatives model
Housing cooperatives are mostly community based and non-for-profit associations that provide housing for their members, who usually hold ownership and control rights. This model has the characteristics of a delivery model rather than a financing model that is capable of attracting
33 Mayring, Philipp. 2010. Qualitative Inhaltsanalyse: Grundlagen und Techniken, 11th ed., Beltz Verlag, Weinheim and Basel.
16 large-scale institutional investment. Therefore, the housing cooperatives model seems unattractive for NAB. However, it is perceived to be more efficient in delivering SAH than other models described below as it reduces welfare dependency34 and costs of management35. To allow the SAH sector to profit from these efficiencies, it may be beneficial to introduce the housing cooperatives as a potential delivery model under the financing model that will be established in the future.36
Social impact bond model
The social impact bond model is a new and innovative social impact investing product that first was launched in the UK in 201037. The cooperation of private investors, public authorities and social service providers aim to achieve a certain social impact on society.
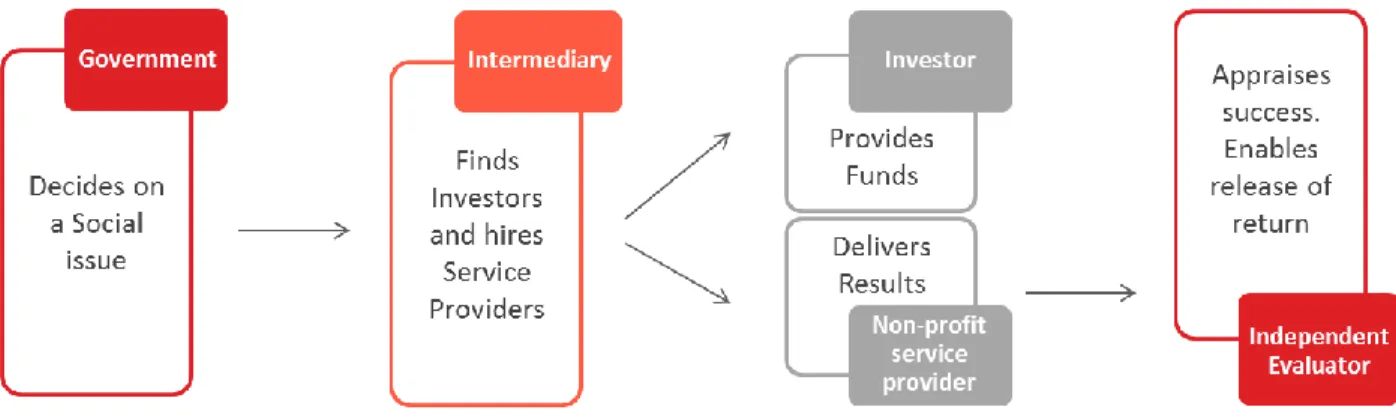
Figure 1: The mechanism of social impact bonds
Source: own elaboration based on Hughes and Scherer 2014 and Arosio 2011.
While social service providers are responsible for delivering social results, the investors provide the funding for the project. In the case that the agreed social targets are successfully met, the
34 Sousa, Jorge, and Jack Quarter. 2004. “Converting a public housing project into a tenant-managed housing co-operative: A Canadian case study.” Journal of Housing and the Built Environment, 19 (2): 187-198.
35 Anderson, George. D. 1992. “Housing policy in Canada” lecture series, Centre for Human Settlements, University of British Columbia for Canada Mortgage and Housing Corporation, Vancouver.
36 For more detailed information on the model, please refer to Appendix 8.
37 NSW Government. 2011. “Social Impact Bond Pilot.” The center for social impact, February.
17 government repays the investors their principal at a certain interest rate depending on the level of success38. Therefore, the investors bare the risk of default and inefficiency in delivering the specific social impact. Due to the fragmentation of the CHP sector, the ability of effective and efficient delivery may be questionable in the SAH market. In addition, assessment of the CHPs by investors is time-consuming due to their lack of credit rating. This and the fact that the social impact bonds must be held until maturity39, lowering the liquidity in the market, display a greater risk than the expected return may cover. Taking the Rough Sleepers £5mil Bond in the UK as an example, investors were required to wait three years to achieve a 6.5% return p.a. but only in the case that the social targets were met40. The results of this bond are not yet published.
Overall, the social impact bond model is a niche product, because it is not capable of overcoming the major barriers and does not have a significant impact on the housing supply. For NAB, investing in social impact bonds may be a CSR activity, but it is generally too costly and time-intensive given the scale, the risk profile and the potential return.41
Housing trust model
The housing trust aggregates housing assets at state/national level and thus, attracts large-scale institutional investment. It enables a total capital solution, since investors are able to invest in the trust either with debt and/or equity or even purchase housing units11.
38 Hughes Jane, and Jill Scherer. 2014. “Foundations for social impact bonds.” Social Finance, 2014. http://www.payforsuccess.org/sites/default/files/social_finance_white_paper_2014.pdf.
39 SVA. 2015. “Is your program suitable for a social impact bond.” Social Ventures Australia, June 8. http://www.socialventures.com.au/sva-quarterly/is-your-program-suitable-for-a-social-impact-bond/. 40 Department for Communities and local Government. 2015. “Qualitative evaluation of the London homelessness social impact bond - Second interim report.” OGL, March.
https://www.gov.uk/government/uploads/system/uploads/attachment_data/file/414787/Qualitative_evaluation_of_the _London_homelessness_SIB.pdf.
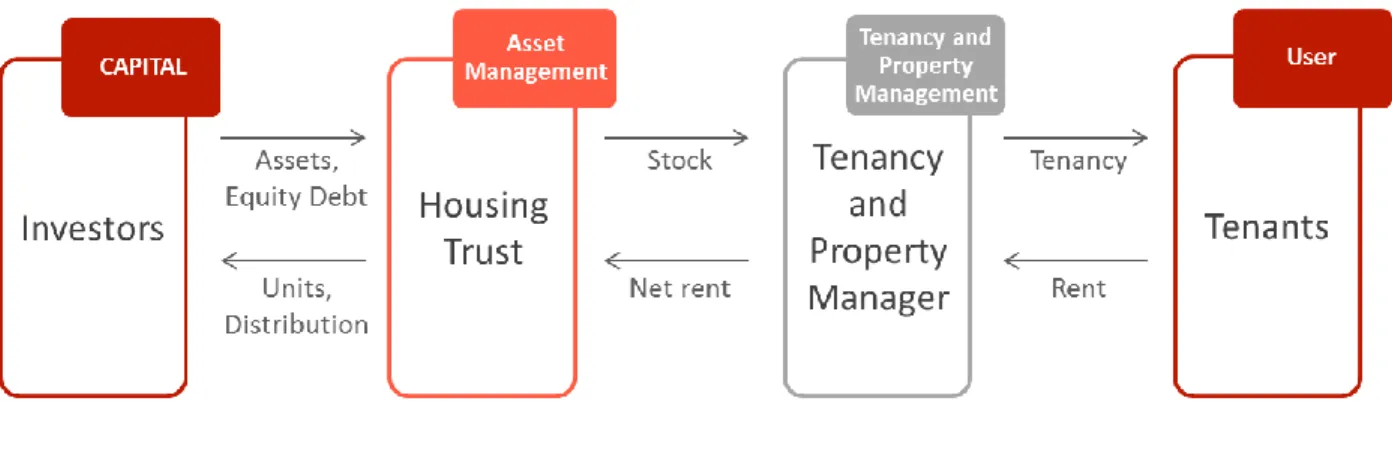
18 Figure 2: The mechanism of the Housing trust
Source: CFFR 2016.
CHPs are the members of the trust and transfer housing stock to the trust. Specialized tenancy and property managers manage the operations and thus, hold responsibility to yield returns for the trust. Due to management being outsourced, it may be assumed that the housing trust increases efficiencies in the CHP operations. Furthermore, the aggregation of stock allows better liquidity and portfolio diversification. However, there is a general concern that the model is not capable of overcoming barriers, such as risk-adjusted returns and scale, which makes this aggregator model inferior to the bond/loan aggregator model described below. In case the housing trust reaches a AAA credit rating due to full guarantees made by the government, investing in the trust would be attractive since it may yield a higher return of around 4% compared to ‘classical’ government bonds with the same risk profile42.43
42 RBA. 2016. Chart pack – Interest rates Reserve Bank of Australia, Sydney. http://www.rba.gov.au/chart-pack/interest-rates.html (accessed May 13, 2016).
19
Bond/loan aggregator model
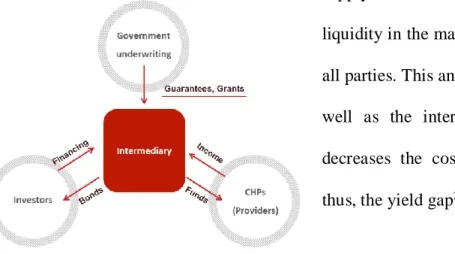
The Bond/loan aggregator is a model that aggregates debt financing and additionally allows housing providers to aggregate and combine financial needs via a specially established intermediary11. The intermediary, which exchanges bonds for financing, pools together both Figure 3: The mechanism of the Bond/loan aggregator model
supply and demand and thus, enables scaling and liquidity in the market and makes it accessible for all parties. This and the fact that both the bonds as well as the intermediary may be credit rated decreases the cost of capital for investors and thus, the yield gap23,44.
Source: own elaboration based on Hayhurst 2016.
Since investors may invest in more secure housing cash-flows at scale rather than equity, this leaves CHPs dependent on existing growth mechanisms such as stock transfers or subsidies10. This implies that contrary to the housing trust, the bond/loan aggregator model does not incentivize the CHP sector to become more efficient. Thus, from the supply side perspective, this model does not encourage decreasing the yield gap.
Overall, the model is perceived to be less resource consuming and more capable of attracting institutional investment since barriers such as scale, yield gap and lack of credit rating may be
44 Nutting, Mark. 2016. “Response to the Affordable Housing Working Group Issues Paper.” Housing Consultant, March 11.
http://www.treasury.gov.au/~/media/Treasury/Consultations%20and%20Reviews/Consultations/2016/CFFR%20Aff ordable%20Housing%20Working%20Group/Submissions/PDF/Nutting_Mark.ashx.
20 overcome. Investing in SAH bonds would be a ‘classical’ financial instrument with clear regulations familiar to NAB. In comparison to the other models described above, NAB would profit from a shorter decision making process of investing in the market.45
2.3. Conclusion and recommendations
Based on our research, we concluded that out of the four models proposed by the government, the bond/loan aggregator model is the model most capable of overcoming the major market entry barriers, such as the yield gap, the scale and credit rating and is most attractive for large-scale institutional investors. However, choosing the right financial model is only part of the equation to promote supply in the SAH sector. Research highlights that long-term and consistent government commitment and a higher efficiency level of the CHP market are the most important factors in determining the supply of investment to the SAH sector.
Drawing on the importance of long-term and consistent government policies, two illustrative examples from the US and the Netherlands support this conclusion. Firstly, the US established the Low Income Housing Tax Credit (LIHTC) model46 in 1987 that has evolved to become the prevailing model for developing social housing in the US47. After the Congress made the LIHTC a permanent law in 1993, robust investment flowed into the housing market leading to the development of 2.6mil low income housing units by 201348,49. Secondly, the Netherlands managed to eliminate homelessness through developing SAH, which constitutes around 30% of the national housing stock. Instead of the government covering the total supply costs, it has only
45 For more detailed information on the model, please refer to Appendix 11. 46 For more detailed information on the model, please refer to Appendix 12.
47 Nolden, Sandra, Clarissa Climaco, and Meryl Finkel. 2000. Updating the Low Income Housing Tax Credit (LIHTC) Database, Final Report, Abt Associates Inc., Cambridge, MA.
48 2016, pers. comm, 24 May
49 HUD User. 2015. Low-Income Housing Tax Credits, U.S. Department of Housing and Urban Development, Washington DC. https://www.huduser.gov/portal/datasets/lihtc.html (accessed May 13, 2016).
21 provided a 100% guarantee to private investors against the default of borrowers, e.g. CHPs. The SAH sector profited from extreme influx of funds and managed to reach a default rate of zero for its loans20.
We concluded that investing in the SAH sector results in many uncertainties for institutional investors, such as NAB. However, there are several proposed courses of action that NAB may follow until further development occurs in this sector:
Engage in industry discussions: there are currently ongoing government-led discussions to encourage stakeholders to explore possible courses of action to increase the sector’s supply. It is recommended that NAB should actively participate in industry discussions, such as roundtable discussions and lobbying, to reach a desirable outcome.
Evaluate and participate the current government initiative: there are currently governmental backed initiatives, such as the Social and Affordable Housing Fund in NSW50, that provide possibilities for NAB to acquire knowledge and expertise about the market in a low-risk environment.
Explore the potential of being an intermediary by issuing a bond in the SAH sector: drawing on NAB’s expertise of being an intermediary in impact bonds, e.g. NAB’s climate bond51, a possible avenue for NAB may be to act as an intermediary and cooperate with CHPs to build a ‘Social Housing Bond’. NAB’s role would be to launch the bond and help CHPs to find potential investors.
50 FACS. 2016. Social and Affordable Housing Fund, Department of Family and Community Services, NSW Government, Sydney. http://www.facs.nsw.gov.au/reforms/social-housing/SAHF (accessed May 20, 2016). 51 NAB. 2016b. Impact investment, National Australia Bank, Melbourne.
http://www.nab.com.au/about-us/corporate-responsibility/our-programs-and-initiatives/social-and-financial-inclusion/impact-investment (accessed May 20, 2016).
22 Create an internal credit rating framework: it might be in NAB’s best interest to create an internal credit framework to assess potential borrowers, e.g. CHPs. Since credit ratings are currently lacking, NAB might profit from the first-mover advantages in the future.
Scope for future research: until the government gives clear indication of which model will be chosen, NAB might further evolve its understanding about the markets and financial models proposed in the interim period. NAB might draw on the report as a basis to undertake further a nd deeper research.
2.4. Shortcomings of the report
The methodology of this report and subsequently the recommendations provided entail limitations. Firstly, using secondary research only, the report lacked the practical part of financial modelling that might have provided clearer indications, e.g. the risk/return profile of the four financial models. Since deep financial analysis is missing, the team was not able to include recommendations on whether to enter the market or not and on which entry mode is most recommended. Thus, the team was only able to analyze the stakeholders’ tendencies towards certain models and through this provide an understanding of which model might be the most capable of overcoming entry barriers, making it the most attractive model from an investor’s perspective. Furthermore, the analysis neither incorporated CSR strategies nor macroeconomic uncertainties, such as the evolvement and stability of the Australian housing market in general52. Moreover, the recommendations are based on the assumption that NAB keeps its strategies and interest in entering the SAH market regardless of the challenges encountered.
52 Chung, Frank. 2015. “Will housing bubble pop in 2017?” news.com.au, May 22. http://www.news.com.au/finance/real-estate/buying/will-housing-bubble-pop-in-2017/news-story/4fe05fed1c277a096df33242a26caf6c.
23
2.5. Individual contribution
The business project can be categorized as a research project since it missed a practical part and relevant company insights. Thus, the team found itself reorganizing and summarizing publicly available information. The major part of the qualitative analysis were the 68 submissions that provided feedback on the issue paper of the Affordable Housing Working Group. I was extracting information from 15 randomly selected submissions and developed the input table to structure the data that allowed us to draw comparisons. After the team synthesized the key findings of all 68 submissions, we worked to acquire further knowledge about the four financial models and the SAH market. I was responsible for the social impact bond model which incorporated developing a deep understanding of its advantages, disadvantages and the potential implications for NAB. Referring to national and overseas examples was part of this role. In addition, I was co-responsible for analyzing the current involvement of institutional investors in the SAH sector to draw conclusions in regards to the competitive landscape for NAB.
Since the team dealt with information sourced from many different credible sources, it was important to keep the bigger picture in order to submit a cohesive and clear message. Thus, I was actively involved in prioritizing the models according to which NAB might find the most attractive. Furthermore, I assisted in defining the major entry barriers for such large-scale investment. This allowed me to not only write the introduction sections, but also to co-write the overall implications of the four models, recommendations and conclu sion. Furthermore, in regards to the presentation of the business project, I was responsible for the storyline and the logical flow of all slides, which allowed me to keep the presentation master file and to co-work on the layout.
24
3. Academic Discussion
When deciding on policies to reduce the supply and demand gap in the SAH sector, governmental policies may also take possible effects of residential segregation into consideration. Residential segregation is defined as ‘uneven residential distributions of individuals or households’53 and is a phenomenon that is persistent around the world. While the issue is less pronounced in Australia54, it is more tangible in selected European countries, such as France55 or the UK56 and prevails in the US57.
3.1. Reasons and effects of segregation
Segregation is not only driven by historical incidences, such as the discrimination of migrants (e.g. African Americans in the US) being restricted to live in certain areas only57.There is an ongoing academic debate about the impact of various dimensions that may cause segregation. The different perspectives include the discrimination in the housing market58, historical and current governmental policies, economic factors57 and personal preferences59. In fact, research shows that historical racial segregation is the predominant driver of separation by income level60. Thus, the crowding out effect of lower-income households from metropolitan cities to the
53 Clapham, David F., William A.V. Clark, and Kenneth Gibb. 2012. The SAGE Handbook of housing studies. London: SAGE Publications.
54 Johnston, Ron, Michael Poulsen, and James Forrest. 2007. “The geography of ethnic residential segregation: A comparative study of five countries.” Annals of the Association of American Geographers, 97 (4): 713-738.
55 Préteceille, Edmond. 2007. “Is gentrification a useful paradigm to analyse social changes in Paris metropolis?”
Environment and Planning A, 39: 10-31.
56 Musterd, Sako. 2011. “The impact of immigrants’ segregation on social integration in selected European contexts.” Documents d’Anàlisi Geogràfica, 57 (3): 359-380.
57 Turner, Margery A. and Karina Fortuny. 2009. “Residential segregation of low-income working families.” The
Urban Institute Paper 10.
58 Musterd, Sako. 2005. “Social and ethnic segregation in Europe: Levels, causes, and effects.” Journal of Urban
Affairs, 27 (3): 331-348.
59 Clark, William A.V. 2009. “Changing residential preferences across income, education, and age: Findings from a multi-city study of urban inequality.” Urban Affairs Review, 44 (3): 334-355.
60 Massey, Douglas S. 2001. “Residential Segregation and Neighborhood Conditions in U.S. Metropolitan Areas.” In America becoming: Racial Trends and Their Consequences, ed. Smelser, Neil J., William J. Wilson, and Faith Mitchell, 391–434. Washington, DC: National Academy Press.
25 suburbs as a result of rising real house prices61 not only causes a concentration of poverty62, but also of foreign migrants63.
There is academic consensus that ethnic residential segregation impacts the residents living in the enclaves and society. However, the discussion about the direction of impact either being positive or negative is still ongoing. Academic disunity regarding this topic exists for two main reasons. Firstly, there are challenges related to the methodology and to the high demand for sufficient data quality to discard bias53. Secondly, empirical results regarding the effects of segregation have revealed high dependencies on the quality of the existing national welfare system64 and the degree of urban ethnic diversity54. Additionally, the function of neighborhood interactions affecting the so called neighborhood effects also play a role in defining the impact of segregation on the residents and society65.
While ethnic residential segregation may promote the development of urban areas via ethnic entrepreneurship, which positively impacts society and the economy66, research to the contrary highlighted a relation between ethnic poverty concentrated areas and crime, social decay53 and a higher likelihood of residents to drop out of school and remain unemployed long-term67.
61 Gyourko, Joseph, Christopher Mayer, and Todd Sinai. 2006. “Superstar Cities.” National Bureau of Economic Research Working Paper 12355.
62 Kneebone, Elizabeth. 2014. “The growth and spread of concentrated poverty, 2000 to 2008-2012.” Brookings
Institution Research Brief, July 31.
http://www.brookings.edu/research/interactives/2014/concentrated-poverty#/M10420.
63 Del Pero, Angelica S., Willem Adema, Valeria Ferraro, and Valérie Frey. 2016. “Policies to promote access to good-quality affordable housing in OECD countries.” OECD Social, Employment and Migration Working Papers No.176.
64 Wacquant, Loïc. 2008. Urban Outcasts: A comparative sociology of advanced marginality. Cambridge, UK: Polity Press.
65 Galster, George, Roger Andersson, Sako Musterd, and Timo M. Kauppinen. 2008. “Does neighborhood income mix affect earnings of adults? New evidence from Sweden.” Journal or Urban Economics, 63: 858-870. 66 Kloosterman, Robert, and Jan Rath. 2003. Immigrant Entrepreneurs: Venturing abroad in the age of
globalization. Oxford: Berg.
67 Massey, Douglas S., and Nancy A. Denton. 1998. American Apartheid: Segregation and the Making of the
26 Therefore, the concentrated disadvantage may also have an impact on the residents, on the society and the economy as well as on the region that lacks sustainable development and growth62.
3.2. Governmental policies
Instead of weighing the positive and negative effects of segregation against one another, the government mostly focusses on the negative side effects. Their predominant fear is the development of ‘parallel societies’53 that may perpetuate poverty and its negative effects on the society and the economy across generations. For this reason, established governmental policies aim to reduce the level of segregation and to build mixed-tenure neighborhoods. For example, the US government has launched the HOPE VI project that amongst others aims to promote ‘placing public housing in non-poverty neighborhoods’68. The same approach has been followed in France through the SRU Housing Act that requires most French communes to increase social housing to at least 20% of their housing stock by 202069. With these policies in place, the governments expect improvements in poverty alleviation, housing quality and in low-income households’ lifes in regards to increased life chances70. However, there are also governments (e.g. in Germany), that have favored mixed neighborhoods, but whose internal debate about social housing is shifting towards the positive effects of segregation71. The research, disclosing the inefficacy of social mixed-tenure neighborhoods and the positive effects of segregation72, argues that ethnic
68 HUD.GOV. 2016. U.S. Department of Housing and Urban Development.
http://portal.hud.gov/hudportal/HUD?src=/program_offices/public_indian_housing/programs/ph/hope6/about (accessed June 10, 2016).
69 Blanc, Maurice. 2010. “The impact of social mix policies in France.” Housing Studies, 25 (2): 257-272.
70 Levy, Barry S., and Victor W. Sidel. 2013. Social injustice and public health. 2nd ed. Oxford: University Press. 71 Scanlon, Kathleen, Melissa Fernández Arrigoitia, and Christine M.E. Whitehead. 2014. Social Housing in
Europe. London: John Wiley & Sons.
72 Musterd, Sako, and Sjoerd de Vos. 2007. “Residential dynamics in ethnic concentrations.” Housing Studies, 22 (3): 333-353.
27 concentration serves as a starting point for most immigrants entering a foreign country and as a base to get economic, social and emotional support73. It is also found that segregation creates a safer environment for residents to be less exposed to discrimination74.
It may be assumed that the ideal form of social mixed-tenure neighborhoods is not based on empirical results, but on conviction75. It may additionally be argued that the policies favoring mixed tenure are used more as a tool to shift the political focus away from racial integration policies that may effectively reduce the negative effects76.
3.3. Research gap
In order to further explore the issue of segregation and its consequences, it is important to explore the balance of positive and negative effects of segregation from a country perspective due to existing dependencies, such as the welfare system. The focus shall lie on countries that are more affected by the phenomenon. As a consequence, an analysis of the effectiveness of both the unintended and intended social and economic consequences of policies shall be conducted using a more longitudinal approach. This allows the analysis to avoid biases related to, for instance, unobserved time-invariant characteristics. The research shall provide a handbook for social policy makers to make an informed decision on the right policies (e.g. SAH policies) to address the negative effects of segregation.
73 Zorlu, Aslan, and Clara H. Mulder. 2008. “Initial and subsequent location choices of immigrants to the Netherlands.” Regional Studies, 42 (2): 245-264.
74 Logan, John R., Wenquan Zhang, and Richard D. Alba. 2002. “Immigrant enclaves and ethnic communities in New York and Los Angeles.” American Sociological Review, 67 (2): 299-322.
75 Graham, Elspeth, David Manley, Rosemary Hiscock, Paul Boyle, and Joe Doherty. 2009. “Mixing housing tenures: Is it good for social well-being?” Urban Studies, 46 (1): 139-165.
28
4. Personal Reflection
After having experienced some challenges with the business project over the last three months, it is time to discover the hidden value of reflection. Reflection is important, because it not only impacts mental health and creativity, but it also provides the possibility to learn from experience and improve personal effectiveness77. The following entails an analysis of personal characteristics that became salient during the project, the role within my team and areas for personal improvement.
4.1. Emergence of personal characteristics
The business project had a very slow start due to some challenges with the client, which ultimately led to a high level of discomfort caused by uncertainty around the scope. I was slightly concerned about the client’s lack of clarity and commitment during the initial scope definition phase. For instance, the client was not always promptly available when their input was crucial to define and finalize the scope of the project. This incidence delayed the actual start of the project by six weeks. Even our mentor from the university felt the urge to become more active and discussed several options with the CEMS unit coordinator, e.g. changing the client, the topic or the client’s representative. After the scope was finally defined and agreed upon, I felt comfortable again given that we had a clear and achievable scope. Our CEMS unit coordinator additionally emphasized she would consider the circumstances when comparing the outcome and depth of our report to the other teams’ output. A situation like this reveals that I feel uncomfortable if the success of my work depends on other’s input and therefore remains outside of my influence.
77 Kets de Vries, Manfred.F.R. 2014. “Doing nothing and nothing to do: The hidden value of empty time and boredom.” Faculty Research Working Paper, Insead.
29 Furthermore, during the course of the business project, I realized that I always try to maximize the output, which may occasionally result in my impatience. I was impatient with certain team members, because several indicators reflected different levels of commitment. While one team member only wanted to exert the level of effort into the business project that equaled the amount of ECTS gained, another team member refused to sacrifice any time on the weekend, regardless of the amount of work outstanding. The reason for the different levels of commitment derive from the different levels of intrinsic motivation, different prioritization (travelling vs. working for the business project) and different incentives.
Additionally, the preference of working efficiently became salient. This was apparent due to increased levels of frustration when valuable time was wasted as a result of an insufficient structure. For instance, team meetings were inefficient when team members showed up late or not at all due to other commitments. However, when the deadline was approaching, increasing level of extrinsic motivation meant the team continuously increased its level of cooperation. This allowed us to get to know each other’s strengths and weaknesses, which increased the level of trust and efficiency and eventually caused the richness of our project. From this experience, I have realized I am a very organized and self-disciplined person who prefers a clear schedule and who creates personal deadlines.
4.2. My role in the team and my contribution to the team
In the face of external challenges, e.g. with the client, I stepped up to become one of the more dominant team members who decided on the direction the business project would take. For instance, I assigned myself as the project leader. The first reason for this was that the team neither discussed nor appointed a team leader. Secondly, I was unsatisfied with the initial level of commitment and concerned about the situation with the client. Furthermore, I did not see the
30 possibility of getting any external support from the client or the mentor to help align the different levels of engagement. Finally, achieving outstanding results was important for me in order to additionally have a great basis for my Work Project. Thus, I found myself in a position taking on the following tasks: I set up a timeline with milestones and deadlines in agreement with my team members and tried to make sure the deadlines were met. I organized team meetings and made sure everyone would be available. Furthermore, I was active in seeking updates in regards to interactions with the client and the mentor in order to proceed as quickly and efficiently as possible. Furthermore, I proposed team dinners in order to enhance the team spirit.
Throughout the process, I was able to further develop my ability to organize teams and team meetings and to engage everyone in the team while taking into consideration different opinions. From a contextual perspective, I further developed my ability to not get stuck in the research stage or minor details, but to focus on the overall goal of the project.
4.3. Areas of personal improvement
I learned to remain calm despite the external challenges, which were out of our control. I additionally learned to be more patient with my team members and accept that students may have different underlying motivations. If I were to start this project again, I would try to be more relaxed, patient and optimistic in regards to the final outcome. Furthermore, I would encourage my team to meet more often outside of university in order to get to know each other’s personality as soon as possible. This might have helped to enable us to collaborate better and become a more cohesive team, better at dealing with external challenges. Finally, from the beginning I would try to be a more active project leader that builds organizational structures.
Overall, I am glad for the experience I gained throughout the business project and I am convinced that I can take advantage of it in my future career.
31
V. Appendix
Appendix 1: Competitive Landscape of NAB
Sources: NAB 2015, CBA 2015, ANZ 2015, WBC 2015.
Appendix 2: Government impact on the SAH market
Lever Examples Government
Responsibility
Impact
Construction and development costs
Innovative design and building concepts. N/A Low
Financing costs Interest rate subsidy. Commonwealth Medium Financing terms Longer financing terms of up to 15-20 years. Commonwealth/
State
Medium Management
rights transfer
Enable management rights to be transferred. State Medium Planning
regulations
Include 10-15% affordable housing inclusion in zoning regulations.
State Medium
Income support Commonwealth rental assistance indexed to market rent.
Commonwealth Medium Tax incentive Put appropriate rental assistance scheme in
place. Built on NRAS model.
Commonwealth High Land costs Land gifted or leased at peppercorn rent from
the state.
State High
Land/Stock ownership transfer
Title transfer of social housing to CHPs with leverage commitments.
State High
Source: Peacock 2016. Competitive Landscape
2015 2014 2015 2014 2015 2014 2015 2014
Market Cap A$m 02/2016: 65,288 02/2016: 126,734 02/2016: 67,523 03/2016: 104, 026
Risk-weighted assets 399,758 368,721 337715 401,937 358,580
Total Assets 955,052 883,301 873,446 791,451 889,900 772,100 812,156 770,842
Loans and advances 532,784 434,725 646,172 608,127 570,238 521,752 623,316 580,343
Total Liabilities 899,539 835,393 820,453 742,103 832,500 722,800 758,241 721,505
Equity 55,513 47,908 52,993 49,348 57,400 49,300 53,915 49,337
Profit before income tax expense 9,080 7,782 12,612 11,997
Total Gross loans 537,165 432,307 646,172 608,127 572,370 524,383 626,344 583,516
Housing Loans 341,965 311,188 422,851 399,685 300,468 271,388 414,199 386,502
% Housing of Total 0.64 0.72 0.65 0.66 0.52 0.52 0.66 0.66
% gross loans of total assets 0.56 0.49 0.74 0.77 0.64 0.68 0.77 0.76
32
Appendix 3: Government policy changes over time
1950 The dwellings were allocated to households who cannot afford non-rebated rent. 1970s Income eligibility and rent ceiling were introduced.
1980s State housing authorities devolved part of their responsibilities to non-government organizations. The local government community-housing program was introduced.
Early 1990s The commonwealth government called for greater housing choice for low-income households and promoted community housing.
End of 1990s The commonwealth government shifted its focus more on demand-side assistance.
Recent The key focus has been shifted from providing community housing to delivering affordable housing in accessible locations in private partnership.
Source: SGS 2016.
Appendix 4: Government expenditure on the affordable housing services
(in $mil) 2014-2015 2015-2016 2016-2017 2017-2018 2018-2019
National Affordable Housing SPP 1305.8 1324.1 1345.2 1366.8 1388.6 National Partnership Payments
First Home Owners Boost -0.6
Homelessness 126.7 115 115
Northern Territory (Remote Aboriginal investment, Remote Australia strategies)
56 49.7 50.9 3.6
Remote Indigenous housing 485.6 363.1 406.5 361.9
Stronger Futures in the Northern Territory Housing
55.9
Total 1973.3 1858.1 1916.5 1779.5 1392.2
Source: Australian Government 2015.
Appendix 5: Current social housing initiatives by the federal government
Federal government initiatives Commencement date Scope Commonwealth rent
assistance
1991 $4.35bn raised for the 2014–15 financial year. National rental affordable
scheme
2008 73 participants have been approved in 2015 and 2016. National and affordable
housing agreement
01/01/2009 provides $6.2bn worth of housing assistance to low and middle income Australians in the first five years. Housing affordability fund 30/06/2012 16 projects have been approved for in total $113M
funding.
Sources: DSS 2016, Australian Government 2015.
Appendix 6: Government and private sector one-off partnership projects
Name Location Partners Record
City West Housing Company Pty.Ltd.
Sydney inner-west Funded by the NSW and Federal government and private developer contributions.
600 medium density units Brisbane Housing Brisbane’s inner Government provides the tax incentives and allows 600
33
Company Pty.Ltd. and middle suburbs access to limited private debt finance. dwellings City of Port Phillip Melbourne The city in conjunction with a community housing
organization (the Port Phillip Housing Association) provided solutions to the Port Phillip area.
Over 1000 homes Community
Housing Canberra Ltd
Canberra Housing provider with private equity partner City Edge.
123 units
Source: AHURI 2004.
Appendix 7: Westpac’s involvement in the SAH market
Funding PPP (Public Private Partnerships)
The Bonnyrigg PPP project aims at refurbishing a residential area in the Western Sydney suburb. The project was awarded to the consortium in which Westpac is part in October 2006.
Completion of Social Impact Bond
Westpac issued the second social impact bond in Australia. The bond has a size of $10mil and it is aimed at keeping at-risk families intact.
Cash flow lending solution for CHPs
Loans that initially are interest only and later transform into servicing interest and capital.
Securitization A model in which loans are transformed into liquid marketable securities.
Lending to CHPs In October 2014 Westpac signed the largest single community finance deal with a provision of $61mil in debt finance. The funds are employed for 275 dwellings in the Sydney Metropolitan Area.
Sources: NSW Department of Housing 2007, Westpac 2016, Westpac 2013b.
Appendix 8: Housing cooperatives model
Three existing sub-models under the Housing cooperatives
Full-equity cooperatives Shared-equity cooperatives Non-equity rental model Funding is directly from the
members.
Independent of the public housing sector.
No room for institutional investors
Funding can be from both public and private funds. Restrictions on the resale of
the shares in cooperatives. Independent of the public
housing sector.
Similar to renting and more sustainable. Only some tenants pay reduced monthly
rent geared to the income. Members are not owners
Offers the highest rental yield among the three types.
34
Advantages Reason
Efficiency Increased tenant control over the decision-making practices of their community.
Home security enhanced.
Welfare dependency for government is reduced.
Disadvantages Reason
Risk adjusted returns and yield gap
Not much space for commercial investors.
The funding is generated mostly from the government.
Uncertainty at the service delivery level will affect the rate of return. Low liquidity The units cannot be sold on the open market.
Default risk Relatively high likelihood of the debtor's default.
Scale Usually comes up in small scale to accommodate specific social problems.
Sources: Sousa and Quarter 2004, AHURI 2010.
Appendix 9: Social impact bond model
Goal of the SIB To access private capital in order to prevent or tackle social problems at an early stage. To align private capital to social measurable results.
Stakeholders Collaboration between investors, public authorities, an intermediary and social service providers.
SIBs mechanism The government decides on a social problem.
An intermediary is placed whose purpose is to manage the fund by acting between the government, investors and the service providers.
Investors provide private capital.
Non-profit service providers work together with the defined target population to tackle the defined social issue.
35
social outcomes are met (measured by an independent evaluator).
Specific for investors
The government is not obliged to pay anything if the social targets are not met.
Investors bear the risk of default, the risk of wrong measurement techniques and ineffective service providers.
Investors are not secured by any hard assets or cash flows.
It is important for investors that service providers have a track record that shows their ability to manage the operations successfully.
Investors need assurance that the independent evaluator measures and collects data correctly.
Market size Estimated present market size at around US$25bn.
Expected to constitute up to 1% of global assets (around US$500bn) by 2020.
Sources: Hughes and Scherer 2014, Arosio 2011.
Advantages Reason
CSR
enhancement
Benefits are mostly related to enhancing CSR. NABs commitment to society and concrete social results achieved by their involvement could be promoted via various channels.
Diversification Only minor diversification due to strong correlations between the SAH and the private housing market.
Disadvantages Reason
Low rate of return
Disadvantages are related to the commercialization of the SIBs:
the return is perceived as too low given the amount and the required waiting time for returns;