Next Generation Access Networks (NGANs) and
the geographical segmentation of markets
João Paulo Ribeiro Pereira
Polytechnic Institute of Bragança (IPB)Bragança, Portugal [email protected]
Pedro Ferreira
Technical University of Lisbon (IST) Lisbon, Portugal
Abstract—Telecom infrastructures are facing unprecedented
challenges with increasing demands on network capacity. Next Generation Networks (NGN) allows consumers to choose between different access network technologies to access their service environment. The arrival of NGAN (Next Generation Access Network) has implications for the competitive conditions in access markets that are still uncertain (for example: access to ducts, dark fiber, equipment, etc.). The definition of the access price is a critical question, particularly when the incumbent also has activity in the retail market. In some regions, the regulatory authorities need to define the max price for wholesale access. In this context, the paper is divided into two main parts: 1) First we make a review of the main broadband access technologies (NGANs), and we propose a techno-economic model to support the new requirements of
fixed and nomadic users. 2) In the 2nd part we propose a tool,
developed in c language, which simulates the impact of retail and wholesale services prices variation in the provider’s profit, consumer surplus, welfare, etc.
Next Generation Networks, Next Generation Access Networks, Geographical Segmentation, Segmented Regulation, Nash Equilibrium
I. INTRODUCTION
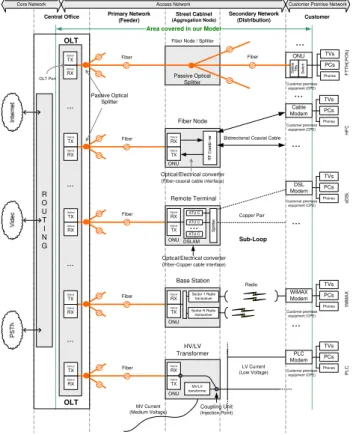
The move towards Next Generation Networks (NGN) has begun to transform the telecommunication sector from distinct single service markets into converging markets [1]. Telecom infrastructures are facing unprecedented challenges, with increasing demands on network capacity. NGN allows consumers to choose between different access network technologies to access their service environment. In our work, the architecture of NGN will be limited to the current and future developments of network architectures in the access network (local loop), called Next Generation Access Network (NGAN). The NGAN can use technologies as fiber, copper utilizing digital subscriber line (xDSL) technologies, coaxial cable, powerline communications, wireless solutions or hybrid deployment of these technologies (Figure 1).
The choice of a specific technology for NGAN can be different between countries, geographic areas and operators. In recent years there has been an increase in the number, coverage and market share of “alternative” networks or operators such as resellers, unbundling operators, cable
network operators, operators using frequencies for Wireless local loop (WLL), or operators deploying optical fiber in the local loop [2]. This has resulted in differences in competitive conditions between geographic areas, and this, in turn, has led to increasing argument (especially from incumbent operators) that geographical aspects be recognized in market/competition analysis and in regulatory decisions. There are several factors that can be responsible for this discrepancy [3]: state and age of the existing network infrastructure, length of local loop, population density and structure of the housing market, distribution of number of users and number of street cabinets for Local Exchange, level of intermodal competition in the market, willingness to pay for broadband services and the existence of ad hoc national government plans for broadband development.
The arrival of NGAN has implications for the competitive conditions in access markets that are still uncertain, including the role of bitstream, Sub-Loop Unbundling (SLU) access to ducts, etc. However, operator’s investments in networks face different types of uncertainties. For example, when the incumbent operator has the monopoly in the access network and, simultaneous, has activity in retail market, the price regulation is an important question. Without price access regulation the incumbent can use his power in the market to stop or hamper the entrance of new operator in the retail market. However, if regulatory authority makes a very rigid control of the access price may reduce the incentive of the incumbent to make investments in the network. The regulatory authority should not increase uncertainties and has to provide clear incentives and guidance for the investment required for deploying NGANs [4]. Regulators should ensure that Local Loop Unbundling (LLU) and SLU, bitstream, the transition to NGAN, access to ducts and dark fiber, inside (building) wiring, collocation, and backhaul are defined in a transparent, efficient, and technologically neutral manner [2]. Segmented regulation has been identified as a regulatory framework that can potentially provide both incentives and controls for the deployment of NGNs [5].
differences in competitive conditions between geographic areas. Results from market analysis economics suggest that differential regulation be considered between geographic areas where facility-based competition has developed and where it has not.
R O U T I N G PCs TVs Phones PCs TVs Phones PCs TVs Phones PCs TVs Phones Fiber Optical TX Optical RX OLT ... OLT
Bidirectional Coaxial Cable
Optical/Electrical converter (Fiber-coaxial cable interface)
Fiber Node Customer premises
equipment (CPE) Cable Modem ... ONU Optical RX Optical TX LV Current (Low Voltage) HV/LV Transformer Optical RX Optical TX PLC Modem ONU MV/LV transformer MV Current (Medium Voltage) Radio Base Station ... ONU WiMAX Modem
Sector 1 Radio transceiver Optical RX Optical TX Fiber Optical TX Optical RX Copper Pair Optical/Electrical converter (Fiber-Copper cable interface)
Remote Terminal Optical TX DSL Modem ... ONU DSLAM ATU-C ATU-C ... ATU-C Optical RX Fiber Optical TX Optical RX Fiber Optical TX Optical RX ... ... Fiber Passive Optical Splitter OLT Port
Sector N Radio transceiver Passive Optical Splitter Fiber ... ... ... Coupling Unit (Injection Point) Fiber Node / Splitter
ONU PCs TVs Phones Customer premises equipment (CPE) Customer premises equipment (CPE) Customer premises equipment (CPE) Customer premises equipment (CPE) Optical TX Optical RX Access Network Core Network Primary Network (Feeder) Secondary Network (Distribution)
Central Office Street Cabinet Customer
(Aggregation Node)
Customer Premise Network
Area covered in our Model
Sub-Loop
Figure 1. NGAN architectures (Block diagram) [6]
Competition can be promoted at many levels and locations through contestability and innovation [7]. After the decision of several countries to implement geographic regulation, the interest in these questions has been an increase. In the literature on the regulation of future access networks the discussion on regulation and investment has gained center stage given the pending infrastructure investments in many countries [1]. The geographically segmented regulation should aim not only at facilitating deregulation but also at strengthening regulation in those regions where competition is assessed to be ineffective. Then, segmented regulation can assist regulators to ensure that the regulatory framework they apply is appropriately tailored to the competition situation [2]. Local decisions of a national regulator may lead to inefficiencies deriving from discrepancies between local and global cost-benefit evolutions [8]. Segmented regulation may be helpful because it allows different solutions for the deployment of NGNs in urban and rural areas to evolve at different paces [5]
Figure 2 illustrates a scenario of the differences in competitive circumstances that may warrant geographically segmented regulation. There are geographical differences in conditions of competition: number of suppliers, market shares, etc. [9].
The deregulation of high-density areas may avoid unnecessary protection of access-based competitors and strengthen incentives to invest in infrastructure, and that maintaining regulation of low-density areas may promote competition with national offers, because alternative operators are enabled to extend geographical coverage
Incumbent (self supply and WBA) WiMAX (self supply)
Cable (self supply)
4-suppliers suppliers3-
1-supplier No supply
Coverage of networks (% of households passed) Unbundlers (self supply and sometimes WBA)
2-suppliers 100% 0% Example: WBA Households in high-density areas Households in low-density areas
Figure 2. Geographically segmented regulation [9]
The analysis of some regulatory inquiries [1, 2, 7] on the national level shows that access providers (usually the incumbent operators – the former monopoly operators) are generally in favour of geographic differentiation. For example: the Spanish operator (Telefonica) claims that (see [2]) “…the geographical segmentation model will push investments and gradual deregulation and users will always enjoy the best possible scenario, either with a sustained or a regulatory supervised market…Differentiated regulation would prevent the increase of the digital divide.” In Australia, Telstra argued that geographically segmented regulation (see [2]): “…will promote competition by giving service providers the appropriate incentives to use and extend alternative infrastructure, and will also promote competition in the upstream local services market by encouraging other carriers to offer wholesale local services.”
In case of consumers, the geographic differentiation impact has an important consideration especially in view of the often-repeated statements by politicians and regulators that policy and regulation are designed to be in the long-term interest of consumers [1]. For business users, the breakup of market analysis to sub-national level is a source of significant alarm, especially concerning wholesale broadband access services. For multinational business users, inconsistency of national regulations, and a consequent inability to obtain seamless international network services without service quality, costs and administrative disadvantages, is already a serious problem.
II. A TECHNO-ECONOMIC MODEL FOR BROADBAND ACCESS TECHNOLOGIES
A. Overview
and propose a techno-economic model to support the new requirements of fixed and nomadic users.
We present an economic model designing and deploying access networks for both fixed and mobile users. The type of networks for fixed users includes, FTTH, DSL, HFC, PLC, while the nomadic user is assumed to use WiMAX. This model could serve as a good starting tool for the design of access networks, as it includes all the major capital expenses involved in the deployment of access networks such as equipment costs, installation costs, etc. The costs resulting for our model is grouped into 3 main categories: A) Infrastructures: in our work we subdivide this category in 2: civil works (trenching and ducting) and cable costs (cost of the fiber and cost to pass the cable in the ducts). As we can see in Figure 1, in all solutions the fiber costs are necessary to connect central office to the street cabinet. Normally, this is the category that has more costs, depending on the existence/share of an infrastructure. This means that if an operator has the infrastructure (or part), the costs can be lower. B) Equipment: includes the costs such as optical network unit (ONU), optical line termination (OLT) ports and chassis, splitters, digital subscriber line access multiplexer (DSLAM), etc. Also includes the cost of street cabinets and the equipment installation costs. C) Customer Premises Equipment: includes the modem and other electronics – like splitters. For FTTH architecture includes the ONU equipment.
B. Description
The proposed model considers that in the static layer, users are stationary and normally require data, voice, and video quality services (these subscribers demand great bandwidth). In the nomadic layer (or mobility layer), the main concern is mobility and normally the required bandwidth is smaller than in the static layer. The focus of the wireless networks was to support mobility and flexibility, while for the wired access networks is bandwidth and high QoS. However, with the advances in technology, wireless solutions such as WiMAX have capacity to provide wideband and high QoS services and in this way competing with wired technologies [10]. Then, we propose a new model to support the new needs of the access networks: bandwidth and mobility (see Figure 3).
For the nomadic layer we chose the WiMAX solutions. This technology enables long distance wireless connections with speeds up to 75 Mbps per second. WiMAX can be used for a number of applications, including "last mile" broadband connections, hotspot and cellular backhaul and high-speed enterprise connectivity for businesses. This technology can offer very high data rates and extended coverage.
As we can see in Figure 4, the framework is separated into three main layers [12]: (Layer 1) First, we identify for each sub-area the total households and SMEs (Static analysis), and total nomadic users (Mobility analysis).The proposed model initially separates these two components because they have different characteristics. (Layer 2) In this layer, it is analyzed the best technology, for each Access Network, the static and nomadic component. For the static analysis we consider the following technologies: FTTH-PON
(passive optical networks), DSL, HFC, and WiMAX PLC. To the nomadic analysis we use the WiMAX technology. Then, the final result of this layer is the best technological solution to support the different needs (Static and nomadic). The selection of the best option is based in four output results: NPV, IRR, Cost per subscriber in year 1, and Cost per subscriber in year n. (Layer 3) The next step is to create a single infrastructure that supports the two components. To this end, is necessary the analysis of the best solution (based on NPV, IRR, etc.) for each Access Network. Then, for each sub-area we verify if the best solution is: a) the wired technologies (FTTH, DSL, HFC, and PLC) to support the static component and the WiMAX technology for mobility; or b) use the WiMAX technology to support the Fixed and Nomadic component.
Figure 3. Cost model framework [11]
The Capital Expenses (CAPEX) costs referred above are divided into: equipment costs, installation costs, cable costs, housing costs and civil works. Besides the annual capital costs, which are derived from the relevant values for directly and indirectly attributable investments, other costs also need to be taken into account, for instance those incurred for the network’s operation and maintenance (OPEX -Operational Expenses).
III. SEGMENTED REGULATION
A. Overview
infrastructure. In some areas, especially with higher density, alternative operators have rolled their own infrastructure and broadband competition has developed. This would result in more innovation and better prices to consumers.
Many Europeans incumbents and some alternative operators are starting to plan and in some cases deploy large scale fiber investments, which results in important changes for European fixed line markets [3]. The risk of alternative operators will take longer to deploy their own infrastructure will give to incumbent the possibility to create new monopolies at the access level. The technologies used and the pace of development vary from country to country according to existing networks and
local factors. Based on the different underlying cost conditions of entry and presence of alternative platforms, it may be more appropriate to geographically differentiate the access regulatory regime.
This part of the work focus the development of a tool using c language (with multiprocessing ) that simulates the impact of retail and wholesale prices in provider’s profit, welfare, consumer surplus, costs, Market served, network size, etc.
B. Description
In the proposed model “Retail Prices” represents the set of retail prices charged by providers for each service to consumers in a given region/area. We assume that retail providers cannot price discriminate in the retail market. “Wholesale Prices”
represents the prices that one provider charges to other provider to allow the later to use the infrastructure to reach consumers. We assume that wholesale price can be different in each area. Also, we assume that when a provider buy infrastructure access in the wholesale market, cannot resell to another provider. The shared infrastructure consists of (Table I): Conduit and collocation facilities; Dark fiber leasing (dark fiber requires active equipment to illuminate the fiber – for example repeaters); and Bit stream.
TABLE I. INFRASTRUCTURE LAYERS (MAIN COMPONENTS)
For example, Wholesaler provider can sell Layer 0 access (conduit and collocation facilities) and/or Layer 1 access (dark fiber leasing) or Layer 2 access (bitstream – network layer unbundling – UNE loop) only to retail providers and
not directly to consumers. UNE loop is defined as the local loop network element that is a transmission facility between the central office and the point of demarcation at an end-user’s premises.
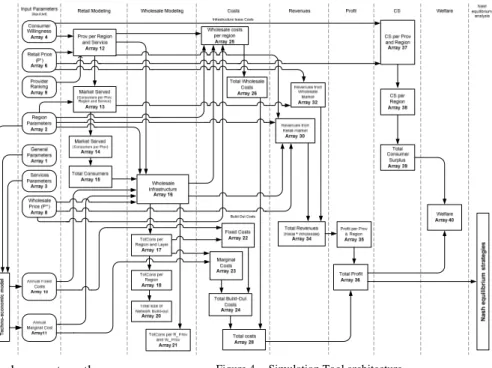
Providers incur in fixed costs to build network infrastructure to provide access to a region and in marginal costs to connect each consumer separately. As we can see in Figure 4, our tool has several input parameters (one of them come from the techno-economic model described in the previous section), compute several results and find the strategies that are Nash equilibrium. The results are represented in tables and graphics.
Figure 4. Simulation Tool architecture
The input parameters can be divided into 7 main groups: Identify the number of providers, regions, services and
layers. We used layers to represents the shared infrastructure (Layer 0 – conduit and collocation facilities; Layer 1 – Dark Fiber leasing; and Layer 2 – Bitstream).
Region parameters: for each region/area we need to define the total homes, Avg. Feeder length (central office (CO) – aggregate node (AGN)), Distribution Length (AGN - End User), and Geographical Area Description (Rural, Sub-urban, or Urban).
Service parameters: Bandwidth required for each Service in the different regions.
Willingness to pay for services per Region: Consumers have different willingness to pay for each service (voice, video and data). So, is necessary the definition of the willingness for each region and each service. Providers Retail Prices for the different services. One
provider with the lowest price. If several providers have the same price, then we use the provider ranking.
Providers Wholesale Prices for the different layers in the several regions. We assume that each part of the infrastructure can had different leased prices in the each region.
Fixed and Marginal costs. These costs are computed in the tool presented above. The cost model uses the parameters defined previous to compute the costs. For example: total homes, length CO-AGN, length AGN-End User, bandwidth required for each Service, etc. Based on the several input parameters described, our tool computes several results (profit, consumer surplus, welfare, market served, network size, costs, and revenues) and finds the strategies that are Nash equilibriums.
1) Results
Next table show the structure of the results correspondent to a scenario of 2 providers, 2 retail services, 2 infrastructure layers (Layer 0: Conduit; Layer 1: Cable + Equipment) and 3 regions. Each line is a strategy (We consider a strategy a set of retail and wholesale prices)
TABLE II. STRATEGIES AND RESULTS (TOOL OUTPUT)
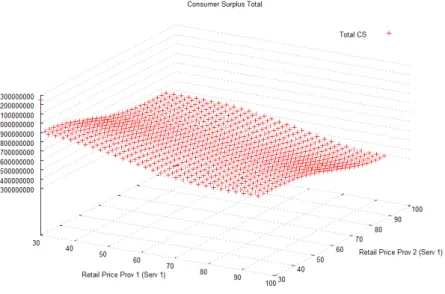
For each combination of prices, the tool computes: Profit, Consumer Surplus, Welfare, Market Served, Network Size, and Total Costs. The results are presented in several graphics (see Figure 5 and Figure 6).
Figure 5. Total Profit (Retail Price)
Figure 6. Total Consumer Surplus
2) Nash equilibriums
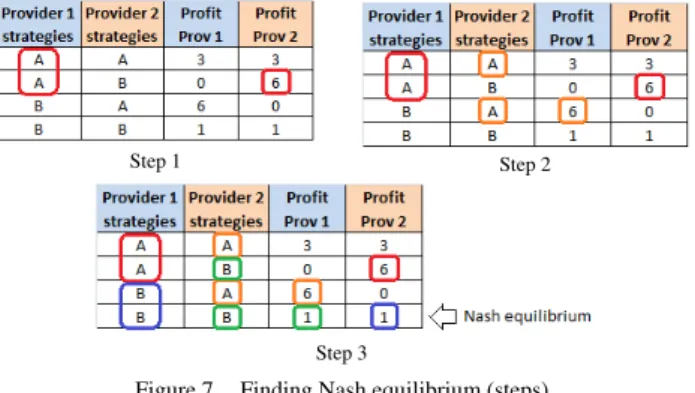
Nash equilibrium is a fundamental concept in the theory of games and the most widely used method of predicting the outcome of a strategic interaction in the social sciences. A game (in strategic or normal form) consists of the following three elements: a set of players, a set of actions (or pure-strategies) available to each player, and a payoff (or utility) function for each player. The payoff functions represent each player’s preferences over action profiles, where an action profile is simply a list of actions, one for each player. A pure-strategy Nash equilibrium is an action profile with the property that no single player can obtain a higher payoff by deviating unilaterally from this profile (International Encyclopedia of the Social Sciences – 2nd Edition).
The next paragraphs explain the algorithm used in our work for finding Nash equilibriums - Finding each provider’s best response to the other provider’s strategy: 1) Select a specific provider and a specific strategy. For
Step 1 Step 2
Step 3
Figure 7. Finding Nash equilibrium (steps)
For the scenario presented above, our tool identified the combinations that are Nash equilibrium.
TABLE III. NASH EQUILIBRIA
IV. CONCLUSIONS
The definition of the access price is a critical question when the incumbent also has activity in the retail market. Without the access price regulation the operator owner of the network can obstruct or hinder the access to the network. But, by other side, the exaggerated control of the access price can discourage the investments of the incumbent in the network quality. The investment in the network quality increases the services value to the existent consumers (for example: access with higher quality and speed to services like e-mail, www, video, etc.) and attracts new consumers.
So, regulatory authority can use the access prices definition to: induce the entrance of new providers in the retail market- concurrency in the retail market; incentive to investment; and consumer’s welfare. The regulatory authorities need to define the max price for wholesale access. So, the main decisions are: Decision about the wholesale access price for each layer; and Decision about the price for each service in retail market.
The tool pretends support regulatory authorities to determine whether it is appropriate to delineate markets more narrowly than on a ‘national’ basis, and if so, how they should be segmented is a complex task. The experience of several OECD countries demonstrates that identifying relevant criteria for the definition of geographic markets and the segmentation of the market is possible and can be effective, but can be complex [2]. It is important that regulators accurately determine whether geographically segmented regulation is appropriate. When effectively
implemented, geographic segmentation will promote competition and investment and serve the long-term interests of end-users. In addition, it may make sense for some countries to utilize geographically segmented regulation and for others to decline to do so. Also, to the extent that different technologies have different geographic footprints, the possibility arises that this could lead to distortions if different technologies of increasing substitutability (because of convergence) are regulated differently under a geographic regulation regime.
It is possible that investment in areas which remain regulated (e.g., sparsely populated rural areas) will be adversely affected by geographic regulation. This is because the incumbent’s priority could become investment in areas open to competition to enhance its competitive prowess, and this could, in turn, result in competitive operators also focusing more attention to these areas rather than in rural areas.
REFERENCES
[1] F. Kirsch, C.V. Hirschhausen, Regulation of Next Generation Networks: Structural Separation, Access Regulation, or no Regulation at all?, in: First International Conference on Infrastructure Systems and Services: Building Networks for a Brighter Future (INFRA), Rotterdam, The Netherlands 2008, pp. 1-8.
[2] P. Xavier, Geographically Segmented Regulation for Telecommunications, in: Working Party on Communication Infrastructures and Services Policy, OECD, 2010, pp. 77.
[3] G.B. Amendola, L.M. Pupillo, The Economics of Next Generation Access Networks and Regulatory Governance in Europe: One Size Does not Fit All, in: 18th ITS Regional Conference, Istanbul, Turkey, 2007.
[4] R.D. Vega, NGANs and the geographical segmentation of markets, in: OECD Workshop on Fibre Investment and Policy Challenges, OECD, Stavanger, Norway, 2008, pp. 1-18.
[5] P. Ferreira, Modeling Segmented Regulation for Next Generation Networks, in: The 36th Research Conference on Communication, Information and Internet Policy, George Mason University School of Law, Arlington, VA, USA, 2008, pp. 1-29.
[6] J.P. Pereira, A Cost Model for Broadband Access Networks: FTTx versus WiMAX, in: 2007 Second International Conference on Access Networks (AccessNets '07), Ottawa, Ontario, Canada, 2007, pp. 1-8.
[7] E. Richards, Future broadband - Policy approach to next generation access, in, Ofcom, 2007, pp. 1-34.
[8] F. Castelli, C. Leporelli, Segmented regulation in global oligopolies: industry configuration and welfare effects, Inf. Econ. Policy, 7 (1995) 303-330.
[9] U. Stumpf, Towards geographical differentiation of broadband regulation?, in: 3rd Black Sea and Caspian Regulatory Conference, Istanbul, 2008, pp. 1-16.
[10] J.P. Pereira, The Role of WiMAX Technology on Broadband Access Networks, in: U.D. Dalal, Y.P. Kosta (Eds.) WIMAX, New Developments, IN-TECH, Vienna, Austria, 2009, pp. 17-45.
![Figure 3. Cost model framework [11]](https://thumb-eu.123doks.com/thumbv2/123dok_br/16985073.763227/3.892.459.817.397.729/figure-cost-model-framework.webp)