Adaptive Image Pre-processing for Quality Control in
Production Lines
Esteban Arroyo
1, José Lima
1,2, Paulo Leitão
1,31
Polytechnic Institute of Bragança, Quinta Sta Apolónia, Apartado 1134, 5301-857, Bragança, Portugal [email protected], {jllima, pleitao}@ipb.pt
2
INESC Porto, Robotics and Intelligent Systems Research Group, Rua Dr. Roberto Frias, 4200-465 Porto, Portugal 3
LIACC - Artificial Intelligence and Computer Science Laboratory, R. Campo Alegre 102, 4169-007 Porto, Portugal
Abstract— Flexible and self-adaptive behaviours in automated
quality control systems are features that may significantly enhance the robustness, efficiency and flexibility of the industrial production processes. However, most current approaches on automated quality control are based on rigid inspection methods and are not capable of accommodating to disturbances affecting the image acquisition quality, fact that hast direct consequences on the system´s reliability and performance. In an effort to address the problem, this paper presents the development of a self-adaptive software system designed for the pre-processing (quality enhancement) of digital images captured in industrial production lines. The approach introduces the use of scene
recognition as a key-feature to allow the execution of customized
image pre-processing strategies, increase the system’s flexibility and enable self-adapting conducts. Real images captured in a washing machines production line are presented to test and
validate the system performance. Experimental results
demonstrate significant image quality enhancements and a valuable reliability improvement of the automated quality control procedures.
Index Terms— Adaptive systems, Image pre-processing,
Industrial quality control, Scene recognition.
I.INTRODUCTION
In industrial manufacturing facilities with a high volume of production, manual quality control becomes time-consuming and expensive, representing a significant portion of the overall production costs. As a result, in an effort to adopt more efficient, optimized and low-cost methods, research on automated quality control has acquired increasing attention [1- 3, 6].
Generally, large-scale manufacturing processes cannot be disturbed for external supervision procedures and inspection routines may present operational difficulties due to the complexity of the production scenarios. Then, by using computer vision mechanisms, automated supervision tasks can be performed as non-invasive actions and it allows the valuable substitution, in terms of process dynamics and efficiency, of the repetitive operations executed by human workers [4]. In addition, vision-based systems demonstrate substantial profits with regard to reliability, speed, precision and flexibility.
However, most current approaches on automated quality control are based on rigid inspection strategies, i.e., fixed supervision checklists are invariably followed along the entire process. The checklists specify routine descriptions containing items-to-verify, test-criteria, robot orientation/motion sequence, and image acquisition configurations (lens aperture, exposure time, electronic gain, etc.). The routine is executed without considering the actual process state and its possible changes, and consequently, these supervision schemas may be sensibly affected by process variations.
In fact, disturbances of several natures may affect the performance of the computer vision systems located in the plant. Direct results include acquisition quality detractions such as image blurring or luminosity problems, issues that are not addressed within the rigid supervision routines. Furthermore, time-varying parameters and changing production layouts also reveal limitations of fixed-configuration systems, this because tedious reconfigurations may be constantly required. Clearly, these circumstances explain the industrial interest on adopting new intelligent manufacturing systems [6] capable of facing changing situations by self-adaptive and self-learning conducts [7].
Automated supervision procedures are executed by quality control stations disposed along the production lines. Several images are captured according to a pre-defined quality policy (checklist). As a result, the acquisition variants are composed by different elements and exhibit dissimilar parametric indices. Therefore, from a parametric-characterisation perspective, they are to be catalogued as belonging to independent image scenes. This is precisely one of fundaments of the present approach: involving image scene recognition within the automated manufacturing quality control.
systems capable of dealing with process disturbances and time-varying parameters.
Therefore, the problem addressed in this work concerns the adaptive quality enhancement of images captured in industrial production lines (particularly washing machines), with the aim of improving the performance of the existing automated quality control systems. The designed architecture is endowed with adaptive properties based on neural networks, feature-extraction and image correction techniques, which allow the design to perform scene identification and dynamically enhance the quality of given industrial images. In particular, the objective is to develop a system capable of identifying between different scenarios, executing optimal pre-processing strategies for each case and self-adapting to the actual conditions of the process.
The paper is organized as follows: Section II introduces the system architecture. Section III presents the scene recognition algorithm and Section IV describes the adaptive quality enhancement module. Experimental results are discussed in Section V and finally, Section VI rounds up the paper with the conclusions.
II.SYSTEM ARCHITECTURE
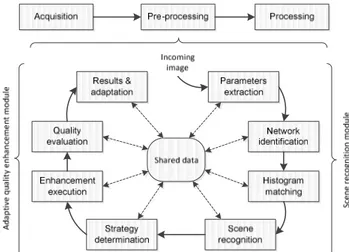
The pre-processing operation takes place just after the image acquisition process and before the image processing stage, as illustrated in Fig. 1. The proposed system architecture comprises two main modules, namely, scene recognition module and adaptive quality enhancement module.
Fig. 1. Image Pre-processing Task Sequence
The scene recognition module is responsible of associating an incoming image to a determined scenario number, based on the evaluation of an ensemble of pre-defined image indices [7]. According to the identified scenario, the adaptive quality enhancement module manages the dynamic selection and execution of the optimal correction strategies for the image.
The modular design allows the system to be easily implemented and interconnected with an extended range of tools running on different platforms, e.g., C++, Python, JAVA, MATLAB® and LabVIEW®. Diverse scripting methods between these programming languages currently exist,
allowing the execution of multiple routines calls and interconnections. Among others, interconnected tools could be an image acquisition system, a processing module and a multi-agent control platform [8].
The next sections will detail the two modules of the proposed pre-processing approach.
III.SCENE RECOGNITION MODULE
In this section, the scene recognition module is presented. Initially, a set of indices and evaluation functions are defined and discussed. Then, the recognition procedure is explained based on the execution of a specific learning process powered by neural networks and histogram matching techniques.
A.Parameters and Global Quality Function
In order to determine the quality of an acquired image, it is necessary to define an evaluation criteria based on numerical computations. For this purpose, an adequate set of parameters that allows the quantification of properties such as contrast, luminosity and sharpness, must be defined. In addition, the establishment of an appropriate quality function that relates the individual indicators, assigning the proper significance to each one, is fundamental.
By means of the parameters definition, the system is capable of parameterizing specific scenarios and obtaining information related to the image properties. Meanwhile, the global quality function combines the contributions of the single parameters to penalize those values far from the desirable ones. In this way, the strategy consists of minimizing this function and obtaining a numerical value that represents a penalized image quality. A brief summary of the set of parameters and quality functions, adapted from [7], is presented below.
Starting with the Tenengrad parameter (TN), this algorithm’s logic lies in the principle that clear and sharped images present defined contours characterized by high intensity changes. Therefore, its numerical calculation is based on the maximization of the gradient scheme. High TN values are related with well-defined images and hence it is intended to increase this parameter for sharpness enhancement purposes. Defining W and H as the dimensions of the image, the corresponding TN expression is given by equation (1).
= ( , ) ∀ ( , ) > ℎ (1)
The gradient magnitude is obtained by the convolution of the Sobel operators (ix, iy) with the image pixels I(x,y) in the
respective x and y directions, as shown in equation (2).
( , ) = ∗ ( , ) + ∗ ( , ) (2)
For noise impact reduction, a numerical threshold Th is defined and only the magnitudes greater than this value are considered in the computation of TN. In this approach, the threshold estimation is performed using the Otsu’s method.
threshold Th1, see equations (3) and (4). The FL value reduction is desirable in order to improve the image definition.
= ( ( , )) (3)
! ( , )" = # 1 $ ( , ) < ℎ0 '(ℎ)*+ ,) - (4)
The FL threshold is associated with the TN threshold by
ℎ = / ∙ ℎ, where / ∈ [0,1] and is selected conveniently based on the image noise level.
Other simple parameters can be included in order to obtain measures of the image brightness. For instance, the higher and lower intensity magnitudes and their corresponding numerical difference, namely low level (LL), high level (HL) and dynamic range (HL-LL). It is also important to know the number of pixels that present those saturated intensities, defined respectively as low saturation (LS) and high saturation (HS) indices. In this case, a wide dynamic range as well as a reduced number of saturated pixels is desirable.
Moreover, an average luminosity (LM) value can be computed as shown in the following equation,
4 =1T l7∙ O7 9:
; <
(5)
where oi represents the number of pixels with li intensity level,
T the total considered pixels and L the total number of tonal values (e.g., 256). The LM optimal value corresponds to the mean value of the grey level scale used (e.g., 128).
Analogously, the statistical variance (V) of the grey level distribution is calculated according to equation (6). This index gives a measure of how the distribution spreads from the mean luminosity value.
> =1T [I(x, y) − LM] (6)
In addition, one last parameter based on the image histogram is included. This corresponds to the entropy value
(E), which deals with the histogram and the intensity distribution uniformity. Defining P(i) as the frequency of occurrences of the i level, normalized with respect to the total number of pixels, the E computation is defined as shown in equation (7).
F = − G( ) ∙ ln!G( )" G( ) ≠ 0
9:
; <
(7)
Finally, all the previous indices are combined in a quality penalization function Q. This allows assigning different weights [w1, w2…, w10] to the single parameters and therefore penalizing those undesirable variables tendencies spreading from the optimal values. By means of this definition, it is attainable to estimate the normalized relative quality of the images processed. The corresponding Q expression is presented in equation (8).
K = + ∙ : + + ∙ + +
L∙ F + +M∙ N + +O∙ PN
+ +Q∙ ∙ N + +R∙ (255 − P ) + +S∙ 4
+ +T∙ [(255 − (P − )] + +<∙ (1 − >) (8) The tuning-up process of the Q function requires an extensive set of experimental tests. In other words, the
definition of the weights values is not based on direct criteria but on practical experiences. Using trial results, it is likely to observe certain index tendencies related with their global importance on the image quality. For instance, the TN and LM indices are more significant than the E parameter; hence their respective weights must reflect this preponderance relation in the quality function. A constraint optimization method based on the interior-point algorithm [9] is used to determine the optimal weight values for each scene. The single parameters (Pi) are constraint by simple bounds of the type V ≤ G;≤ X (V, X ≥ 0), suitably defined for normalising the parameters contributions according to the previous knowledge gathered within the experimental observations.
B.System Learning and Scene Identification
Learning is a capability of entities with a certain level of intelligence. Nowadays, advances in engineering and computer science allow the implementation of artificial intelligence behaviours [10] and self-learning systems, which are usually based on neural networks, fuzzy logic and genetic algorithms. In fact, the proposed recognition module operates by means of a feedforward backpropagation neural network [11].
A multi-layer neural network (NN) can learn how to identify dynamic characteristics [12] and perform pattern identification with low error margins. In order to teach a NN how to respond to determined situations, it is necessary to provide specific examples of the possible occurrence scenarios, i.e., initial reference domains composed by the typical system’s inputs and targets.
In the image pre-processing approach, a set point routine is executed during the set-up phase of the program. Along this routine, some high quality images corresponding to the different possible scenarios are provided. A process of parameters extraction is performed and the resulting image indices constitute the NN’s inputs. Note that the image pixels themselves are not considered directly like inputs, but the image parameters. Then, the respective numbers of scenario represent the corresponding system’s targets (i.e., single numerical values: 1, 2, 3,... n). This phase constitutes the first network training.
The designed network is implemented using a feed-forward multi-layer architecture. The size of the hidden layer is determined by an iterative process until obtaining a desirable performance. For the case study, 11 nodes were considered as an appropriated size. The training process is based on the
backpropagation algorithm and the trainlm function [13]. Log-Sigmoid and Linear transfer functions are used respectively like activations for the hidden and output layers.
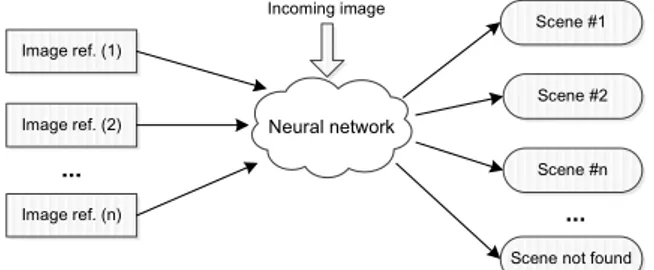
Notice that the incoming images could present indices that may differ from the scene reference ones. For this reason, the neural network intelligence is required to identify the coincidences and determine which scene number better describes the image properties. The algorithm is designed for accepting as valid matchings those with coincidence probability of at least 80%.
Fig. 2. Schematic of the Recognition Process
Moreover, an additional method is proposed in order to gather further information and improve the identification accuracy. The technique addressed is based on histogram matching, i.e., the incoming image's histogram is compared against the histograms of the reference images with the aim of detecting pattern coincidences. The resulting partial matches are quantified by calculating a chi-square metric value. Although this method is known as a non-optimal technique for scene recognition itself, its combination with the defined parametric indices improves the reliability of the system.
The recognition module allows the system to receive and process captured images in random orders according to the immediate system’s priorities, which permits the execution of dynamic supervision sequences running on multiple stations at a time. This property has an added value in the context of multi-agent systems in industrial quality control [8].
IV.ADAPTIVE QUALITY ENHANCEMENT MODULE After the image recognition process, the system counts with useful information to perform specific quality enhancements and update the current knowledge of the surrounding industrial environment. In this section the correction strategies implemented and their adaptive behaviour are presented.
A.Correction Strategies
The adaptive quality enhancement module is responsible for selecting the optimal strategy to process the incoming image. For this purpose, a comparison between the quality indices of the reference image (of the identified scenario) and the ones of the image in progress is performed. The resulting values reveal some parametric tendencies which are compared with defined symptom patterns, in this case related to contrast, sharpness and luminosity problems. Based on a max coincidence criterion, the main quality problem is found. If the program identifies multiple problems affecting the image in an equal way, the corresponding correction strategies will be executed sequentially.
This module implements three quality strategies, namely: contrast enhancement, luminosity correction and sharpness
enhancement. The functional structure and the methods applied in each one are based on a quality-execution time balance that comes from a manufacturing restriction: the available execution time is reduced and a determined minimum quality level is required. Since in the industrial application case study, the available time for multiple image processing rounds 20 s, it is defined that the pre-processing system dispose of approximately 2 s per image to execute the required correction routines. A brief explanation of the implemented strategies is presented below.
Contrast enhancement strategies seek to improve the apparent visual quality and emphasize specific image features [14]. In this approach, the task is performed by adaptive histogram equalization and morphological filters. The first procedure adapts the intensity scheme sharpening the image, but might tend to increase the noise. Consequently in a second step, morphological opening and closing operations are performed to reduce the noise without affecting the highlighted regions. The TN, FL and V parameters are analysed to detect contrast issues.
Image luminosity deficiencies may affect the identification of the structural scene components. For solving this problem, the designed luminosity strategy performs a histogram
adjustment. This method tunes up the intensity scale, correcting dark and overexposed regions. Luminosity problems can be identified by the E, HL, LL, HS, LS and LM indices.
Sharpness is close related with image focussing and defined edges. Well-focussed images will show distinct edges facilitating the contour detection. For the sharp enhancement strategy, blind deconvolution methods [15] were tested with successful quality results. However, the execution time required by these procedures exceeds the available task time. Laplacian filtering was also addressed, but the corresponding resulting images did not satisfy the defined quality criteria. Finally, unsharp masking [16] was tested, obtaining a good quality-time performance and accordingly this method was chosen for the strategy implementation. In this case, the TN, FL and E parameters are related with sharpness deficiencies.
After applying the quality strategies, the quality of the new enhanced image is calculated and it is determined if the resulting enhancement accomplishes the quality requirements, otherwise, a new image acquisition will be requested.
B.Quality and Parameters Updating
Robustness in industrial systems demands an extensive and updated knowledge of the production data. This information is fundamental for adapting to dynamic process changes and performing the most appropriate actions to achieve optimized results.
At the beginning of the designed system execution, the required reference scenes are composed just by a reduced ensemble of single images. Hence, the available information about the operation environment and the quality aspects are limited. To solve this issue, the adaptive enhancement module considers the history of the processed images to update the corresponding scene reference quality and parameters.
The updating contribution of a single processed image is controlled by a defined factor of preponderance, i.e., a scalar
Image ref. (1)
Neural network
Image ref. (2)
Image ref. (n)
...
Scene #1
Scene #2
Scene #n
Scene not found
...
weight. Conveniently, this constant is set to assigning a greater preponderance to the histo This consideration is fundamental in applica history records, e.g., industrial assembly lin hundreds or thousands of images per day. E (10) show the respective updating functions fo the indices vector.
K*)$(Z)+) = + ∙ K*)$ '[\ + ∙ K)Z VZ])
>*)$ Z)+^^^^^^^^^^^^^^^^^^^^^^^^^^_ + ∙ >*)$ '[\^^^^^^^^^^^^^^^^^^^^^_ + ∙ >`\)Z(`$`^^^^^^^^^^^^^^
This updating process refines the acc threshold, increases the available scene knowl the strategies converging to the optimal ones; h becomes more accurate. Furthermore, the r range tends to be narrow while more images ar
V.EXPERIMENTAL RESULTS The proposed approach was tested i production line producing washing machines.
A.First Stage: Performance and Quality
Along this experimental stage, the adaptiv system was tested to verify its performanc image scenarios. The response of the compon well as the system’s overall functions, was eva pre-processing of BMP format images with resolution.
In this approach, the architecture was codif MATLAB®. A significant part of the design
Neural Network, Global Optimization Processing toolboxes. Experimental tests using two different multi-core processors, nam @ 1.6 GHz and an Intel I5 @ 2.4 GHz. The provided below for the different tasks co arithmetic mean of the obtained results.
Experimental samples proceeding from scenarios were examined (see Figure 3). Defin composed by three of them at a time, as inp network (i.e. as reference images shown in Fig was simulated. As a result, an initial set p executed spending 4.7 s and the scene rec correctly recognized 99.7% of the sample im images analysed), i.e., either when the image matched as belonging to one of the three kno when, accurately, no possible match was foun time spent for this task rounds 500 ms.
Fig. 3. Experimental Image Scenarios An
set to a small value history of the system. pplications with large bly lines that analyse ay. Equations (9) and ions for the quality and
VZ])\ 9
>`\)Z(`$`)\ ^^^^^^^^^^^^^^^^_ 10
e acceptance quality knowledge and makes ones; hence the system the reference quality
ges are analysed.
ULTS
ted in an industrial ines.
daptive pre-processing rmance under diverse omponent modules, as as evaluated during the with a 1280 x 1024
codified and tested on design is based on the and the Image
tests were performed rs, namely, an Intel I7 z. The execution times ks correspond to the
from eight known . Defining an ensemble as inputs of the neural in Fig 2), the program set point routine was ne recognition module ple images (over 1800 image was effectively ee known scenarios or s found. The execution
os Analysed
On the other hand, the a module properly determined correction strategies according and the respective problem executions, the system show converging to the optimal strateg The execution time spent for this
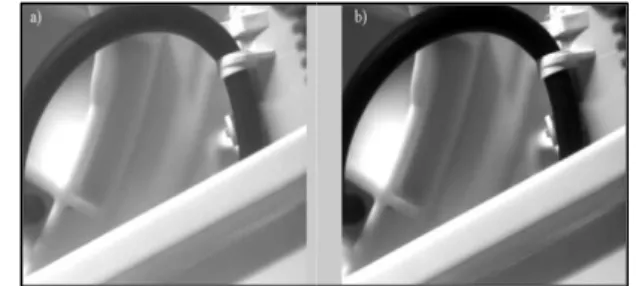
Figure 4 shows a quality enha of the contrast strategy execu intensity distribution makes the clearer and more defined for proc
Fig. 4. a) Original Image b) Enhanced I
Fig. 5. a) Original Image b) Enhanced I
In Figure 5 it is possible to after the application of the lumin Figure 6 illustrates the image qu sequential execution of the strategies. In both cases, the res highlight important regions in th
Fig. 6. a) Original Image b) Enhance Str
The quality improvements analysed are quantified in terms (in percentage), as shown in T represent the improvement of th the global quality. Note that p
the adaptive quality enhancement ined and performed customized rding to the image indices analysis blem identification. After several showed an adaptive behaviour strategies for the specific scenarios. or this task was 1.1 s.
ty enhancement performed by means execution. Clearly, the corrected es the structural image components or processing purposes.
nced Image by Contrast Strategy Execution
nced Image by Contrast Strategy Execution
ible to observe the results obtained luminosity correction strategy, and age quality enhancement by using a the contrast and the sharpness the respective corrections permit to s in the corresponding scenes.
hanced Image by Contrast and Sharpness Strategies
proper enhancements, while negative values undesirable changes.
TABLE I. IMPORTANT INDICES VARIA
Scenario TN FL LM DR
1 28.8 3.7 9.1 6.3
2 72.8 18.6 10.9 18.4
3 -4.1 3.2 32.2 0.4
4 88.6 5.9 31.4 2.3
5 54.5 8.5 72.8 36.5
6 19.4 8.2 -2.6 5.2
7 71.7 12.5 10.1 3.5
8 90.3 9.5 10.3 13.7
Since the overall system process was execu accurate recognition and enhancement resul architecture correctly accomplished the temp requirements.
B.Second Stage: Processing Recognition
During this stage, it is analysed if the qual achieved by the adaptive pre-processing exec effects on the performance of the poste algorithms.
In order to measure the resulting im inspection procedure based on geometric implemented on LabVIEW®. Experimental im different scene conditions (i.e., contrast, sharpness severe variations) are captured by system. The hardware used for the imag composed by: a robot DENSO vs-6577G, Prosilica GS1380 and a ring light Metaphase M
The recognition program implements an seeks to match a determined object or pattern generates a matching score in the range of [0 100 corresponds to a perfect match, while 0 m match. Besides, false identifications are pen corresponding negative scores [-100,0].
The testing procedure is focused on the experimental scenes (see Figure 7) which components of a washing unit that must be ve control purposes.
Fig. 7. Experimental Scenes
alues are related with
ARIATIONS
HS Q
2.4 95.2 -6.2 97.9 15.2 25.0 39.7 80.5 34.5 98.5 0.2 80.3 2.4 76.8 -3.7 90.9
executed in 1.6 s with results, the designed temporal and quality
quality enhancement execution has direct posterior processing
ing improvement, an metrical matching is ntal images exhibiting trast, luminosity and ed by a robot-camera image acquisition is 77G, a CCD camera hase MB-RL205. nts an algorithm that attern in the image and e of [0,100]. Note that ile 0 means no feasible re penalized with the
n the analysis of two hich expose different be verified for quality
The recognition algorithm w images before and after the ex procedure, and the respective ma Figure 8 shows the results of one case of severe contrast and malfunctioning of the ring l corresponding to the pre-pro significantly higher, leading to a passing from 36.57 to 84.97 for a
Fig. 8. Recognitio
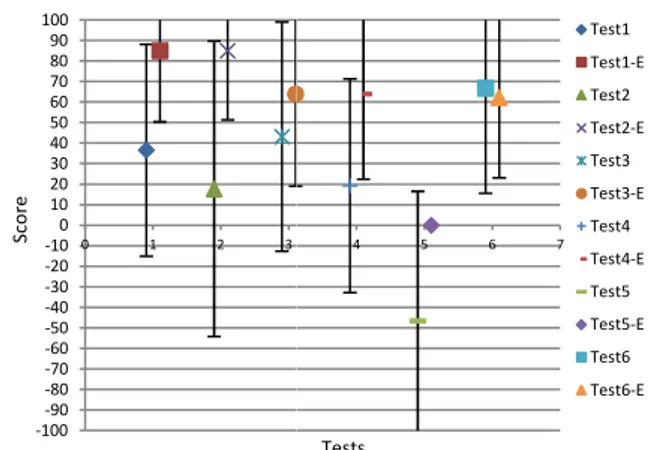
Figure 9 sums up the results explained in Figure 8. Score a standard deviations are presented
Fig. 9. Experimental Mat
The obtained results show a matching averages and reduction the images after the pre-processin Test*-E), implying a valuable inc reliability.
VI.CONC This paper addresses the system for the pre-processing of production scenarios with th effectiveness of the posterior insp The proposed system com module and an adaptive quality e module is responsible for the im
-100 -90 -80 -70 -60 -50 -40 -30 -20 -10 0 10 20 30 40 50 60 70 80 90 100
0 1 2 3
S
c
o
r
e
thm was applied to the experimental the execution of the pre-processing ive matching scores were registered. of one of the tests performed for the and sharpness problems due to ring light. Note that the scores processed images (after) are g to an increase of the overall score, 7 for an improvement of 48.4%.
ognition Enhancement
esults obtained in six tests as the one core averages and their respective sented.
al Matching Scores Summary
a significant increase of the uctions of the standard deviations in ocessing execution (represented by
ncrease of the detection
ONCLUSIONS
the development of an adaptive ing of images captured in industrial ith the aim of improving the or inspection algorithms.
comprises a scene recognition ality enhancement module. The first the image scene identification, while
4 5 6 7
Test1 Test1-E Test2 Test2-E Test3 Test3-E Test4 Test4-E Test5 Test5-E Test6 Test6-E
the second performs the customized selection and execution of correction strategies of contrast, sharpness and luminosity according to the image quality problems. This approach was tested by using real images captured in a washing machines production line. Experimental results show a robust system performance with short execution times (the pre-processing execution rounds 1.6 s, which is an appropriate time according to the maximum 2 s defined as requirement). Additional recognition tests demonstrate a significant increase of the scores averages and a diminution of the standard deviations, and as a result, a more reliable and robust identification process.
The introduction of the scene recognition method makes it possible to receive and process captured images in a random order according to the immediate system’s priorities, which allows the execution of dynamic supervision sequences running on multiple stations at a time. This implies a substantial change of the old-fashioned model of fixed inspections routines performed by independent supervision stations. Additionally, the successful implementation of the a pre-processing system that is capable of executing customized quality correction strategies and self-adapting, constitutes a contribution for the automated quality control in manufacturing processes.
As future work, the system architecture could be modified into a multi-thread prototype capable of performing parallel indices extraction and correction strategies executions. Moreover, additional image indexes can be addressed to increase the available image parameterization-data. Finally, alternative robust histogram matching methods are to be explored.
ACKNOWLEDGMENT
This work has been financed by the EU Commission, within the research contract GRACE No. NMP2-SL-2010-246203 coordinated by Univ. Politecnica delle Marche and having partners SINTEF, AEA srl, Instituto Politécnico de Bragança, Whirlpool Europe srl and Siemens AG.
REFERENCES
[1] C. Spinola, J. Cañero, M. Martin, J. Bonelo, F. Garcia, G. Moreno, S. Espejo, G, Hylander, J. Vizoso, "Image processing for surface quality control in stainless steel production lines", Proc. IEEE Int´l Conf. on Imaging Systems and Techniques, pp.192-197, 2010.
[2] A. Barth, R. Herpers, M. Gressnich, "Real-time applicable visual quality control in industrial line production", Int´l Conf. on Advanced intelligent mechatronics pp.1-6, 2007.
[3] H. Akbar, A. Prabuwono. "The Design and Development of Automated Visual Inspection System for Press Part Sorting," Int´l Conf. on Computer Science and Information Technology, pp.683-686, 2008
[4] M.A. Aguilar, A.J. Arguelles, C. Yanez, "A Real time Artificial Vision Implementation for Quality Inspection of Industrial Products", Proc. Conf. on Electronics, Robotics and Automotive Mechanics, pp. 277-282, 2008.
[5] G. Ying, L. Miao, Y. Yuan, H. Zelin, "A Study on the Method of Pre-processing for Recognition of Crop Diseases", Proc. Int'l Conf. on Advanced Computer Control, pp. 202-206, 2009. [6] I. Lopez, J.I. Lopez, R. Osorio, "Robot Vision Methodology for
Assembly Manufacturing Tasks", Proc. Conf. on Electronic, Robotics and Automotive Mechanics, pp.289-294, 2007. [7] V. Murino, G.L. Foresti, C. Regazzoni, "Adaptive Camera
Regulation for Investigation of Real Scenes", IEEE Transactions of Industrial Electronics, 43(5), pp. 588-600, 1996.
[8] L. Stroppa, N. Rodrigues, P. Leitao, e N. Paone. Quality control agents for adaptive visual inspection in production lines. Proceedings of IECON’12, pp. 4334-4339, 2012.
[9] MathWorks. Optimization Toolbox User's Guide R2012a.
MathWorks Inc, 19902012.
[10]L. Xian, "Artificial Intelligence and Modern Sports Education Technology", Proc. Int'l Conf. on Artificial Intelligence and Education, pp. 772-776, 2010.
[11]W. Xianmin, "Research of Neural Networks in Image Anomaly Identification Application", Proc. Int’l Conf. on Computational and Information Sciences, pp.133-136, 2011.
[12]D.H Nguyen, B. Widrow, "Neural Networks for Self-learning Control Systems", IEEE Control System Magazine, 10(3), pp. 18-23, 1990.
[13]M. Hudson, M. Hagan, H. Demuth, "Neural Network ToolboxTM User's Guide R2011b", MathWorks Inc.
[14]R. Lakshmanan, M. Nair, M. Wilscy, R. Tatavarti, "Automatic Contrast Enhancement for Low Contrast Images: A comparison of Recent Histogram Based Techniques", Proc. Int'l Conf. on Computer Science and Information Technology, pp. 269-276, 2008.
[15]D. Krishnan, "Blind Deconvolution using Normalized Sparsity Measure", Proc. of the IEEE Computer Vision and Pattern Recognition, pp. 233-240, 2011.
[16]R.C. Gonzalez, R.E Woods, "Digital Image Processing", 2nd ed. Prentice Hall, New Jersey, 2002.