A Work Project, presented as part of the requirements for the Award of a Masters Degree in Management from the NOVA – School of Business and Economics.
Corporate Performance and the Pay Gap
Jose Ollero Oliveira 1928
A Project carried out on the Corporate Governance course, under the supervision of:
Professor Ana Marques
03/06/2015
Corporate Performance and the Pay Gap
ABSTRACT:
Increasing disparity between executive compensation and that of the average worker (the pay gap) has generated a fierce debate about its causes and effects. This paper studies the determinants and performance effects of the pay gap through the prism of Tournament Incentives and the Equity Fairness Theory. Results show that the size of the pay gap is caused primarily by the size of the firm and by the standards of its industry and also by the unionization rate and whether the Chairman is also the CEO. The paper Concludes by showins that the pay gap has a positive effect on firm performance in the United States
Keywords: Executive pay multiple, Tournament Incentives; Pay disparity; Equity Fairness
Introduction
New rules proposed by the American stock market regulator, the Securities and Exchange Commission (SEC), will for the first time mandate the disclosure of the gap between the pay of a company’s CEO and its top executives and the median income of its employees. These new rules were meant to be implemented alongside the Say on Pay provisions of the Dodd-Frank act (2010) which established for the first time the right of Shareholders to vote on the compensation practices of their firms.
However they have been fought vigorously by advocacy groups which have managed to delay their implementation. In November 2014 Mary Jo White, the head of the SEC said she hoped the rule would be implemented by the end of the year, yet as of February 2015 the rules have not been implemented (Sorkin, 2015).
There are two schools of thought regarding the disparity in compensation between executives and employees. The Tournament theory suggests that large gaps will motivate employees to work hard for a chance to rise through the ranks and reap the rewards, while the Equity Fairness theory defends that a smaller gap will be more efficient as it will increase morale, cooperation and teamwork.
In this research project I address this issue by examining two key questions; what factors explain the disparity between CEO pay and low level employees and what effect if any does this disparity has on the firm’s performance.
The primary measure of the pay gap is the Average Executive Pay Multiple, this multiple is the ratio of the three year average CEO and employee pay which I calculate based on individual firm executive compensation disclosures to the Securities and Exchange Comission and industry wide data employee pay data released by the Bureau of Economic Analysis of Statistics for a sample of 416 non-financial S&P 500 firms over the 2011-2013 periods.
The analysis begins with a test for possible determinant variables for the Average Executive Pay Multiple under the hypothesis that the relative pay of the CEO versus the average worker is determined by the size, industry and risk level of the firm
and by the relative bargaining position of both the workers and the CEO as suggested by prior research from Hyun et al. (2012) and Faleye et al. (2012).
The results show that only firm size and industry are capable of determining the size of the pay gap with a very high degree of significance (99%), the relative bargaining power hypothesis is also shown to have an effect with both the unionization rate of the workforce and the existence of a Chairman of the Board – CEO dual role being significant albeit at a lower level (85%).
Contrary to expectations other corporate governance factors such as Board size, the percentage of independent directors and the frequency of meetings were shown to have no effect on the pay gap.
The financial leverage rate and the level of R&D spending were also shown to have no significant correlation with the Average Executive Pay Multiple, indicating that either they are not good proxies for firm risk and workforce specialization respectively or that these are not relevant factors in determining the pay gap.
Next I analyze the second key question and seek to determine whether the pay gap has any effect on corporate performance, to do this I attempt to establish a correlation between the firm’s performance variables Return on Assets and Return on Equity and the pay gap variable Average Executive Pay Multiple Hypothesizing that along the lines of the Tournament Theory (Lazear and Rosen, 1981) there should be a positive correlation between the pay gap and firm performance.
I find that there is a statistically significant positive correlation between the Average Executive Pay Multiple and both Return on Assets and Return on Equity, suggesting that at least in the case of the United States the positive effects of vertical pay disparity as proposed by Tournament Theory outweigh negative effects of inequality within firms.
I then compare these results to those of a similar study conducted in South Korea by Hyun et al. (2012) where they found that vertical pay disparity had negative effects on the performance of Korean firms, this discrepancy leads me to posit that workers respond to inequality differently in different countries dependent on the societal context around them,
workers in highly unequal countries like the USA respond positively to inequality due to having an unequal society as an internal reference point and workers in countries like South Korea respond negatively to inequality as their societal reference point clashes against what they experience inside a firm with large vertical pay disparities.
These results contribute to the existing literature in two distinct ways, first it adds to the efforts to identify which factors are or are not responsible for causing pay disparity within firms and second it provides a new data point on the firm level performance effects of increased inequality and establishes comparisons between the differing cases of the United States and South Korea.
Literature Review
The disparity between executives’ pay and workers’ compensation has been the subject of academic research for several decades. While researchers agree that this disparity has risen dramatically, from an estimated 20-1 pay ratio in 1950 to more than 200-1in 2010 (Smith and Kuntz, 2013), the causes and effects of the pay gap are not completely clear.
Firms adopt a wide variety of compensation structures, featuring different levels of pay disparity both among peers (horizontal disparity), and between different ranks within the company (vertical disparity). Studies on pay disparity have mostly been focused on the disparity between peers and have found that pay disparity on a horizontal level is frequently detrimental to the success of the firm, generating unhappiness among the least compensated members and threatening organizational cohesion in groups. These studies have focused on a diverse range of subjects from top management executives (Cowherd and Levine, 1992) to university professors (Pfeffer and Langton, 1993) and professional athletes (Bloom, 1999).
The theoretical framework of the studies into vertical compensation disparity has two distinct trains of thought. The first, which is based on economic game theory, looks at compensation structures as a sequential rank order tournament, and posits that the pay disparity between lower level and higher level employees is a positive characteristic which will lead the lower level employees to exert more effort in order to try and win
promotion to the higher ranks of the firm (Lazear and Rosen, 1981). The pay disparity is also justified as a tool to attract and retain top talent to the higher ranks of the company (Bloom and Michel, 2002). The second line of thought looks at the pay gap through the lens of behavioral economics and equity theory (Adams, 1965). Equity theory states that people expect pay to be distributed according to relative contribution and that each individual constantly compares their own contribution and rewards relative to their individual reference group. This reference group does not need to consist only of their peers (Kulik and Ambrose, 1992) but will also include those above and below them in the organization as well as members of other organizations. Individuals perceive their outcomes to be unjust when their ratio of input to outcomes falls out of line with their reference points. Through this mechanism the pay gap can generate a feeling of inequity within the organization. Employees may then attempt to correct this feeling of inequity (Cowherd and Levine, 1992). In order to do so they can alter their own internal perceptions or their reference points, alter their inputs to put them in line with what they believe their outcome justifies, or they can simply leave the firm. The last two behaviors are negative, from the point of view of the firm, and several studies have shown that they will lead to decreased productivity (Bolton and Ockenfels, 2000), lower product quality (Cowherd and Levine, 1992), as well increased turnover (Bloom and Michel 2002).
The empirical study of executive-employee pay disparity has been hampered by lack of available data; the few studies that have attempted to quantify the performance effect of vertical pay disparity have given mixed results and have operated with limited data, most of them restricted to analyzing a subsection of the executive suite and the CEO rather than looking at the company as a whole. Examples of such studies are Conyon et al. (2001), Heyman (2005), Kale et al. (2009), all of which support the performance enhancing effects of pay gaps. Other studies (Siegel and Hambrick 2005; Bebchuk et al. 2011) find empirical evidence that pay compression in the executive suite increases firm performance.
The most comprehensive study of the determinants of the executive pay multiple over the average worker and its effect on performance came from the Republic of Korea by Hyun et al. (2012) where stock exchange rules mandate the disclosure of the average worker’s compensation and give researchers access to a unique data set. Utilizing
annual report disclosures from 2000 to 2009, the authors find a statistically significant negative correlation between the executive pay multiple and the operating and stock return performance of a firm. They also find that the pay gap is positively correlated with the size of the firm and with a lack of oversight from the board of directors. Finally, the authors find that the pay gap varies greatly between different industries and that it is negatively correlated with worker union membership, CEO tenure, employee tenure and the probability of promotion for the companies Vice Presidents.
Despite the apparent strengths of this study it may not be possible to generalize their findings to other corporate environments, due to the particular nature of South Korean society. South Korea is a highly egalitarian society (second lowest income inequality in the G-20 as measure by the Gini Coeficient, only behind Germany, Quandl 2014) which places a lot of pressure on executive compensation (average pay gap in 2010 is of 48-1 for companies quoted in the South Korean stock market) preventing the kind of extreme disparities that you find in many other countries like the USA.
Notwithstanding the lack of disclosure from American firms there are two recent studies that have tried to empirically test the effects of the pay gap.
The first analyzes bank holding companies (Crawford et al. 2014), which are mandated by law to disclose all worker compensation since 1995, as this allows for the estimation of averages; the second is based on data voluntarily released from S&P 1500 firms ( Faleye et al. 2012). Faleye et al. (2012) finds that less than 10% of all firms quoted in the S&P1500 disclose any information about employee pay. From that limited and self-selecting sample they find evidence that the pay gap is largely explained by the relative bargaining power of executives versus employees. In companies with strong boards executives find it harder to excessively reward themselves, while in companies with strong unions and highly skilled workers employees are able to drive up the price of their labour. This is broadly in line with the findings of the Korean study. However, in the American sample the authors do not find any evidence of a negative impact on corporate performance arising from the pay gap. This is contrary to what was found by Hyun et al. (2012) The impact of unionization rates is a possible cause for this discrepancy, as Faleye et al. (2012) find that they are a significant drag on performance while Hyun et al. (2012) do not find a correlation
between the unionization rates of South Korean workers and the performance of South Korean firms.
The recent study by Crawford et al. (2014) finds a concave relationship between performance and the pay gap. Thus, up to a point firms benefit from the tournament incentives that vertical pay disparity provides, but at extreme levels firms start to perform worse. These firms are also taking significantly greater risks and face greater dissent in Say on Pay votes from shareholders. They also find that the median pay gap is lower than the average for bank holding companies and those bank holding companies which are not quoted in the S&P1500 have a median pay gap of only 7.5-1 as opposed to 34-1 for S&P1500 bank holding companies. This is in line with previous findings, where the size of the firm was one of the main determinants of the pay gap.
Institutional Setting
Executive compensation practices in the USA have changed dramatically since the end of World War 2. This increase began in the mid 1970’s, which mark the end of the great compression, an era that began after WW2 and during which relative income between top, mid, and lower ranking workers remained relatively stable. Yearly increases for executive compensation went from 3.1% in the 1970’s, to 5.6% in the 1980’s, to 18.5% in the 1990’s ( Frydman and Saks, 2005). This change was fueled primarily by the decrease in top marginal tax rates and by the adoption of incentive pay, according to the landmark Harvard Business Review article by Jensen and Murphy (1990):
“The compensation of top executives is virtually independent of performance. On average, corporate America pays its most important leaders like bureaucrats. Is it any wonder then that so many CEOs act like bureaucrats rather than the value-maximizing
entrepreneurs companies need to enhance their standing in world markets?”
Incentive pay, mostly in the form of stock options but also in salary bonuses and Long Term Incentive Plans, became an increasingly large share of total compensation for executives during the following decades. It came under increased scrutiny after the two market crashes of the 2000’s: first with Sarbanes-Oxley (2002) and more recently
with Dodd-Frank (2010). Both initiatives mandate greater transparency and oversight over the level and structure of executive compensation.
Disclosure laws mandate that every firm quoted in capital markets must include in its annual reports details on all compensation to its CEO and its top 5 highest earning executives. Say on Pay provisions in Dodd-Frank mandate that executive compensation be put up for a (non-binding) shareholder vote, and not simply approved by the board of directors’ compensation committee.
In contrast, worker compensation practices are subject to very little transparency, Dodd-Frank attempted to remedy this problem by mandating disclosure of the median workers wage and of the ratio between the median worker compensation and that of its CEO executives under Section 953(b).
However despite being first proposed by the SEC on September 2013, it has yet to be implemented.
The opposition comes from corporations, who argue that the rule only intends to shame them over their enormous pay gaps and more practical concerns as to how exactly to calculate the median wage of the workers for large multinational corporations, have kept the proposal from being put into practice (Sorkin, 2015). Therefore, all information about worker compensation for US firms is only disclosed on a voluntary basis.
Sample
Given the data availability constraints the sample will only include S&P500 companies from the years 2013, 2012 and 2011. Because of executive compensation disclosure laws all executive compensation data for all S&P500 companies is available through the Bloomberg database and Compustat, as well as key financial indicators such as Return on Assets (RoA) which we will use to assess corporate performance.
Financial firms are excluded from the sample, due to differences in the way these firms are regulated, which alter accounting performance metrics such as RoA. With these restrictions the final corporate sample includes 416 S&P500 firms, and 1,228 firm years,
Due to the lack of disclosure on worker pay a proxy estimate must be used to calculate the pay gap of each corporation. This proxy is calculated from industry
specific data which gives us the closest possible approximation of the average worker compensation of each firm. Using the Bureau of Economic Analysis National Income and Products database we take the yearly average wages per full time worker equivalent for a given industry and ponder it by the industry benefits to wages multiplier, which equals the average yearly compensation per worker for a given industry.
The industry of each company is determined using the Bloomberg Industry Classification System (based on the firm’s revenue sources) and matching it to the North American Industry Classification System, which the Bureau for Economic Analysis uses (Bloomberg; Blair et al., 2013)
Methodology
Based on previous studies in South Korea and the United States from Hyun, Kang et al. (2012) and Faleye et al. (2012) I specify a model which will allow me to discern the determinants and the performance effects of vertical pay disparity. Below is a description of the vertical pay disparity proxy as well for each of the key variables
Average Executive Pay Multiple
Calculated as the ratio of the three year average executive and worker compensation for each of the 416 non-financial firms for which data is available, this is the proxy for vertical pay disparity.
Average CEO Compensation
Calculated as the three year average of CEO compensation for 416 S&P 500 firms taken from 1228 samples in the years 2011-2013, the sample includes all forms of compensation including bonuses, stock options and all the expected value of all deferred compensation agreements. (The Source is the COMPUSTAT’s EXECUCOMP database, , units in thousands of dollars).
Average Employee Compensation
Calculated as the three year average of yearly compensation per worker for 416 S&P firms. (The source is the Bureau of Economic Analysis National Income and Products, units in thousands of dollars).
Corporate Governance
Research from Hyun, et al. (2012) and Faleye et al. (2012) indicates that corporate governance should have a significant impact on the ability of the CEO to extract greater compensation from shareholders and should therefore be a significant factor on the size of the vertical pay disparity where firms with weaker corporate governance exhibit a larger Average Executive Pay Multiple. This model will look at the impact that corporate governance has on the Average executive pay multiple through five different corporate governance indicators
Board Size
Calculated as the three year average Board of Directors size for 416 S&P 500 firms from 2011 to 2013. (The Source is the Spencer Stuart Board Index.) This variable is expected to be negatively correlated with the Average Executive Pay Multiple as a larger board should make it more difficult for the CEO to exert undue influence on the board a whole.
Percentage of Independent Directors
Calculated as the average percentage of independent directors in each Board of Directors for 416 S&P 500 firms over 2011-2014. (The Source is the Spencer Stuart Board Index.) This variable is expected to be negatively correlated with the Average Executive Pay Multiple as a greater percentage of directors with no relation to the firm should make the board more objective relative to the CEO and their compensation.
Meetings per year
Calculated as the average number of times per year the Boards of Directors of 416 S&P500 firms have met during the three year period 2011-2013. (The Source is the Spencer Stuart Board Index.) This variable is expected to be negatively correlated with
the Average Executive Pay Multiple as a higher number of meetings per year is indicative of an active Board making it less likely that the CEO could exert undue influence through Board negligence.
Chairman-CEO
A dummy variable indicating whether the CEO is also the Chairman of the Board. (The source is the Spencer Stuart Board Index.) This variable is expected to be positively correlated with the Average Executive Pay Multiple as a Chairman-CEO will have greater influence on other board members and greater ability to set his own compensation level.
Company and Workforce characteristics
The characteristics of the firm itself and its workforce are have been shown by both Hyun, et al. (2012) and Faleye et al. (2012) to be significant in determining the disparity between worker and CEO compensation. Smaller companies which operate in industries which require a more specialized workforce or who have a higher unionization rate should have a lower Average Executive Pay Multiple and companies which can replace workers easily and have larger sizes are expected to have larger pay disparities. Below are five variables which serve as proxies for the size, industry and workforce effects on the Executive Pay Multiple.
Average Workforce Unionization Rate
Calculated as the average percentage of the workforce which belongs to a union, estimate based on industry wide data taken over a three year period 2011-2013. (The Source is the Bureau of Labor Statistics.) This variable is expected to be correlated with a lower Executive Pay Multiple as a unionized workforce should have greater bargaining power leading to higher wages relative to the CEO.
Average Yearly R&D Spending
Calculated as the three year average of R&D Spending for each of 416 S&P 500 companies during the years 2011-2013. (The source is COMPUSTAT’s Financial Statements Database, , units in thousands of dollars) This variable serves as a proxy for
the level of education and ease of replacement for a given companies workforce as firms with higher R&D spending require highly skilled employees which are more highly educated and harder to replace.
Average Firm size
Calculated as the three year average of Revenue for each of 416 S&P 500 firms. (The source is COMPUSTAT’s Financial Statements Database, units in thousands of dollars) This variable is expected to be positively correlated with the Executive Pay Multiple as a larger company is more complicated to manage and requires a better CEO which according to tournament theory will lead to greater compensation for the top in order to both incentivize talented lower ranking employees to climb up the ladder and attract talented CEO’s from other firms.
Average Industry Pay Multiple
Calculated as the average Executive Pay Multiple for each of each industry that the 416 S&P500 companies belong to over the 2011-2013 period. This variable should have a very strong effect as each individual industry has different supply and demand constraints that are common to all companies in that industry and which will greatly influence the size of the Executive Pay Multiple all other things equal.
Company Leverage
Calculated as the three year average of Long term debt divided by Total Assets for each of the 416 individual companies of the S&P 500 that are part of the sample. (The Source is COMPUSTAT’s Annual Financial Statements Database.) The effect this variable has on the Executive Pay Multiple is uncertain, higher leverage means higher risk which can have effects on both the workforce and CEO compensation as they have to be adjusted to match that risk. Both the workforce and the CEO will demand more compensation in order to make up for the risk of bankruptcy and the harm it will cause them as well as the additional challenge of managing a highly leveraged company.
Calculated as the three year average of the ratio of Operating Income to total Assets for each of the 416 individual S&P500 firms that are part of the sample. (The source is COMPUSTAT’s Annual Financial Statements Database.) This variable is a measure of the firm’s performance and the expected correlation of this variable to the Executive Pay Multiple is unknown. According to Tournament theory the correlation should be positive as strong tournament incentives will lead to firms with a large Executive Pay Multiple performing better than other firms; however the Equity Fairness theory predicts that a high Executive Pay Multiple will lead to discontent and lower efficiency from the employees resulting in a negative correlation with Average Return on Assets.
Return on Equity
Calculated as the three year average of the ratio of Operating Income to Shareholders’ Equity for each of the 416 individual S&P500 firms that are part of the sample. (The source is COMPUSTAT’s Annual Financial Statements Database.) This variable measures the firm’s performance and like Average Return on Assets its expected correlation to the Executive Pay Multiple is unknown.
Descriptive statistics
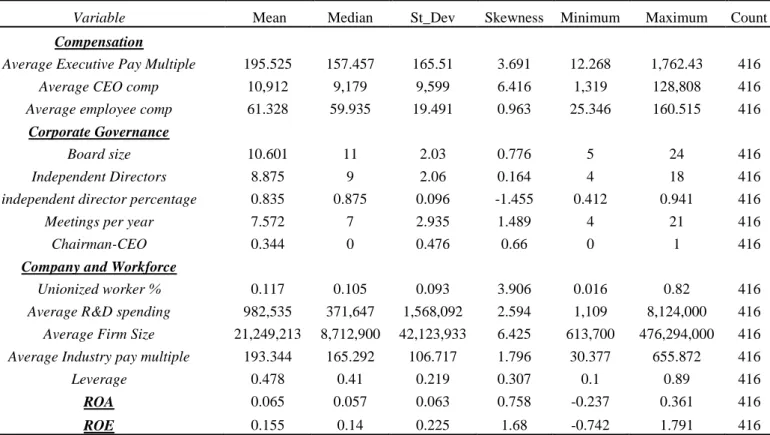
Table 1 Shows the summary statistics of the key variables for Compensation, Corporate governance and Company and workforce characteristics. The Average Executive Pay multiple is not a normal distribution, it has a positive skew of 3.691 and a very high standard deviation of 165.51, larger than the median value of just 157.456 indicating that the Average Executive Pay Multiple has a long tail of companies with very high pay gaps that contribute significantly to skewing the distribution, these companies are Apple INC, with the highest multiple of 1752.429 and Oracle Cop and CBS Corp which have multiples of over 1000 each, These are also the three firms with the most well compensated CEO’s over the 3 year period.
There is also a lot of variation in the board composition with companies having as many as 24 directors or as few as 5, with a median size of 11. Of those 11 members of median board a full 87.5% are independent, indicating a very high degree of
independence from the boards, much higher than you can find in the case of South Korea where the median board has 6.4 members and only 35% of whom are independent (Hyun et al. 2012). In our sample 34.4% of those boards have a Chairman-CEO and half of them meet at least seven times per year.
There is a low degree of unionization among workers in the 416 S&P 500 firms in the sample, workers in these companies have a median unionization rate of just 10.5%, only a little more than one third of the unionization rate of South Korean firms which stands at 29.5% (Hyun et al. 2012) an outcome broadly in line with Faleye et al. (2012).
Average Industry pay multiple statistics broadly reflect the individual Average Executive Pay Multiple, indicating that industry standards are key in understanding the pay gap.
Table 1 - Descriptive statistics for Compensation, Corporate Governance and Company and Workforce Variables
Variable Mean Median St_Dev Skewness Minimum Maximum Count
Compensation
Average Executive Pay Multiple 195.525 157.457 165.51 3.691 12.268 1,762.43 416
Average CEO comp 10,912 9,179 9,599 6.416 1,319 128,808 416
Average employee comp 61.328 59.935 19.491 0.963 25.346 160.515 416
Corporate Governance
Board size 10.601 11 2.03 0.776 5 24 416
Independent Directors 8.875 9 2.06 0.164 4 18 416
independent director percentage 0.835 0.875 0.096 -1.455 0.412 0.941 416
Meetings per year 7.572 7 2.935 1.489 4 21 416
Chairman-CEO 0.344 0 0.476 0.66 0 1 416
Company and Workforce
Unionized worker % 0.117 0.105 0.093 3.906 0.016 0.82 416
Average R&D spending 982,535 371,647 1,568,092 2.594 1,109 8,124,000 416
Average Firm Size 21,249,213 8,712,900 42,123,933 6.425 613,700 476,294,000 416
Average Industry pay multiple 193.344 165.292 106.717 1.796 30.377 655.872 416
Leverage 0.478 0.41 0.219 0.307 0.1 0.89 416
ROA 0.065 0.057 0.063 0.758 -0.237 0.361 416
Empirical Tests
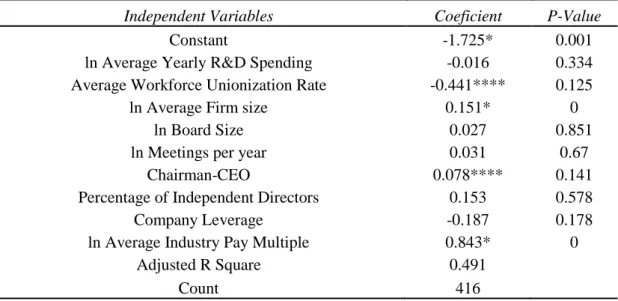
In order to test the determinants of the pay gap I estimate regressions of the natural log of the Executive Pay Multiple on all the determinant variables. The regression equation is built similarly to the pay gap determinant regression performed by Hyun et al. (2012) on South Korean firm to try and obtain comparable results.
The results obtained in Table 2 show that the executive pay multiple is positively correlated with firm size, board size, meetings per year, Whether the chairman is the CEO, the percentage of independent directors and the Average industry pay multiple. We see as well that the executive pay multiple is negatively correlated with Average Yearly R&D Spending, the worker unionization rate as well as the company leverage.
Table 2 - Regression Estimating the determinants of theAverage Executive Pay multiple
Independent Variables Coeficient P-Value
Constant -1.725* 0.001
ln Average Yearly R&D Spending -0.016 0.334 Average Workforce Unionization Rate -0.441**** 0.125
ln Average Firm size 0.151* 0
ln Board Size 0.027 0.851
ln Meetings per year 0.031 0.67
Chairman-CEO 0.078**** 0.141
Percentage of Independent Directors 0.153 0.578
Company Leverage -0.187 0.178
ln Average Industry Pay Multiple 0.843* 0
Adjusted R Square 0.491
Of these results however only two variable correlations can be said to be significant with a very high degree of certainty (greater than 99%), those are the positive correlations of the Average Executive Pay multiple and the Average firm size and industry multiple, of the remaining variables only the Average Workforce Unionization Rate and the Chairman-CEO have a reasonable degree of statistical significance (greater than 85%). The remaining variables have a P-value greater than 0.15 and are therefore statistically insignificant.
The Model as a whole has an Adjusted R Square of 0.491 meaning that the independent variables explain 49.1% of the total variability of the response data around the mean, this explanatory power comes from the four variables mentioned above that are statistically significant.
These Results are consistent with the findings of Hyun et al. (2012) and Faleye et al. (2012) that show that the size of the firm is one of the primary determinants of the vertical pay disparity and follows the line of Bebchuk and Grinstein (2005) which shows that firm size is the greatest determinant of CEO compensation. Larger firms have higher CEO compensation in order to try and attract higher quality executives from smaller firms.
As expected the Executive Pay Multiple is heavily correlated with the Industry Pay Multiple, both worker and CEO compensation are similar within industries leading to similar pay gaps. This is consistent with the expectations from previous studies as well as with the Equity Fairness theory where people’s expectations of what they should earn is constrained by their peers, meaning that not only will lower level workers demand similar compensation to other low level workers in that industry but the CEO, who has the greatest bargaining power of anyone at the firm, will do so as well.
Table 2 also shows that Average Unionization Rate is a major drag on the size of the Average Executive Pay Multiple, the increase in the bargaining position of the workers vis-à-vis the corporation leads to higher average wages and pressure from the unions also impacts the CEO’s ability to make wage demands (Olubunmi Faleye et al. 2012). The major negative impact of the Unionization Rate on the vertical pay disparity of corporation’s sugests that policies to increase the unionization rate can be effective in fighting growing inequality.
The dual role of Chairman-CEO has long been under fire for the perceived conflict of interest and the undermining of checks and balances within the firm (Noam Noke, 2012, here we see evidence that there is indeed a cost to the Dual role, having a single individual occupying the seat of the Chairman and the CEO is a statistically significant determinant of the Average Executive Pay Multiple. Having the CEO as Chairman puts the CEO in a better bargaining position versus the compensation committee and the shareholders enhancing the CEO’s ability to extract income gains from his position and making it harder for the board to stay independent (Olubunmi Faleye et al. 2012). This makes yet another strong case for splitting the Chairman-CEO role to create a more independent board and fight market failure in the form of a board of directors captured by the CEO.
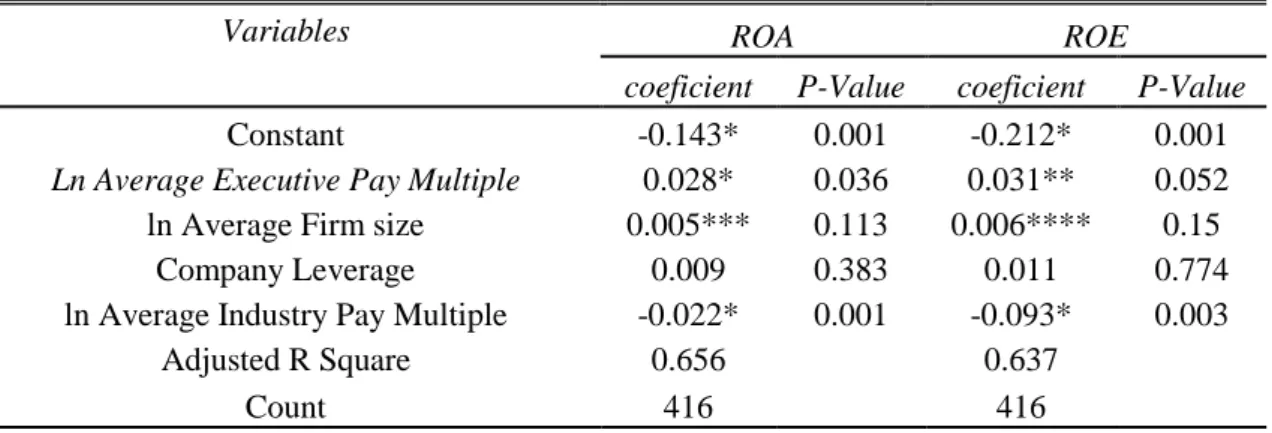
In order to test the performance effects of the pay gap I estimate regressions of Return on Assets and the Return on Equity on the Executive Pay Multiple as well as all the other company characteristics.
In Table 3 Below we see the results of these regressions; they show a small but statistically significant positive correlation between ROA and ROE and the Average Executive Pay Multiple (greater than 95% and 90% respectively). This is consistent with the Tournament Hypothesis and with the findings of Faleye et al, (2012), which showed that for his self-selecting sample of American firms there was a positive correlation between vertical pay disparity and performance.
Table 3 - Regression estimating the performance effects of the Average Executive Pay Multiple
Variables ROA ROE
coeficient P-Value coeficient P-Value
Constant -0.143* 0.001 -0.212* 0.001
Ln Average Executive Pay Multiple 0.028* 0.036 0.031** 0.052
ln Average Firm size 0.005*** 0.113 0.006**** 0.15
Company Leverage 0.009 0.383 0.011 0.774
ln Average Industry Pay Multiple -0.022* 0.001 -0.093* 0.003
Adjusted R Square 0.656 0.637
Count 416 416
Assuming that these results are broadly accurate we can see a clear difference in the effects of the pay gap between the Korean corporations and the American corporations.
In Korea, a society with low inequality, companies with more unequal pay distributions are hindered by their pay practices according to Hyun et al. (2012) however in America the effects of the pay gap appear to be positive. This indicates that there are significant differences in the worker preferences and attitudes between South Korea and the USA and highlights the role of cultural as well as psychological factors in the performance of firms especially between different societies.
It also raises the possibility that the pay gap may simply be a symptom of wider societal inequality and more unequal societies condition workers into accepting greater inequality in their firms by impacting the reference points that these workers use for comparison. Being confronted with a level of vertical pay disparity that is common in American firms would greatly upset South Korean workers potentially leading to disparity reducing actions like forming a union or perhaps go on strike which would harm firm performance, something which does not happen often in the United States.
Tackling the issue of inequality would then be better off done outside of the firm by changing people’s expectations and reference points for example via highly progressive taxation than within it through stronger unions or pay caps for CEO’s.
Conclusion
Inequality has become the major socio-economic issue of today and the relative compensation of top executives versus the average worker has been thrust into the political spotlight. New measures proposed by the SEC that will force companies to officially disclose their pay gap are being adamantly opposed by major US corporations which argue that these disclosures are useless and that any measure that will try to actively suppress the pay ratio is harmful to companies.
Academic Literature is divided on the topic, evidence suggests that firms can both benefit and be harmed by vertical pay disparity depending on the contextual reactions of the employees, either by becoming incentivized via tournament incentives, or demoralized through a sense of inequity and unfairness.
This paper tries to shed some clarity on the issue by gathering and analyzing data from the firms current mandatory disclosures combined with industry wide data on the vertical pay differential between the average employee and the CEO of non-financial firms from the S&P 500 index.
In addition to compensation data a series of corporate governance metrics including the number of board members, their independence, the frequency of their meetings and whether or not the Chairman is also the CEO are analyzed to determine to what extent corporate governance contributes to the pay gap.
Workforce and corporation characteristics such as the Unionization Rate, the firm size, the financial leverage and the R&D spending of the firm are also used to attempt to discern causal effects on the pay gap.
The results indicate that the pay gap in the United States is primarily caused by the size of the firms as well as by the relative bargaining power of the CEO and the employees. Unionized employees bring down the pay disparities within a firm and a Chairman-CEO increases them through a stronger bargaining position.
The pay gap is also heavily impacted by the size of the industry specific multiplier.
This paper also finds a small but positive relationship between performance and the pay gap in, in contrast to the situation in South Korea where the pay gap leads to a significantly lower performance. Inequality within firms appears to have significantly
different effects depending on societal environments, firms in societies with high inequality experience positive effects from a large executive pay multiple and firms in societies with low inequality experience the opposite.
More data points are needed to corroborate this theory and a more conclusive analysis of this issue can only be done through widespread access to firm specific employee compensation data which firms do not want to disclose, the study conducted in South Korea suggested that these disclosures would lead to harmful revelations however a picture is beginning to emerge and at least in the United States it is not necessarily negative towards the impact of inequality in firms.
This paper adds to that picture showing that the relationship between the executive pay multiple and the firms’ performance is positive and that the tournament incentive effect may dominate when it comes to vertical pay disparity in American corporations.
A suggestion for future research is to look within individual industries and see for which industries the positive performance effects of the pay gap hold and discover if there are differences in the performance effects of the pay gap for firms in industries with a lower average vertical pay disparity.
The public is increasingly calling for action on income inequality, understanding how compensation inequality affects the behavior and incentives of employees and the outcomes of corporations is important if good corporate and political policies are to be made, lack of transparency only increases the odds of taking the wrong action.
Reference List
Adams, J. 1965. Inequity in social exchange. In Advances in Experimental Social Psychology,edited by L. Berkowitz, 267-299. New York: Academic Press.
Bebchuk, L. and Y. Grinstein. 2005. The growth of executive pay. Oxford Review of EconomicPolicy 21(2): 283-303.
Blair, E,, Kuntz, P, Whitaker, C. (2013) Top CEO Pay Ratios Bloomberg. Retrieved from Bloomberg.com
Bloom, M. 1999. The performance effects of pay dispersion on individuals and organizations.Academy of Management Journal 42(1): 25-40.
Bloom, M. and J. Michel. 2002. The relationships among organizational context, pay dispersion, and managerial turnover. Academy of Management Journal 45(1): 33-42.
Bolton, Gary, E. and Axel,O, 2000, ERC - A theory of equity, reciprocity and competition, American Economic Review 90, 166–193.
Conyon, M., S. Peck, and G. Sadler. 2001. Corporate tournaments and executive compensation:Evidence from the U.K. Strategic Management Journal 22(8): 805-815.
Cowherd, D., and D. Levine. 1992. Product quality and pay equity between lower-level employees and top management: An investigation of distributive justice theory.
Administrative Science Quarterly 37(2): 302-320.
Crawford, S. Nelson, K., Rountree, B. 2014 The CEO-Employee Pay Ratio
Dodd-Frank Wall Street Reform and Consumer Protection Act’ 2010
Faleye, O. Reis, E. Venkateswaran, A.2012 The Determinants and Effects of CEO– Employee Relative Pay
Frydman, C. Saks, R. Executive Compensation: A New View from a Long-Term Perspective, 1936–2005
Heyman, F. 2005. Pay inequality and firm performance: Evidence from matched employeremployeedata. Applied Economics 37(11): 1313-1327.
Hyun, J-H., Kang, S-C., Kim, B-J., Shin, J.Y., 2012. Determinants and performance effects of executive pay multiples. Working paper, Seoul National University.
Jensen, M. and Murphy, K. Harvard Business Review 1990
Kale, J., E. Reis, and A. Venkateswaran. 2009. Rank-order tournaments and incentive alignment: The effect on firm performance. Journal of Finance 64(3): 1479-1512.
Kulik, Carol T., and Maureen L. Ambrose, 1992, Personal and situational determinants of referent choice, Academy of Management Review 17, 212–237.
Lazear, E. and S. Rosen. 1981. Rank-order tournaments as optimum labor contracts. Journal of Political Economy 89 (5): 841–864.
Pfeffer, J. and N. Langton. 1993. The effect of wage dispersion on satisfaction,
productivity, and working collaboratively: evidence from college and university faculty. Administrative Science Quarterly 38(3): 382-407.
Quandl 2014. Gini Index by country Retrieved from www.Quandl.com
Siegel, P., and D. Hambrick.. 2005. Pay disparities within top management groups: Evidence of harmful effects on performance of high-technology firms. Organization Science 16(3): 259-274.
SEC (2013).Pay Ratio Disclosure
Smith, E., Kuntz, P., 2013. Disclosed: The pay gap between CEOs and employees. Bloomberg Businessweek, May 2.
Sorkin, A. (2015, January 26). S.E.C. Has Yet to Set Rule on Tricky Ratio of C.E.O.’s Pay to Workers’ The New York Times. Retrieved from www.nytimes.com