Department of Social and Organizational Psychology
SMARTPHONE AND PRIVACY CONCERNS: NOT SO SMART
Filipa da Silva Matias
Dissertation submitted as partial requirement for the conferral of Master in Social and Organizational Psychology
Supervisor:
Doutor Nelson Campos Ramalho Assistant Professor, ISCTE-IUL
iii
ACKNOWLEDGMENTS
Aproveito este espaço para agradecer a todos os que de alguma forma possibilitaram e tornaram os últimos cinco anos uma das etapas mais importantes e inesquecíveis da minha vida.
Ao Professor Nelson Ramalho, por toda a paciência e pelo apoio incansável durante todo este processo. Muito obrigada.
À minha família, que proporcionou as condições necessárias para que chegasse até aqui. Esta é uma conquista partilhada que não teria sido possível sem o apoio dos presentes e dos ausentes.
À Joana, não existem palavras suficientes para agradecer o apoio incondicional nesta fase da minha vida e noutras. Não teria escrito todas estas linhas sem ti.
À Bruna, pelo companheirismo, compreensão e presença em todos os momentos.
E, por último, a todos os amigos e colegas, obrigada por fazerem desta uma das melhores experiências da minha vida.
iv
RESUMO
O smartphone é um dos mais importantes dispositivos de tecnologia da informação e, por isso, os indivíduos sentem o desejo de se adaptar a este de modo a acompanhar os desenvolvimentos tecnológicos (Lee, Chang, Lin & Cheng, 2014).
Apesar de estudos recentes terem tentado desvendar as intenções comportamentais da adoção de smartphones (e.g. Bruner & Kumar, 2005; Liu & Yu, 2017), analisando diferentes fatores, há uma lacuna na análise da dimensão axiológica deste processo de decisão (Chun, Lee & Kim, 2012). A preocupação com a privacidade é um dos elementos mais relevantes (Pew Research Center, 2014) e por isso, o presente estudo procura testar em que medida a privacidade, enquanto expressão axiológica, se sobrepõe aos fatores hedónicos associados à intenção comportamental do uso do smartphone.
Com uma amostra de 211 utilizadores de smartphones procurámos compreender em que medida a importância da privacidade opera como moderadora num modelo que integra a facilidade de uso, a utilidade, e a diversão enquanto preditoras da intenção comportamental de uso do smartphone. Os resultados mostram que a privacidade é um elemento-chave da intenção comportamental de usar o smartphone, com ênfase particular nas aplicações relacionadas com a saúde.
Palavras-chave: Smartphone; Privacidade; Facilidade de Uso; Utilidade; Diversão; Intenção
v
ABSTRACT
Smartphone is one of the most important information technology devices, so people feel the desire to adapt to it in order to keep up with technological developments (Lee, Chang, Lin & Cheng, 2014). Although recent studies have attempted to unravel the behavioral intentions to use smartphones (e.g. Bruner & Kumar, 2005; Liu & Yu, 2017) by analyzing different factors, there is a gap in the axiological dimension of this decision process (Chun, Lee & Kim, 2012). Privacy concern is one of the most relevant issues (Pew Research Center, 2014) and, consequently, this study is set to test in which measure privacy, as an axiological expression, override the hedonic factors associated with the behavioral intention of using smartphones.
With a sample of 211 smartphone users we tested in which measure the importance given to privacy acts as a moderator variable in a model that comprehens ease of use, usefulness, and fun as predictors of behavioral intention to use smartphones. Findings show privacy is a key-driver in the behavioral intention of using smartphone, with particular emphasis health-related apps.
vi
TABLE OF CONTENTS
Introduction……….1
Chapter I – Literature Review……….2
1.1.Smartphones………2
1.2. Behavioral intention of smartphone use……….4
1.2.1. Usefulness………...5
1.2.2. Fun………..6
1.2.3. Ease of Use……….6
1.3. Human Values………...6
1.3.1. Privacy as an emergent value……….8
1.4. Research model and hypotheses………9
Chapter II – Method………..11
2.1. Procedure………...11
2.2. Sample………...11
2.3. Data analysis strategy………...12
2.4. Measures………...13
2.4.1. Behavioral Intention of Use………....13
2.4.2. Technology Acceptance………..15
2.4.3. Human Values……….…16
Chapter III – Results………...…..17
Chapter IV – Discussion………...33
References………...38
vii
List of Tables
Table 2.1 – Human Values Ranking
Table 3.1 – Descriptives and bivariate statistics Table 3.2 – Path coefficients and interactions
Table 3.3 – Conditional effect of Usefulness at values of Privacy
Table 3.4 – Conditional effect of interaction between Usefulness and Ease of Use at values of Privacy
Table 3.5 – Conditional effect of interaction between Ease of Use and Fun at values of Privacy
Table 3.6 – Conditional effect of interaction between Fun and Usefulness at values of Privacy Table 3.7 – Conditional effect of interaction between Ease of Use, Usefulness and Fun at values of Privacy
viii
List of Graphics
Graphic 3.1 - Moderation of privacy in usefulness on BISocial-networks
Graphic 3.2 - Moderation of privacy in combined usefulness – EoU on BISocial-networks
Graphic 3.3 - Moderation of privacy in combined EoU - Fun on BIHealth
Graphic 3.4 - Moderation of privacy in combined usefulness - Fun on BIHealth
ix
List of Figures
Figure 1.1 – Proposed Model
Figure 2.1 – CFA for behavioral intention
Figure 2.2 – CFA for technology acceptance
Figure 3.1 - Moderation of privacy in the relationship between EoU and BISocial-networks
Figure 3.2 - Moderation of privacy in the relationship between usefulness and BISocial-networks
Figure 3.3 - Moderation of privacy in the relationship between usefulness combined with EoU and BISocial-networks
Figure 3.4 - Moderation of privacy in the relationship between usefulness and BIHealth
Figure 3.5 - Moderation of privacy in the relationship between usefulness combined with EoU and BIHealth
Figure 3.6 - Moderation of privacy in the relationship between EoU combined with fun and BIHealth
Figure 3.7 - Moderation of privacy in the relationship between usefulness combined with fun and BIHealth
Figure 3.8 - Moderation of privacy in the relationship between usefulness-fun-EoU and BIHealth
x
List of acronyms
MMS – Multimedia Messsaging Service TAM – Technology Acceptance Model EoU – Ease of Use
BI – Behavioral Intention IT – Information Technology
c-TAM – Consumer Technology Acceptance Model GDPR – General Data Protection Regulation
MDSP - Moral Development Scale for Professionals CFI – Comparative Fit Index
TLI - Tucker-Lewis Index
RMSEA – Root Mean Square Error of Approximation EVA – Average Extraction Variance
CR – Composite Reliability
CFA – Confirmatory Factor Analysis AI – Artificial Intelligence
1
The informatization of society has spread to all spheres of life and is inherent in all age groups. As such, it becomes difficult to imagine an individual acquiring knowledge without resorting to modern devices, among them, the smartphone (Naydenova & Shaposhnikova, 2016; Zhitomirsky-Geffet & Blau, 2016). In fact, people are becoming increasingly technology-dependent in various aspects of their lives and daily functioning, and smartphones are the spearhead of this process (Zhitomirsky-Geffet & Blau, 2016). As such, the smartphone is one of the most important information technology devices, so people feel the desire to adapt to it to keep up with technological developments (Lee, Chang, Lin & Cheng, 2014).
Recent studies have attempted to unravel the behavioral intentions to use smartphones (e.g., Bruner & Kumar, 2005) by analyzing different factors. However, there is a gap in the axiological aspect of this intention (Chun, Lee & Kim, 2012). Thus, the question arises: How central are human values in the buying and feature use decision of AI enhanced smartphones? This is yet an unexplored territory as most the AI technology use has been studied from perceived utility and pleasure.
First, the structure of this thesis will consist of a review of the state of the art about the smartphone and its factors that influence the behavioral intention of use of this type of technological device. In addition, topics related to the axiological aspects will be approached in order to understand if they influence this intention. As such, to explore the perceptions of individuals it is necessary to understand the terms of human values. Taking into account that human values are the basis of individuals' attitudes, a contextualization on privacy will be presented as an emerging value of the technological age. Considering the literature gap related to this topic, this section ends with the hypotheses associated with the study. The next section concerns methodological options for the strategy of data analysis, sampling, measures and procedures. Forward, the findings will be presented and these will be discussed in concert with the set of hypotheses. Finally, the thesis concludes and recognizes limitations and suggestions are presented for future studies.
2
Chapter 1 – Literature Review 1.1. Smartphones
In modern world, communication is one of the most important and discussed topics. There are numerous devices that speed up the process of communicating and learning, among them, the smartphone (de Reuver, Nikou & Bouwman, 2015; Montag et al., 2015). A smart device, like the smartphone, refers to “devices that automatically gather information about users or their environment to assist them in gaining knowledge about themselves and/or taking action” (Lazar, Koehler, Tanenbaum & Nguyen, 2015, p.635).
Several market researchs has shown an increase in the average penetration rate of smartphones (Lee et al., 2014) given that smartphones are among the fastest growing categories of consumer goods in recent years (Røpke, 2003). In commercial terms, smartphones are increasingly available (Lazar et al., 2015) and the adoption rate of smartphones is higher than the rates of other portable digital devices (Chun et al., 2012). In fact, recent studies about smartphones show that they can be in use for 2.5 hours a day, or even more (Oulasvirta, Rattenbury, Ma & Raita, 2012; Deursen, Bolle, Hegner & Kommers, 2015). In Portugal, penetration of smartphones continues to increase. A recent market study showed that 6.9 million Portuguese had smartphones, representing a penetration of 75.1% of this type of product, and these percentages have doubled compared to previous years (Marketeer, 2018). Moreover, the penetration rate of smartphones is highest among male individuals, the youngest and the highest social classes. But the main differences are in the various age groups with the use of smartphones to surpass 99.0% among young people between 10 and 24 years (Marketeer, 2018).
Smartphones and their applications have significant advantages for their users, namely in terms of portability, location awareness and accessibility (Zhitomirsky-Geffet & Blau, 2016). In fact, smartphone users have to constantly deal with the form and availability of their accessibility, since this device has a variety of tools that allow you to communicate anytime, anywhere and even delay communication (Røpke, 2003).
These are not only high-tech communication devices, but also a necessity in people's lives. Generally speaking, the smartphone is the first thing we observed in the morning and the last thing we see before bed. The introduction of technologies in everyday life has led to a change in the organization of users' social lives, as well as their routines. Several authors have
3
explored ways in which smartphones can be adopted in routines from a wide range of areas, including ecological purposes, home surveillance and health domain (Lazar et al., 2015). However, the way each individual intends to use the smartphone and how it interprets it varies from individual to individual, so the user can use the smartphone differently than the manufacturers had idealized (Røpke, 2003).
Simplistically, smartphones can be perceived as task-oriented or entertainment-oriented devices (Chun et al., 2012). The main reasons for the use of smartphones are the development of routines that include this device, the perception of usefulness and the presentation of potential benefits (Lazar et al., 2015). In addition to being considered a reliable and efficient device, smartphones allows us to express feelings, get easier and faster to others and can be used as a working tool (Naydenova & Shaposhnikova, 2016; Zhitomirsky-Geffet & Blau, 2016). More specifically, smartphone allows us to access certain services, such as email, text messaging, MMS (multimedia messaging service), internet access, audio and video, short range wireless communications (e.g., Bluetooth), gaming, health applications, money-related applications, among others (Naydenova & Shaposhnikova, 2016; Zhitomirsky-Geffet & Blau, 2016).
Management between the public and private domains is an increasingly emerging issue, especially when people are increasingly accessible (Haddon, 1998). Defining what can and can not be publicly exposed becomes increasingly difficult because of this lifestyle associated with the smartphone, since people tend to work and maintain social contacts everywhere (Røpke, 2003). Supposedly, smartphones aim to improve our lives by collecting large amounts of information, making users more aware of themselves and their activities. However, there is empirical evidence that this does not happen because users perceive the data collection as useless because the level of information is not interesting (Lazar et al., 2015). In addition, users showed little interest in the collected data because most of the time the information collected is already known to the user, that is, the individual does not need the smartphone to have access to this information (Lazar et al., 2015). Another reason for individuals to consider the data collection useless is that the information provided is not processed, so users do not know how to interpret them (Lazar et al., 2015).
This raises several questions: Are smartphone users aware of the amount and quality of the information they make about themselves daily? Are they aware of how the data they provide can be beneficial or harmful to themselves?
4
For several years we have seen that new technologies are a constant and crucial element in everyday life (Røpke, 2003). The adoption behavior of a particular technology is dependent on the utility perceived by the user. Consequently, this utility varies depending on whether the individual perceives technology as instrumental or non-instrumental. The first is related to useful and second to enjoyable. We also have hedonic technologies that are characterized by low instrumental gains. When we talk about this type of technology, productivity-oriented utility becomes less relevant and intrinsic factors gain more importance (Hong & Tam, 2006).
1.2. Behavioral intention of smartphone use
The decision to buy or use a particular product is influenced by many factors, which is also true for smartphones. As such, consumer behavior can be affected by different variables, such as, personal motivations, needs, personality characteristics, socio-economic and cultural background, age, gender, and professional status to social influences of various kinds exerted by family, friends, colleagues and society as a whole (de Reuver et al., 2015).
The understanding of the factors that affect the acceptance and behavioral intention of smartphone use can be obtained through the Technology Acceptance Model (TAM) (Davis, 1985), being this one of the most accepted models (Bruner & Kumar, 2005). Initially, TAM aimed to predict employees' attitudes and behaviors as new technologies were introduced in the workplace (e.g,. Davis, 1986) and the model postulates that the usefulness and ease of use (EoU) of a device affect a person's intentions to use this device. Several versions of the model have been proposed over time in different contexts, however, the main difference between the workplace and consumer contexts in relation to TAM is that, in the second, a hedonic factor can be an important addition to the model (Childers, Carr, Peck & Carson, 2001; Dabholkar & Bagozzi, 2002).
The central idea underlying TAM is that a person’s behavioral intention (BI) to use a technological device is determined primarily by two assessments: its usefulness and its EoU (Bruner & Kumar, 2005). However, the reasons for buying and using smartphones have been changing as this type of technology is modernized (Røpke, 2003). The argument most often used to buy a smartphone was related to decreased concern, anxiety and insecurity regarding the whereabouts of family members (Røpke, 2003). More recently, the state of the art indicates that there are two main reasons for acquiring technological products: functional and non functional needs, which involve social, emotional and epistemic values and these motifs also apply to Information Technology (IT) domains (Arnold & Reynolds, 2003; Lin, Sher & Shih,
5
2005). In this sense, users adopt informed consumption behaviors, taking into account intrinsic and extrinsic motives (Kim, Chan & Gupta, 2007).
As far as hedonic technology products are concerned, the perception, attitude and intention to purchase and use these products depend on their nature and the user's perception of the associated values, which may be hedonic or utilitarian (Batra & Ahtola, 1991; Dhar & Wertenbroch, 2000). In addition, this process of acquiring and using certain technologies implies cognitive efforts and emotional involvement (Turel, Serenko & Bontis, 2010). It is also necessary to take into account that, prior to the decision to purchase a smartphone, the consumer searches for information about the product. This assessment of available alternatives is also important in consumer choice (Laroche, Kim & Matsui, 2003). Moreover, this decision is also influenced by past experiences (Moorthy, Ratchford & Talukdar, 1997), which limits the detailed assessment of all possible alternatives (Chernev, 2003). In addition, this choice is also influenced by personal preferences and the purchase perspective may have a greater effect on brand choice if the user has little knowledge about the smartphone (de Reuver et al., 2015).
Due to the emergence of new forms of technology, most of the studies that have emerged in this direction focus on the usefulness and EoU of the smartphone (Agrebi & Jallais, 2015). Studies that focus on the behavioral intention of smartphone use focus primarily on the perception individuals have of the product itself and the underlying benefits (e.g., Wang and Liao, 2008). Does this perception go against individual values?
As previously mentioned, the most accepted model for understanding the factors influencing the adoption of technologies is TAM (Davis, 1985) and, in this model, usefulness is the predominant factor of the intention to adopt technology. Bruner and Kumar (2005) created a new version of the model, the Consumer Technology Acceptance Model (c-TAM) which has added a hedonic factor - fun - that applies to the case of smartphones.
1.2.1. Usefulness
The perceived usefulness corresponds to the individuals' perception regarding the improvement of the tasks performed through the smartphone (Davis et al., 1989; Gefen & Straub, 2003; Hsu & Lu, 2004). Usefulness is one of the main predictors of technology adoption and is associated with the degree of belief that the individual has about the ease of performing a given task through a given technology (Bruner & Kumar, 2005). Also, several authors have shown that usefulness is positively correlated with the BI (Davis, 1989; Gefen & Straub, 2003;
6
Venkatesh & Davis, 2000). In non-hedonic contexts, usefulness is a more preponderant factor than fun (e.g., Davis, 1989).
1.2.2. Fun
As mentioned aboved, the decision to use and purchase smartphone is based on a variety of factors, like emotional factors – fun, pleasure and excitement (Batra & Ahtola, 1990). As such, this intention to use and purchase a hedonic technology is strongly influenced by the perceived fun. In addition, in the concrete case of the adoption of personal devices, Van der Heijden (2004) concluded that usefulness is a weaker indicator than hedonic enjoyment. This means that the adoption decision is strongly motivated by intrinsic factors, like sense of pleasure and relaxation. In this sense, at high levels of fun are associated more favorable attitudes in the intention to adopt technologies (e.g., Sheppard, Hartwick & Warshaw, 1988). In hedonic contexts, usefulness continues to be a determining factor in the adoption of technologies, however, the fun is the most powerful factor (Bruner & Kumar, 2005).
1.2.3. Ease of Use
Previous studies based on the original TAM have found that the EoU influences BI in work environments (Childers et al., 2001; Dabholkar and Bagozzi, 2002), however, this measure has not yet been studied in a hedonic context or taking into account the axiological aspect associated with BI of smartphone use. According to Bruner and Kumar (2005), when consumers believe that smartphones are easier to use, they also perceive them more useful as they can take the time to do other tasks instead of wasting time figuring out how to use the devices. Likewise, perceived smartphones as easier to use are also perceived as more fun compared to those that are more frustrating to use (Bruner & Kumar, 2005). In other words, consumers get more entertaining when performing a certain task on a device that is easier to use han on a device that is more complicated to use. As systems become easier to use, they provide users with a greater sense of ownership which, in turn, leads to greater enjoyment and fun (Bruner & Kumar, 2005).
1.3. Human Values
Human values are a crucial factor in the exploration of phenomena of various indoles, namely, psychological, social, political and economic phenomena (Cheng & Fleischmann, 2010; Hitlin, 2003). There are several definitions for this construct (Zheng, 2015) however, most researchers describe values as abstract, rooted, and influencing individuals' lives both
7
socially and individually. As such, they are a central element that guides, explains and justifies norms, actions, attitudes and opinions (Granjo & Peixoto, 2013; Tuulik, Ounapuu, Kuimet & Titov, 2016; Zheng, 2015).
In this investigation, this construct is based on Rokeach's theory that defines values as “an enduring belief that a specific mode of conduct or end-state of existence is personally or socially preferable to an opposite or converse mode of conduct or end-state of existence” (Rokeach, 1973, p.5). It further states that when a value is internalized, it is consciously or unconsciously transformed into patterns or criteria that guide actions to develop and maintain attitudes towards relevant objects and situations, to morally judge others, and to compare others. This helps to describe and explain the similarities and differences between people, groups, nations and cultures.
Based on the above, human values are among the most important evaluative beliefs, as they are crucial in the organization of individual belief systems and occupy a central position at the cognitive level (Feather, 1990; Gouveia, Andrade, Milfont, Queiroga & Santos, 2003; Pereira, Camino & Costa, 2005, Rokeach, 1973). Cognitive development entails the awareness and characterization of demanadas as values that, through interaction with others, allow individuals to become aware of the sharing of their culturally framed values (Rokeach, 1973; Schwartz, & Bilsky, 1987).
As individuals develop and evolve in a social context, human values begin to be seen as an association between the individual himself and the individual relationship with society (Cheng & Fleischmann 2010; Rokeach, 1973). In other words, human values are conceptions of judgment that provide results relative to desirable or undesirable and good or bad actions, thus revealing beliefs and patterns that characterize the value of the individual or group values (Al-Kahtani & Allam, 2013; Granjo & Peixoto, 2013; Sagiv, Roccas, Cleciuch & Schwartz, 2017; Schwartz & Bilsky 1987). In this sense, this psychological construction manifests a predictive and explanatory potential of behavior, attitudes and decision making (Al-Kahtani & Allam, 2013; Hitlin, 2003; Rokeach, 1973).
The awareness of values in the individual orienting him to organized actions according to his axiological prioritization (Al-Kahtani & Allam, 2013; Costa, 2012; Granjo & Peixoto, 2013; Schwartz, 1994), which means that each individual has different values priorities and a unique value system.
8
Attitudes and behaviors are usually not guided by an absolute value, but by priority and antagonistic values. In this way, the organization of values refers to the structure and association of these in a single value system (Costa, 2012; Pereira et al., 2005; Rokeach, 1973; Schwartz, 1994). Based on these premises, Rokeach created the Rokeach Value Survey in 1973, which contains a list of 36 values and the participants should classify them as guiding principles for their lives. These values are divided into two categories: 18 instrumental values – ambitious, broadminded, capable, cheerful, clean, corageous, forgiving, helpful, honest, imaginative, independent, intellectual, logical, loving, obedient, polite and responsible - and 18 terminal values – a comfortable life, a sense of accomplishment, a peaceful world, a world of beauty, an exciting life, equality, family security, freedom, happiness, inner harmony, mature love, national security, pleasure, salvation, self-respect, social recognition, true friendship and wisdom. The former refer to desirable modes of conduct or the means used to achieve individual preferences and the latter represent the final states of existence.
It should be noted that the order of values may change due to changes in culture, society and personal experience of individuals (Prati, Pietrantoni & Albanesi, 2005; Rokeach, 1973). Thus, individual differences regarding their organization and stability of values should be emphasized, depending on variables such as identification with gender roles, among others (Prati et al., 2005; Schwartz, 1994), so Rokeach (1973) has developed a cross-cultural research following an order that can be reasonably comprehensive and universally applicable which, consequently, allows comparisons of values between countries.
1.3.1. Privacy as an emergent value
Privacy is a recurring theme due to recent scandals related to the misuse of data (e.g., Cambridge Analytica). In this sense, the General Data Protection Regulation (GDPR) was recently approved (april 2016) with the aim of standardizing data privacy laws across Europe to protect the privacy of data of all citizens of the European Union and to reshape how organizations treat data privacy. Therefore, it seems important to consider this concept as a central human value, since we are dealing permanently with technological devices.
Privacy is a limitation of access to self, which comprises a means of control or autonomy over significant personal matters (Kokolakis, 2017; Parent, 1983). There are three distinct aspects of privacy - personal, territorial and informational. The first concerns individual protection against improper interference; the second corresponds to the physical area around an
9
individual and the latter is associated with the control of the disclosure of the data, namely, to the processing, storage, assembly and disclosure of the data (Holvast, 1993; Kokolakis, 2017).
According to Searing (1979), privacy avoids intrusion and publicity that may be subtly violated by technological devices. Smartphone is a device that facilitates this phenomenon since large amounts of personal data are collected, sometimes subconsciously (Cath, Wachter, Mittelstadt, Taddeo & Floridi, 2018; Jin, 2018; Li, Dai, Ming & Qiu, 2015). In this way, the dimension of risk associated with possible damages caused by the violation of privacy may be directly or indirectly related to technological devices (Cath et al., 2018; Jin, 2018). An example of such risk is the expected increase in corporate data collection through smartphones, regardless of their use, which will also become a target for hackers (Jin, 2018).
A study revealed that individuals demonstrate extreme concern with the collection and use of their personal data which, consequently, compromises their privacy (Pew Research Center, 2014). However, other studies show that despite this concern, individuals are willing to give up some privacy to gain benefits - called the privacy paradox (Brown, 2001; Hsu, Chang & Yen, 2011; Kokolakis, 2017; Sayre & Horne, 2000). So privacy proves to be an important added value in Rokeach's list of technological impacts on individuals' daily lives.
In this study, we will try to understand if the axiological aspect - where the privacy construct is inscribed - overlaps with the hedonic factors associated with the behavioral intention of use of the smartphone.
1.4. Research model and hypotheses
Initially, the benefits of technology were related to organizational productivity. However, over time, technological services for personal and individual use have been developed that aim to provide pleasure and satisfaction to the user, as well as intrinsic stimuli and that is why we increasingly consume technological services because we hope to obtain benefits, amongst them, usefulness and fun (Turel et al., 2010).
With the increase in the purchase and use of the smartphone (Chun et al., 2012; Røpke, 2003), it is necessary to explain the factors that attract and lead individuals to adopt this type of device. In this sense, we will try to understand if values are facilitators or obstacles to the behavioral intentions of smartphone use. So the question arises: to what extent is privacy an element that works against the ease of adopting technology?
10
The hypotheses and the suggested model are presented taking into account the literature review presented previously:
H1: Ease of use will positively associate with behavioral intention to use the smartphone
applications.
H2: Usefulness will positively associate with behavioral intention to use the smartphone
applications.
H3: Fun will positively associate with behavioral intention to use the smartphone apps. H4: Privacy negatively moderates the relationship between ease of use and behavioral
intention.
H5: Privacy negatively moderates the relationship between usefulness and behavioral
intention.
H6: Privacy negatively moderates the relationship between fun and behavioral
intention.
H7: The combined effects of ease of use, usefulness, and fun, will positively associate
with behavioral intention.
H8: Privacy negatively moderates the relationship between combined effects of ease of
use, usefulness, and fun and behavioral intention.
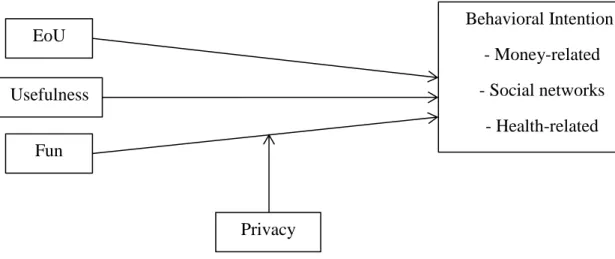
Figure 1.1 – Proposed Model
EoU Fun Usefulness Behavioral Intention: - Money-related - Social networks - Health-related Privacy
11
Chapter II – Method 2.1. Procedure
The questionnaire (Annex A) of this research was released online through social networks such as Facebook, professional networks like LinkedIn and shared in academic groups for due effect. First, a brief introduction is presented about the study and its conditions and information relevant to the participant. If he agrees with them, he gives his informed consent, otherwise the study ends. Next, there are questions about possible control variables (e.g., "Do you have a smartphone?", "How long have you had a smartphone?"; "Among the people closest to you, what percentage use smartphone?"; “To what extent do you consider that your smartphone incorporates artificial intelligence?"). Forward, follow the moral reasoning items that are measured through the Moral Development Scale for Professionals (MDSP) (Söderhamn, Bjørnestad, Skisland & Cliffordson, 2011) on a Likert scale (1 = “Strongly
Disagree”; 5 = “Strongly Agree”). Then follow the behavioral intention of use items. These are
measured through the c-TAM (Bruner & Kumar, 2005) on a Likert scale equal to the MDSP which comprise Usefulness, EoU and Fun. Finally, with respect to human values, an ipsative scale appears with eight alphabetically ordered values - true friendship, self-respect, equality, freedom, privacy, health, national security and a peaceful world - and the participant is asked to ordering them from the most important to the least important. In a final phase, sociodemographic questions arise in order to characterize the sample, such as, age, gender, literacy, marital status and profession relate dor not to IT area. Finally, a thank-you note is presented to the participant and the questionnaire ends.
2.2. Sample
The current study comprehends a sample of 211 individuals, of which 70.8% are female. The ages of the participants range between 18-69 years-old, averaging 30.16 years-old (sd=11.73). The larger number of individuals are single, representing 72.8% of the total sample.
Some variables were included in the study in order to determine if they have an effect on the relationship between the independent variable and the dependent variable. One of them relates to the IT related occupation (dummy coded 1=Yes and 2=No), which 79.2% do not have a profession related to this technological area. Another variable is the smartphone use (dummy coded 1=Yes, and 2=No), which participants use from 1 until 24 year averaging 6.9 years (sd=3.5). In addition, we found that the average percentage of individuals using a smartphone
12
around the participant is 69.9% (sd=11.73). On the other hand, the awareness of AI use in own smartphone was measured using a Likert scale (1=does not incorporate anything close to AI” to 7 “Incorporates a lot of Ai, even more than people think”), and the mean was 4.98 (sd=1.46).
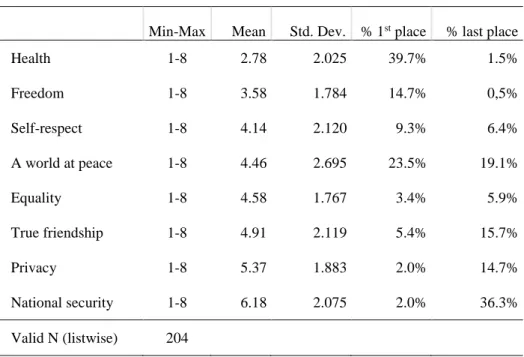
To profile participants’ human values priorities we asked to rank them. The frequency table below shows that the less important values for the majority of the participants were “national security” and “privacy”, on the other hand the most important values ranked were “health” and “freedom”:
Table 2.1. Human Values Ranking
Min-Max Mean Std. Dev. % 1st place % last place
Health 1-8 2.78 2.025 39.7% 1.5% Freedom 1-8 3.58 1.784 14.7% 0,5% Self-respect 1-8 4.14 2.120 9.3% 6.4% A world at peace 1-8 4.46 2.695 23.5% 19.1% Equality 1-8 4.58 1.767 3.4% 5.9% True friendship 1-8 4.91 2.119 5.4% 15.7% Privacy 1-8 5.37 1.883 2.0% 14.7% National security 1-8 6.18 2.075 2.0% 36.3% Valid N (listwise) 204
2.3. Data analysis strategy
For the analysis of the data, we chose to follow a double strategy and the psychometric quality of the variables was tested to ensure that they are valid and reliable. After ensuring these conditions, we focused on the hypothesis test.
For this investigation, we considered that a certain measure is sound in psychometric terms when it presents good indexes of fit in a confirmatory factorial analysis and, cumulatively, has convergent and (when applicable) divergent validity.This confirmatory factor adjustment analysis is judged according to the indexes proposed by Hair, Black, Babin and Anderson (2014) as follows: χ2 / df below 0.3 and with a non-significant p-value, Comparative Fit Index (CFI) above .92, Tucker-Lewis Index (TLI) above .92, Root Mean Square Error of Approximation (RMSEA) below 0.06. These indices indicate that there is constructive validity.
13
In addition, it is expected that the measures used will comprise factors that have convergent validity, that is, where the average load of items reaches at least 50% of variation, which means that the Average Extraction Variance (EVA) should be .50 or higher. Moreover, whenever the factorial solution contains more than one factor, the divergent validity must be tested. In this case, a solution with divergent validity is expected to present higher average factor loads in each factor than the respective interfacing correlations. Finally, it is expected that the measurements are reliable, i.e., they show a Cronbach's alpha or a Composite Reliability of .70 or higher. According to Fornell and Larcker (1981, pp. 46) whenever the AVE does not reach the desired value, we can judge the adequacy of the factor based on the CR’s threshold.
To test the moderation effects we used PROCESS macro (Hayes, 2013) which allows for bootstrapping tests. In the case of the research model, as stated at the end of literature review, we are dealing with a moderation of privacy between the c-TAM dimensions and BI dimensions. This Macro conducts a bootstrapping procedure to compute a confidence interval that has a lower bound and an upper bound. Whenever the bounds do not cross the value “zero” it means the effect is statistically significant. We have conducted the bootstrapping with 5000 repetitions for a confidence interval of 95% as recommended by Hayes (2013). Because PROCESS Macro does not allow the simultaneous test of more than one criterion variable, and ours comprehend three dimensions (money related, social networks related, and health related) we conducted three times the same analysis varying the criterion variable. Whenever a significant interaction effect is found, it is useful to consult the Johnson-Neyman table that shows the conditional effect of the focal predictor at values of the moderator, in our case, privacy. Although the computation of the interaction terms is done with the centered means, for interpretation clarity we opted to generate the Johnson-Neyman table showing true values of the variables in play. It is important to keep in mind that the moderator in this study is perceived by respondents as utmost critical when it reaches value 1, and the less valued when reaching the 8 (meaning, the least important of all listed social values).
2.4. Measures
2.4.1. Behavioral Intention of Use
This measure was built based on a focus group that explored the possible application uses in smartphones. Originally, this measure covers 15 items distributed by five factors related to the use of smartphone applications. Among them: 1) money-related (3 items, e.g., online
14
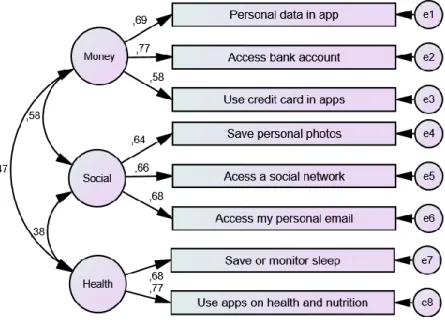
banking); 2) social contacts related (4 items, e.g., social networks); 3) health-related (2 items, e.g., health status monitoring); 4) biometrics related (4 items, e.g., fingerprint access) and; 5) GPS related (2 items, e.g., tracking on base of GPS). For this solution, we conducted a CFA and found inadequate adjustment indexes (χ2 / 82 = 2.237, p <0.001, CFI = .897, TLI = .849, RMSEA = .077). Using the Lagrange multipliers and applying rules to ensure the psychometric quality of the measure, taking into account the section "Data analysis strategy", we excluded several items. The final factorial solution maintained only four of the five initial factors to find a model that had good adjustment indexes (χ2 / 31 = 1.323, p =.108; CFI =.984, TLI =.972, RMSEA =.039). The factor structure is as follows: 1) money-related (3 items, " Putting my personal data in a smartphone application", "Access my bank account", and “Use applications that require a credit card ", AVE =.468, CR =.72); 2) social contacts related (3 items," Access to personal email "," Access to a social network " and " Save personal photos", AVE =.43, CR =.70); 3) health-related (2 items, " Save or allow a monitoring of my sleep" and " Use health or food monitoring applications”, AVE=.52, CR=.69); and 4) biometrics related (2 items, " Use retinal or iris biometric identification" and " Use face recognition", AVE =.89, CR =.94). From ensuing discussion on the contents of each factor, we concluded that biometrics was not of the same semantical value of the remaining factors as it does not pertain true application. It is but a means to grant access to the software in the smartphone. Therefore, we conducted a new CFA with the remaining three factors. Albeit of lesser fit, it still holds to the requirements and thus we opted to retain this solution (χ2 / 18 = 1.903, p =.012; CFI =.952, TLI =.903, RMSEA =.066).
15
2.4.2. Technology Acceptance
Technology acceptance was measured with c-TAM that comprehends three dimensions: ease of use (EoU, 5 items, e.g., “It was easy to use”, “I learned to use it quickly”, “It was simple to use”, “I easily remember how to use it” and “It was easy to learn to use it”), usefulness (5 items, e.g., “It helped me be more effective”, “It helped me be more productive”, “It saved me time to use it”, “It required the fewest steps to accomplish what I wanted to do with it” and “It made the task I wanted to accomplish easier to get done”), and Fun (6 items, e.g., “Happy/Unhappy”, “Pleased/Annoyed”, “Satisfied/Unsatisfied”, “Contented/Melancholic”, “ Hopeful/Despairing” and “Relaxed/Bored”). The CFA showed unsuitable fit indices (χ2/101=2.493, p<.001; CFI=.898, TLI=.862, RMSEA=.084). By using Lagrange multipliers as well as applying rules for psychometric quality as stated in section “Data analysis strategy” we excluded three items (one per dimension). The resulting model showed good fit indices (χ2/62=1.649, p<.001; CFI=.966, TLI=.957, RMSEA=.056). The solution has convergent validity (for all factors): AVEEoU=.436, CREoU=.754; AVEUsefulness=.671, CRUsefulness=.889; AVEFun=.550, CRFun=.859).
16
2.4.3. Human Values
The human values were measured through an adaptation of the Rokeach's Value Survey (1973) of a study that focused on the area of Artificial Intelligence (AI) (Couto, 2018). Considering the subject of the present investigation, we focused only on instrumental values. Due to its extension, previous analysis was performed, and the value of privacy was added because for its relevance in the literature review on AI and smartphones. Resulting from this adaptation, 10 human values were maintained, but as two were shared, the final list comprises eight human values: health, national security, world at peace, self-respect, true friendship, privacy, freedom, and equality. It should be noted that the retention option of up to 10 items took into account the standard capacity of short-term memory retention. As this measure was treated as an ipsative scale, no additional psychometric analysis is required. We only ask the participants to order the values in order to understand how privacy is positioned in the ranking.
17
Chapter III – Results
This chapter starts by showing the descriptive and bivariate statistics, some conclusions about the human values ranking and then proceeds with hypothesis testing. Table 3.1 shows the main findings concerning descriptive and bivariate statistics.
Descriptive statistics report the sample number, minimum and maximum responses registered, average and standard deviation. The variables covered are the socio-demographics (age, gender, familiarity and awareness), c-TAM, moral reasoning, human values and behavioral intention of use the smartphone. All descriptive and bivariate findings are reported in the Table 3.1 As showed the bivariate statistics evidenced some relevant patterns. With regard to sociodemographic data, more precisely to age, we verified the existence of several significant negative correlations: familiarity (r=-.304, p<0.01), EoU (r=-.487, p<0.01), BI money-related (r=-.314, p<0.01) and BISocial-networks (r=-.415, p<0.01). This means that older people report
being less familiar with smartphone technology, they also perceive the smartphone as being less easy to use and their intention to use applications linked to banking/financial or social applications/tools is smaller. We also found moderate negative correlations between age and value of true friendship (r=-.272, p<0.01) and BIhealth-related (r=.202, p<0.01), and a moderate
positive correlation with national security (r=.169, p<0.05). With regards to gender, there is a clear predominance of male participants that has had professional experience in IT related domain. Likewise female participants seem to report being less familiar with smartphone technology than males. In education, we found moderate positive correlations with awareness (r=.251, p<0.01), usefulness (r=.240, p<0.01) and BISocial-networks (r=.219, p<0.01). In other
words, individuals with more literacy tend to be more aware of the AI level of the smartphone, perceive it as more useful and tend to use the smartphone for social purposes. Regarding familiarity, we found that there is a significant positive correlation with EoU (r=.362, p<0.01), which means that individuals more familiar with the smartphone tend to perceive it as easier to use. We have also found other moderate positive correlations with usefulness (r=.175, p<0.05), BIMoney-related (r=.251, p<0.01) and BISocial-networks (r=.219, p<0.01), which shows that the
interaction of others with their smartphones enhances the individual's own BI for banking and social issues. Finally, smartphone AI awareness correlates positively and moderately with the banking and social domain BI (r=.235, p<0.01; r=.217, p<0.01, respectively).
18 Min-max mean sd 1 2 3 4 5 6 7 8 9 10 11 12 13 14 15 16 17 18 19 20 1. Age 18-69 30.16 11.73 1 2. Gender 1-2 70.8%fem - -.029 1 3. Education - - - -.169* .077 1 4. Marital status - - - .692** .047 -.232** 1 5. ITprofessional 1-2 79.2% no - .047 .342** .080 .024 1 6. Familiarity 0-100 69.9% 11.73% -.304** -.194** .174* -.326** -.236** 1 7. Awareness 1-7 4.98 1.46 -.118 .002 .251** -.170* -.099 .123 1 8. CTAM_Usefulness 1-5 3.82 .73 -.037 -.032 .240** -.035 -.163* .175* .094 1 9. CTAM_EoU 2.5-5 4.66 .55 -.487** .107 -.021 -.233** -.109 .362** .118 .190** 1 10. CTAM_Fun 1-8 5.97 1.53 -.084 .023 .118 -.089 -.123 .046 .106 .244** .103 1 11. True-friendship 1-8 4.91 2.11 -.272** .186** .100 -.181** .103 .047 .045 -.075 .026 .073 1 12. Self-respect 1-8 4.14 2.12 -.034 -.095 -.058 -.098 -.063 -.012 .007 .054 -.043 -.098 .211** 1 13. Equality 1-8 4.58 1.76 .115 .093 -.126 .267** -.032 -.027 .047 -.031 -.071 -.011 -.080 -.189** 1 14. Freedom 1-8 3.58 1.78 -.017 .155* -.099 .083 -.016 -.020 -.052 -.133 -.050 .058 -.166* -.154* .280** 1 15. Privacy 1-8 5.37 1.88 .070 -.034 .011 -.013 .025 .005 .027 -.038 -.130 -.088 -.173* .009 -.100 -.028 1 16. Health 1-8 2.78 2.02 -.081 -.014 .054 -.042 .022 -.079 -.056 .097 .057 .070 -.099 -.106 -.254** -.245** -.153* 1 17. Nation-Security 1-8 6.18 2.07 .169* -.179* .037 .050 -.019 -.013 -.014 .074 .102 -.027 -.469** -.271** -.277** -.234** -.048 .013 1 18. World-peace 1-8 4.46 2.69 .059 -.062 .037 -.008 -.019 .069 -.002 .022 .063 .018 -.234** -.446** -.156* -.210** -.334** -.165* .173* 1 19. BI_moneyrelated 1-5 2.65 1.01 -.314** -.142 .099 -.185* -.197** .251** .235** .217** .274** .117 .004 .021 -.009 .067 .080 -.034 -.076 -.030 1 20. BI_socialnetwork 1.33-5 4.32 .77 -.415** .128 .219** -.312** -.007 .219** .217** .233** .299** .091 -.002 .008 -.023 -.007 .143 .076 -.011 -.134 .422** 1 21. BI_healthrelated 1-5 2.14 1.16 -.202** -.025 .006 -.111 -.107 .129 .123 .179* .180* .076 .140 -.033 -.023 .013 -.097 -.002 -.072 .047 .338** .277** * p<0.05; ** p<0.01
19
BI of a banking, social and health nature (r=.217, p<0.01; r=.233, p<0.01; r=.179, p<0.05, respectively). Therefore, individuals who perceive the smartphone as useful tend to perceive it as more easy to use, more funny, and BI is higher for banking, social and health applications/tools. On the other hand, the EoU correlates positively and moderately with the banking, social and healthcare BI (r=.274, p<0.01; r=.299, p<0.01; r=.180,
p<0.05, respectively), that is, people who perceive the smartphone as easy to use tend to
use more banking, social and of health applications/tools.
Regarding the ranking of human values, health was the most often chosen in first place (39.7%), followed by the world at peace (23.5%) and freedom (14.7%). In turn, national security was the highest value placed in the last place (30.3%), followed by the world at peace (19.1%) and true friendship (15.7%). This means that the value of the world at peace is a divisive value, with an average of 4.46 at the ranking. In the specific case of privacy, the average of the ranking position was 5.37 and 2.0% of the sample considered this value as the most important of all on the list, while 14.7% considered the least important value.
Overall, there are some associations between some sociodemographic variables and constructs under study, which imply that ensuing analyses should control for these variables, namely, age and familiarity due to their strong associations with EoU and two of the BI dimensions; and awareness of AI incorporation due to its association with these two BI dimensions.
As stated, to proceed to the hypotheses testing, we have resourced to PROCESS Macro available in SPSS 24 (from Hayes, 2013). Table 3.2 reports the direct and interaction terms and CI95 lower and upper bound statistics for each case.
20
Table 3.2. Path coefficients and interactions
Predictor Criterion variable
Moderator
variable Direct effect Interaction effect R
2
EoU Money Privacy n.s. n.s. 0% EoU Socialnetworks Privacy .231 CI95
[.008; .455] n.s. 26.7% EoU Health Privacy n.s. n.s. 0% Usefulness Money Privacy n.s. n.s. 0% Usefulness Socialnetworks Privacy .206 CI95
[.072; .339]
-.074 CI95
[-.138; -.010] 30.1% Usefulness Health Privacy .264 CI95
[.035; .493] n.s. 9.6% Fun Money Privacy n.s. n.s. 0% Fun Socialnetworks Privacy n.s. n.s. 0% Fun Health Privacy n.s. n.s. 0% EoU&Usefulness Money Privacy n.s. n.s. 0% EoU&Usefulness Socialnetworks Privacy .045 CI95
[.020; .069]
-.016 CI95
[-.027; -.005] 31.6% EoU&Usefulness Health Privacy .053 CI95
[.011; .095] n.s. 10.2% EoU&Fun Money Privacy n.s. n.s. 0% EoU&Fun Socialnetworks Privacy n.s. n.s. 0% EoU&Fun Health Privacy n.s. -.014 CI95
[-.028; -.001]
9.4%
Fun&Usefulness Money Privacy n.s. n.s. 0% Fun&Usefulness Socialnetworks Privacy n.s. n.s. 0% Fun&Usefulness Health Privacy .026 CI95
[.005; .047]
-.016 CI95 [-.028; -.004]
11.9%
EoU&Usefulness&Funn Money Privacy n.s. n.s. 0% EoU&Usefulness&Fun Socialnetworks Privacy n.s. n.s. 0% EoU&Usefulness&Fun Health Privacy .005 CI95
[.001; .009]
-.003 CI95 [-.005; -.001]
21
According to the results obtained, we verified that there is a significant interaction in the following model:
Figure 3.1. Moderation of privacy in the relationship between EoU and BISocial-networks
The model explains 26.7% of the variation of behavioral intention to use social apps of the smartphone and there is a significant direct effect between EoU and BI
social-networks (B=.231, 95%IC=.008, .455), which means that individuals who perceive the
smartphone as easier to use, tend to use it more for social purposes.
Still in the domain of BISocial-networks, we found another significant model:
Figure 3.2. Moderation of privacy in the relationship between usefulness and BISocial-networks
The model explains 30.1% of the variation of the behavioral intention to use social apps of the smartphone and there is a significant direct effect between usefulness and
BIsocial-networks (B=.206, 95%IC=.072, .339), which means that individuals who tend to
perceive the smartphone as useful, tend to use it more in social apps. We also verified that privacy moderates significantly this relation (B=-074, 95%IC=-.138, -.010).
According to graphic 3.2., we found that the effect of usefulness on the intention to use the smartphone for social purposes changes with the value given to privacy. Among
EoU BISocial-networks
Privacy
Usefulness BISocial-networks
22
individuals that perceive low usefulness in the smartphone, those that value privacy will show a much lower BI for social purposes than those that have lesser concerns with privacy. For those that see usefulness in the smartphone, privacy makes no difference at all. Overall, this means, privacy concerns matter in the relationship between usefulness and BI for social purposes.
23
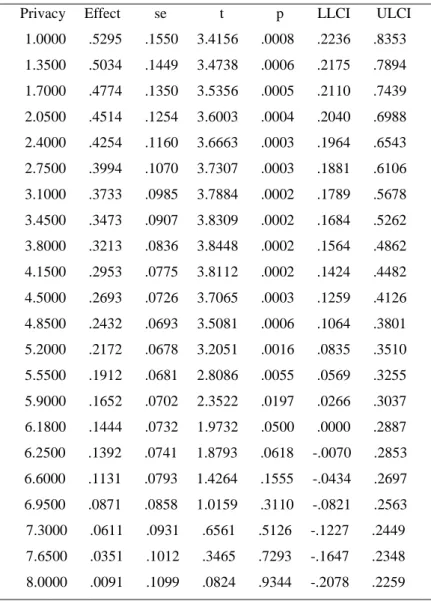
Table 3.3. - Conditional effect of Usefulness at values of Privacy
Moderator value(s) defining Johnson-Neyman significance region(s): Value % below % above
6.1800 68.4492 31.5508
Conditional effect of focal predictor at values of the moderator: Privacy Effect se t p LLCI ULCI
1.0000 .5295 .1550 3.4156 .0008 .2236 .8353 1.3500 .5034 .1449 3.4738 .0006 .2175 .7894 1.7000 .4774 .1350 3.5356 .0005 .2110 .7439 2.0500 .4514 .1254 3.6003 .0004 .2040 .6988 2.4000 .4254 .1160 3.6663 .0003 .1964 .6543 2.7500 .3994 .1070 3.7307 .0003 .1881 .6106 3.1000 .3733 .0985 3.7884 .0002 .1789 .5678 3.4500 .3473 .0907 3.8309 .0002 .1684 .5262 3.8000 .3213 .0836 3.8448 .0002 .1564 .4862 4.1500 .2953 .0775 3.8112 .0002 .1424 .4482 4.5000 .2693 .0726 3.7065 .0003 .1259 .4126 4.8500 .2432 .0693 3.5081 .0006 .1064 .3801 5.2000 .2172 .0678 3.2051 .0016 .0835 .3510 5.5500 .1912 .0681 2.8086 .0055 .0569 .3255 5.9000 .1652 .0702 2.3522 .0197 .0266 .3037 6.1800 .1444 .0732 1.9732 .0500 .0000 .2887 6.2500 .1392 .0741 1.8793 .0618 -.0070 .2853 6.6000 .1131 .0793 1.4264 .1555 -.0434 .2697 6.9500 .0871 .0858 1.0159 .3110 -.0821 .2563 7.3000 .0611 .0931 .6561 .5126 -.1227 .2449 7.6500 .0351 .1012 .3465 .7293 -.1647 .2348 8.0000 .0091 .1099 .0824 .9344 -.2078 .2259
Finally, in the field of BISocial-networks, we combined EoU and usefulness to create
24
Figure 3.3. Moderation of privacy in the relationship between usefulness combined with EoU and BISocial-networks
The model explains 31.6% of the variation of behavioral intention to use social apps of the smartphone and there is a significant direct effect between the combination of EoU and usefulness and BISocial-networks (B=.045, 95%IC=.020, .069), which means that
individuals who tend to perceive the smartphone as useful and easy to use tend to use it more for social purposes. Also, we found that privacy significantly moderates this relation (B=-.016, 95%IC=-.027, -.005).
Graphic 3.2. and table 3.4 show that, similarly to the previous graphic, the effect of the combined usefulness and fun of the smartphone in the BI for social purposes increases as the value of privacy decreases. However, it is possible to observe that there is a turnaround when individuals devalue privacy, more precisely, from position 7.6 onwards of the ranking when this effect is no longer significant.
Graphic 3.2. Moderation of privacy in combined usefulness - EoU on BISocial-networks
EoU&Usefulness BISocial-networks
25
Table 3.4. Conditional effect of interaction between Usefulness and Ease of Use at values of Privacy
Moderator value(s) defining Johnson-Neyman significance region(s): Value % below % above
7.6428 85.0267 14.9733
Conditional effect of focal predictor at values of the moderator: Privacy Effect se t p LLCI ULCI
1.0000 .1243 .0309 4.0258 .0001 .0634 .1853 1.3500 .1197 .0289 4.1398 .0001 .0626 .1767 1.7000 .1150 .0270 4.2656 .0000 .0618 .1682 2.0500 .1104 .0251 4.4042 .0000 .0609 .1598 2.4000 .1057 .0232 4.5561 .0000 .0599 .1515 2.7500 .1010 .0214 4.7210 .0000 .0588 .1433 3.1000 .0964 .0197 4.8968 .0000 .0576 .1352 3.4500 .0917 .0181 5.0782 .0000 .0561 .1274 3.8000 .0871 .0166 5.2542 .0000 .0544 .1198 4.1500 .0824 .0152 5.4054 .0000 .0523 .1125 4.5000 .0778 .0141 5.5012 .0000 .0499 .1056 4.8500 .0731 .0133 5.5005 .0000 .0469 .0993 5.2000 .0684 .0128 5.3619 .0000 .0433 .0936 5.5500 .0638 .0126 5.0626 .0000 .0389 .0886 5.9000 .0591 .0128 4.6164 .0000 .0339 .0844 6.2500 .0545 .0134 4.0731 .0001 .0281 .0809 6.6000 .0498 .0143 3.4951 .0006 .0217 .0779 6.9500 .0452 .0154 2.9337 .0038 .0148 .0755 7.3000 .0405 .0167 2.4195 .0165 .0075 .0735 7.6428 .0359 .0182 1.9730 .0500 .0000 .0719 7.6500 .0358 .0182 1.9643 .0510 -.0002 .0719 8.0000 .0312 .0199 1.5687 .1184 -.0080 .0704
Moving on to the domain of smartphone applications for health domain, we have found several significant results, among them:
26
Figure 3.4. Moderation of privacy in the relationship between usefulness and BIHealth
In the first, the model explains 9.6% of the variation of the behavioral intention to use health-related applications of the smartphone and there is a significant direct effect between usefulness and BIHealth (B=.264, 95%IC= .035, .493), which means that the more
individuals perceive the smartphone as useful, the more likely it is to use it for health purposes.
Similarly, when we combine usefulness with EoU, we get a significant interaction:
Figure 3.5. Moderation of privacy in the relationship between usefulness combined with EoU and BIHealth
The model explains 10.2% of the variation of behavioral intention to use health-related appications of the smartphone and there is a significant direct effect between usefulness and ease of use with BIHealth (B =.053 95%IC =.011, .095), which means that
the more people perceive the smartphone as useful and fun, the more likely it is to use it for health purposes. Combining EoU with fun, we found another significant interaction:
Usefulness BIHealth Privacy EoU&Usef ulness BIHealth Privacy
27
Figure 3.6. Moderation of privacy in the relationship between EoU combined with fun and BIHealth
In this case, the model explains 9.4% of the variation of behavioral intention to use health-related applications of the smartphone and there is no significant direct effect between ease of use and fun with BIHealth but the interaction effect is significant (B=-.014,
95%IC=-.028, -.001). This means that privacy strongly changes the valence of the association contrasting a negative coefficient in a low privacy valuing population with a positive coefficient in a high privacy valuing population. In other words, when individuals do value privacy and think using the smartphone is both fun and easy, they tend to report higher probability of using smartphones for health purposes although still falling the rejection side of the scale. Conversely, when individuals do not value so much privacy (namely, after average 5.2), there is no relationship at all between BI for health purposes and the judgment that it is both easy of use and funny. It is worth noting that when individuals value privacy, health related apps that are taken as neither fun nor easy to use, will be the most strongly rejected.
Graphic 3.3 Moderation of privacy in combined EoU - Fun on BIHealth
EoU&Fun ulness
BIHealth
28
Table 3.5. Conditional effect of interaction between Ease of Use and Fun at values of Privacy
Moderator value(s) defining Johnson-Neyman significance region(s): Value % below % above
4.8628 32.6203 67.3797
Conditional effect of focal predictor at values of the moderator: Privacy Effect se t p LLCI ULCI
1.0000 .0819 .0331 2.4709 .0144 .0165 .1473 1.3500 .0767 .0310 2.4766 .0142 .0156 .1378 1.7000 .0715 .0288 2.4813 .0140 .0146 .1283 2.0500 .0662 .0267 2.4842 .0139 .0136 .1188 2.4000 .0610 .0246 2.4842 .0139 .0125 .1095 2.7500 .0558 .0225 2.4793 .0141 .0114 .1002 3.1000 .0506 .0205 2.4665 .0146 .0101 .0910 3.4500 .0453 .0186 2.4411 .0156 .0087 .0820 3.8000 .0401 .0167 2.3951 .0176 .0071 .0732 4.1500 .0349 .0151 2.3164 .0217 .0052 .0646 4.5000 .0297 .0136 2.1868 .0300 .0029 .0564 4.8500 .0244 .0123 1.9824 .0490 .0001 .0488 4.8628 .0243 .0123 1.9732 .0500 .0000 .0485 5.2000 .0192 .0114 1.6805 .0946 -.0033 .0418 5.5500 .0140 .0110 1.2757 .2037 -.0077 .0357 5.9000 .0088 .0110 .7985 .4257 -.0129 .0305 6.2500 .0036 .0115 .3094 .7574 -.0191 .0262 6.6000 -.0017 .0124 -.1343 .8933 -.0262 .0228 6.9500 -.0069 .0137 -.5039 .6150 -.0339 .0201 7.3000 -.0121 .0152 -.7976 .4261 -.0421 .0179 7.6500 -.0173 .0169 -1.0268 .3059 -.0506 .0160 8.0000 -.0226 .0187 -1.2053 .2297 -.0595 .0144
On the other hand, and still in the field of health applications of the smartphones, we found two significant models:
29
Figure 3.7. Moderation of privacy in the relationship between usefulness combined with fun and BIHealth
The model explains 11.9% of the variation of behavioral intention to use health-related applications of the smartphone and there is a significant direct effect between the combination of fun and usefulness and BIHealth (B=.026, 95%IC = .005, .047), which
means that individuals who tend to perceive the smartphone as fun and useful tend to use it more in health apps. Also, we found that privacy significantly moderates the relation (B=-.016, 95%IC = -.028, -.004).
According to graphic 3.4 and table 3.6, we can observe that when individuals think using the smartphone is both fun and useful and they have high concern with privacy they will show higher probability of using it for health related purposes although they fall in the negative side of the scale (they still reject using it). Conversely, when they do not value privacy (when they rank it in the 6th or lower position), being fun and useful has no impact on the BI for health purposes and they also continue reject using it. Individuals that value privacy will be the ones that most strongly reject using related health apps when they see it as being neither funny nor useful.
Graphic 3.4. Moderation of privacy in combined usefulness - fun on BIHealth
Fun&Usefulness BIHealth
30
Table 3.6. Conditional effect of interaction between Fun and Usefulness at values of Privacy
Moderator value(s) defining Johnson-Neyman significance region(s): Value % below % above
5.6979 50.8021 49.1979
Conditional effect of focal predictor at values of the moderator: Privacy Effect se t p LLCI ULCI 1.0000 .0964 .0299 3.2290 .0015 .0375 .1553 1.3500 .0908 .0279 3.2561 .0013 .0358 .1458 1.7000 .0851 .0259 3.2843 .0012 .0340 .1363 2.0500 .0795 .0240 3.3131 .0011 .0322 .1269 2.4000 .0739 .0221 3.3414 .0010 .0303 .1175 2.7500 .0683 .0203 3.3672 .0009 .0283 .1083 3.1000 .0626 .0185 3.3870 .0009 .0261 .0991 3.4500 .0570 .0168 3.3947 .0008 .0239 .0901 3.8000 .0514 .0152 3.3802 .0009 .0214 .0814 4.1500 .0458 .0138 3.3271 .0011 .0186 .0729 4.5000 .0401 .0125 3.2106 .0016 .0155 .0648 4.8500 .0345 .0115 2.9993 .0031 .0118 .0572 5.2000 .0289 .0108 2.6642 .0084 .0075 .0502 5.5500 .0232 .0106 2.2004 .0290 .0024 .0441 5.6979 .0209 .0106 1.9732 .0500 .0000 .0417 5.9000 .0176 .0107 1.6444 .1018 -.0035 .0387 6.2500 .0120 .0113 1.0638 .2888 -.0102 .0342 6.6000 .0064 .0122 .5222 .6021 -.0177 .0304 6.9500 .0007 .0134 .0545 .9566 -.0256 .0271 7.3000 -.0049 .0148 -.3322 .7401 -.0340 .0242 7.6500 -.0105 .0163 -.6458 .5193 -.0427 .0216 8.0000 -.0162 .0180 -.8988 .3700 -.0516 .0193
Finally, we found another significant model but this time we combined EoU, usefulness and fun:
31
Figure 3.8. Moderation of privacy in the relationship between usefulness-fun-EoU and BIHealth
The model explains 12.6% of the variation of the behavioral intention to use health-related applications of the smartphone and there is a significant direct effect between the combination of EoU, usefulness and fun with BIHealth (B=.005, 95%IC=. 001,
.009), which means that individuals who tend to perceive the smartphone as easy to use, useful and fun tend to use it more in health-related applications. Also, we found that privacy significantly moderates this relation (B=-.003, 95%IC=-.005, -.001).
According to graphic 3.5. and table 3.7. we can observe that when an health related app in the smartphone is both easy to use, useful and funny, individuals that value privacy will tend to reject it, but not so strongly as those that do not value privacy. But the same individuals that value privacy will reject it more strongly when the apps fail to be easy, funny, and useful.
Graphic 3.5. Moderation of privacy in combined usefulness – Fun - EoU on BIHealth
EoU&Usefulness&Fun BIHealth