E.R. Hruschka Junior et al. (Eds.): INTECH 2011, CCIS 165, pp. 50–58, 2011. © Springer-Verlag Berlin Heidelberg 2011
Knowledge Using Genetic Algorithms
Andre Bevilaqua, Fabricio Alves Rodrigues, and Laurence Rodrigues do Amaral
Computer Science Departament, UFG Jatai, GO - Brazil
[email protected], [email protected]
Abstract. Computational approaches have been applied in many different biology application domains. When such tools are based on conventional computation, their approach has shown limitations when dealing with complex biological problems. In the present study, a computational evolutionary environment (GASNP) is proposed as a tool to extract classification rules from biological dataset. The main goal of the proposed approach is to allow the discovery of concise, and accurate, high-level rules (from a biological database named dbSNP - Database Single Nucleotide Polymorphism) which can be used as a classification system. More than focusing only on the classification accuracy, the proposed GASNP model aims at balancing prediction precision, interpretability and comprehensibility. The obtained results show that the proposed GASNP has great potential and is capable of extracting useful high-level knowledge that could not be extracted by traditional classification methods such as Decision Trees, One R and the Single Conjunctive Rule Learner, among others, using the same dataset.
Keywords: Bioinformatic, Machine Learning, Evolutionary Computation, Genetic Algorithms, SNPs.
1 Introduction
and psychiatric disorders, because these phenotypes are affected by multiple genes, each with small effect; environmental contributions are also important. Instead of linkage analysis on families or classes it may be much more efficient to perform association analysis on many affected and unaffected individuals, which would require hundreds of thousands of variants spread over the entire genome. About 90% of sequence variants in humans are differences in single bases of DNA, called single nucleotide polymorphisms (SNPs) and these SNPs can be in the coding regions of genes or in regulatory regions [11]. New techniques for the large-scale identification of SNPs in the human population [12] are resulting in an exponential expansion in the number known, and already the National Institute of Health (NIH) SNP database (http://www.ncbi.nlm.nih.gov/SNP) contains approximately 2.8 million cases. There are high hopes that knowledge of an individuals SNP genotype will provide a basis for assessing susceptibility to disease and the optimal choice of therapies [13]. A major challenge in realizing these expectations is understanding how and when the variants cause disease [14]. Thus, the study of the SNPs and these variants will allow researchers to identify the genetic basis for common diseases and to improve the efficacy of drugs and other therapies [11]. In the present study, the main objective is to mine accurate and short high level rules that will be associated to each class individually, reducing the problem to few features per class. Also, a value will be associated to each feature that composes the rule. The results generated in this work may help researchers to understand the alteration mechanisms in the SNP of Anopheles gambiae. A Genetic Algorithm was elaborated to obtain IF-THEN rules from dbSNP database of A. gambiae.
2 Evolutionary Environment
2.1 Genetic Algorithms (GA)
GA are computational search methods based on natural evolution and genetic mechanisms, simulating the Darwins’s natural selection theory [3]. The GA implemented in our evolutionary environment was adapted from [9]. GA in [9] was elaborated with the goal of obtaining IF-THEN classification rules in clinical databases. Another evolutionary environment, also based on [9], was applied in cancer cells gene expression database [6], measured by microarray [5].
2.2 Individual Representation
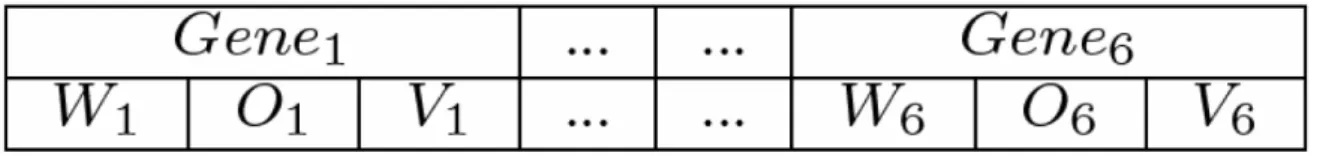
Fig. 1. Individual representation
All genes of the GA individual is subdivided into three fields: weight (Wi), operator (Oi) and value (Vi), as illustrated in Figure 1. Each GA gene corresponds to one condition in the antecedent part of the rule (IF) and the whole individual is the previous rule. The weight field is an integer variable and its value is between 0 (zero) and 10 (ten). It is important to say that this weight field determines the insertion or exclusion of the correspondent gene in the previous rule. If this value is lesser than a boundary-value, this gene will not appear in the rule, otherwise the gene appears. In this work, the value 7 (seven) was used as the boundary-value. The operator field can be < (minor), > (larger), = (equal) or ! (diferent). The value of orientation SNP scaffold is + (forward) or - (reverse). The value of SNP position is an integer variable which can vary between the minor and the larger value found in the database. The value of alleles 1 and 2 are: A (adenine), G (guanine), C (cytosine) or T (thymine). The value that represents the number of observations of allele 1 and 2 is an integer number that can vary between the minor and the larger value found in the database.
2.3 Genetic Operators and Parameters
Stochastic tournament with Tour of size 3 was used as the selection method for crossover. One-point crossover with probability equal to 100% is applied to each couple of selected individuals, generating two new ones. Mutation is applied to the new individuals. A specific mutation operator is used to each type of gene field with a rate of 30%. During the mutation of the weight field, the new value is given by the increment or the decrement of one unit to the original value. The mutation changes the current operator field to other valid operator. In this work we have used four operators (<, >, = or !). The population for the next generation is formed by selecting the best individuals among the components of parents and children populations. To define the best GA configuration, we chose the configuration that achieved the best test results for all classes.
We used 200 individuals, evaluated our GA per 200 generations and set the weight field to 7. This environment was obtained after testing various configurations, such as:
• Population size: 100, 200 and 400; • Generations: 100 and 200;
• Selection method: Roulette and Stochastic tournament; • Weight field: 6, 7 and 8;
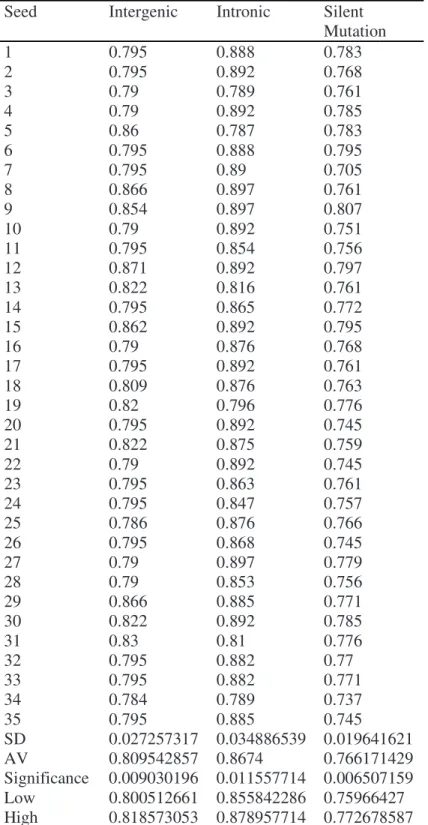
0.878957714 (with difference 1.8%). For the intronic class, the lowest value obtained is 0.800512661, and the highest is 0.818573053 (with difference 2.3%). The best result was obtained for the silent mutation class. The lowest value obtained is 0.75966427, and the highest is 0.772678587, with difference 1.3%.
Table 1. Significance Test
Seed Intergenic Intronic Silent
Mutation
1 0.795 0.888 0.783
2 0.795 0.892 0.768
3 0.79 0.789 0.761
4 0.79 0.892 0.785
5 0.86 0.787 0.783
6 0.795 0.888 0.795
7 0.795 0.89 0.705
8 0.866 0.897 0.761
9 0.854 0.897 0.807
10 0.79 0.892 0.751
11 0.795 0.854 0.756
12 0.871 0.892 0.797
13 0.822 0.816 0.761
14 0.795 0.865 0.772
15 0.862 0.892 0.795
16 0.79 0.876 0.768
17 0.795 0.892 0.761
18 0.809 0.876 0.763
19 0.82 0.796 0.776
20 0.795 0.892 0.745
21 0.822 0.875 0.759
22 0.79 0.892 0.745
23 0.795 0.863 0.761
24 0.795 0.847 0.757
25 0.786 0.876 0.766
26 0.795 0.868 0.745
27 0.79 0.897 0.779
28 0.79 0.853 0.756
29 0.866 0.885 0.771
30 0.822 0.892 0.785
31 0.83 0.81 0.776
32 0.795 0.882 0.77
33 0.795 0.882 0.771
34 0.784 0.789 0.737
35 0.795 0.885 0.745
SD 0.027257317 0.034886539 0.019641621
AV 0.809542857 0.8674 0.766171429
2.4 Fitness Function
In general, the individual fitness quantifies its quality as a solution for the target problem. In this work, FF evaluates the quality of the rule associated to each individual. Some concepts must be explained before defining our FF. When a rule defined for the classification of a specific class C is applied to a known case, four different types of results can be observed, depending on the class predicted by the rule and the true class of the case [8]:
• True Positive (tp) - The rule classifies the case as class C and the case really
belongs to class C;
• False Positive (fp) - The rule classifies the case as class C, but the case does
not belong to class C;
• True Negative (tn) - The rule does not classify the case as class C and the
case does not belong to class C;
• False Negative (fn) - The rule does not classify the case as class C, but the
case really belongs to class C;
Based on the four possible results of a rule, the fitness function used in our evolutionary environment applies two indicators commonly used in medical domains, called Sensitivity (Se) and Specificity (Sp), which can be defined as follows:
)
(
tp
fn
tp
Se
+
=
(1))
(
tn
fp
tn
Sp
+
=
(2)Using the sensitivity and specificity concepts, FF is defined as the combination of these two indicators, Se and Sp, as follows:
2
/
)
(
Se
Sp
Fitness
=
+
(3)The goal is to maximize, at the same time, Se as well as Sp. In each execution, the GA works in a binary classification problem, that is, when the GA is searching for rules associated to a given class C, all the other classes are grouped in one unique class (not C).
2.5 Database
single-base nucleotide substitutions (SNPs) [7]. This evolutionary environment was applied in SNP database (dbSNP) of A. gambiae.
The major goal is to search for relations between six fields (orientation SNP scaffold, SNP position, value of allele 1, number of observations of allele 1, value of allele 2 and number of observations of allele 2) and three types of SNP (intergenic, intronic and silent mutation). The database has 495 records (intergenic - 80%, intronic - 15.75% and silent mutation - 4.25%).
3 Results
We split the database in three partitions. All partitions have 165 records (132 records of intergenic class, 26 records of intronic class and 7 records of silent mutation class). In this work, we used two partitions in training and one partition in test. The Table II presents the best rules discovered by our GA and shows their evaluations in the training and test sets.
In Table 2, observe that our environment found a low number of attributes per class (only 3) and a low number of used attributes in all rules (only 4). Furthermore, the atributes number of obs of allele 1 and 2 appeared in all rules. The result obtained for intergenic class is very good because we found a test result better than a training result (0.864 against 0.795, a difference of 0.069 or 6,9%). The remaining results were good too. For the intronic and silent mutation classes, we obtained test results very near of the training result. For intronic class the difference was 0.073 or 7.3% and for silent mutation class the difference was 0.023 or 2.3%.
Table 2. Best rules discovered for each class
Type of SNP (class) Rule Fitness Training Fitness Test
Intergenic If(orientation SNP scaffold = +) AND (number of obs of allele 1 ! 7) AND (number of obs. of allele 2 > 6)
0.795 0.864
Intronic If(orientation SNP scaffold = -) AND (SNP position < 9385) AND (number of obs. of allele 2 ! 8)
0.888 0.815
Silent Mutation IF (SNP position < 2095)
AND (number of obs of allele 1 ! 5) AND (number of obs. of allele 2 < 3)
0.783 0.76
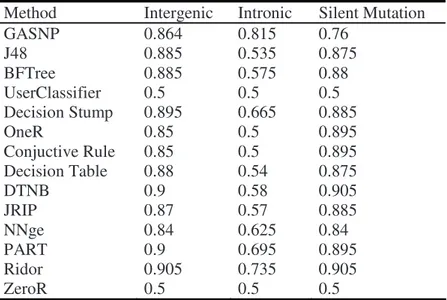
knowledge. This classification methods were divided in two groups: the first uses as output the trees and the second, rules. The tree group is: J48, BFTree, UserClassifier, DecisionStump and FT. The rule group is: OneR, ConjuctiveRule, Decision Table, DTNB, JRIP, NNge, PART, Ridor and ZeroR. The table III presents the comparison between our environment with others traditional classification algorithms. In all methods aforementioned, we used 3-fold cross validation.
Table 3. Comparison between our method and other traditional methods using the fitness function described by the expression (3)
Method Intergenic Intronic Silent Mutation
GASNP 0.864 0.815 0.76
J48 0.885 0.535 0.875
BFTree 0.885 0.575 0.88
UserClassifier 0.5 0.5 0.5
Decision Stump 0.895 0.665 0.885
OneR 0.85 0.5 0.895
Conjuctive Rule 0.85 0.5 0.895
Decision Table 0.88 0.54 0.875
DTNB 0.9 0.58 0.905
JRIP 0.87 0.57 0.885
NNge 0.84 0.625 0.84
PART 0.9 0.695 0.895
Ridor 0.905 0.735 0.905
ZeroR 0.5 0.5 0.5
Our environment obtained the best result for the intronic class with difference of 0.08 or 8% for the second best result (Ridor method with 0.735). When we compared the three classes, intergenic, intronic and silent mutation, our environment is better than two methods: UserClassifier and ZeroR. Both methods obtained results of 0.5 in three classes. This happened because this methods obtained excellent results for specificity (100%) but obtained worst results for sensibility (0%) or vice versa. When we applied these results in (3) function, the result is not so good. For the intergenic class, our method is better than DecisionStump, OneR, ConjuctiveRule and ZeroR. Even to intergenic class, we obtained equivalent results with other 4 methods: J48, BFTree, Decision Table and JRIP. Although our results are worse, the knowledge built by our method is more interpretable and understandable than the one produced by those. J48 built a tree with 12 leaves and size 21. BFTree built a tree with size 37 and 19 leaf nodes. The Decision Table and JRIP built a rule set with 10 and 6 rules, respectively. Our rule set is composed by only 3 rules with 3 attributes, each. When we use this rule set as a black-box classifier, we used only 4 attributes.
When we project a classifier, it has to classify with high hit rates, but high hit rates only for some classes is not sufficient - it has to classify all classes with high hit rates.
Table 4. Comparison between our method and other traditional methods using the fitness function described by the expression (3)
Method Mean Standard
Deviation
GASNP 0.81 0.05
J48 0.77 0.20
BFTree 0.78 0.18
DecisionStump 0.75 0.22
FT 0.82 0.13
OneR 0.75 0.22
ConjuctiveRule 0.75 0.22
Decision Table 0.77 0.19
DTNB 0.8 0.19
JRIP 0.78 0.18
NNGE 0.77 0.12
PART 0.83 0.12
Ridor 0.85 0.1
4 Final Remarks
Many complex biological problems have received more attention from part of the computational intelligence community mainly because of the great amount of information available in electronic repositories and their complexity. In this work, we proposed an evolutionary environment to extract high-level knowledge (IF-THEN rules) from a specific SNP database subset. Considering that a classification system should go beyond prediction accuracy, we have implemented a fitness function based on features which can help obtaining comprehensible and interpretable results while keeping acceptable classification accuracy. In general the proposed method allowed to obtain simple classification rules with a low number of attributes per class. It obtained good convergence rates and presented more informative and comprehensive results than other traditional classification methods also used in our comparative analysis.
Therefore, it is possible to conclude that the use of the proposed evolutionary environment is indicated mainly when classifying real problems, where the discovery of high-level knowledge about the domain is crucial. The future for this area of research is bright. It is clear from the initial research efforts that bioinformatics methods that predict molecular effects of mutation will continue to improve. A word of caution must be added, however, that bioinformatic scientists building these methods will have the most success if they choose their learning tools carefully and their training sets to best represent the spectrum of predictions they will be making [15]. As future works, we hope to improve the results obtained for the three classes, especially silent mutation, vastly increasing the competitiveness of our environment.
References
1. Setbal, J.C., Meidanis, J.: Introduction to Computacional Molecular Biology. PWS Publishing Company, Boston (1997)
3. Goldberg, D.E.: Genetic Algorithms in Search, Optimization and Machine Learning. Adison-Wesley, Reading (1989)
4. Fidelis, M.V., Lopes, H.S., Freitas, A.A.: Discovery Comprehensible Classification Rules with a Genetic Algorithm. In: Proceedings of the Congress on Evolutionary Computation, CEC 2000 (2000)
5. Amaral, L.R., Sadoyama, G., Espindola, F.S., Oliveira, G.M.B.: Oncogenes Classification Measured by Microarray using Genetic Algorithms. In: IASTED International Conference on Artificial Intelligence and Applications, AIA 2008 (2008)
6. Ross, D.T., Scherf, U., Eisen, M.B., Perou, C.M., Rees, C., Spellman, P., Iyer, V., Jeffrey, S.S., Van de Rijn, M., Waltham, M., Pergamenschikov, A., Lee, J.C.F., Lashkari, D., Shalon, D., Myers, T.G., Weinstein, J.N., Botstein, D., Brown, P.O.: Systematic variation in gene expression patterns in human cancer cell lines. Nature Genetics (2000)
7. Kitts, A., Sherry, S.: The NCBI Handbook. The National Library of Medicine (2002) 8. Lopes, H.S., Coutinho, M.S., Lima, W.C.: An evolutionary approach to simulate cognitive
feedback learning in medical domain. In: Genetic Algorithms and Fuzzy Logic Systems, World Scientific, Singapore (1997)
9. Fidelis, M.V., Lopes, H.S., Freitas, A.A.: Discovery comprehensible classification rules with a genetic algorithm. In: Congress on Evolutionary Computation, CEC 2000 (2000) 10. Holmes, G., Donkin, A., Witten, I.H.: Weka: A machine learning workbench. In:
Proceedings of the Second Australia and New Zealand Conference on Intelligent Information Systems (1994)
11. Collins, F.S., Brooks, L.D., Chakravarti, A.: A DNA Polymorphism Discovery Resource for Research on Human Genetic Variation. Genome Research (1998)
12. Wang, D.G., Fan, J.B., Siao, C.J., Berno, A., Young, P., Sapolsky, R., Ghandour, G., Perkins, N., Winchester, E., Spencer, J., Kruglyak, L., Stein, L., Hsie, L., Topaloglou, T., Hubbell, E., Robinson, E., Mittmann, M., Morris, M.S., Shen, N., Kilburn, D., Rioux, J., Nusbaum, C., Rozen, S., Hudson, T.J., Lander, E.S., Lipshutz, R., Chee, M.: Large-scale identification, mapping, and genotyping of single-nucleotide polymorphisms in the human genome, Science (1998)
13. Masood, E.: As consortium plans free SNP map of human genome. Nature (1999) 14. Wang, Z., Moult, J.: SNPs, Protein Structure, and Disease. Human Mutation (2001)