PoRTUGUESE JOURNAL OF MANAGEMENT STUDIES, VOL. XI/, NO. 2, 2007
W
School of Economics and ManagementTECHNICAL UNIVERSITY OF LISBON
G
AGENT-BASED MODELING TO INVESTIGATE THE DISPOSITION EFFECT
IN FINANCIAL MARKETS
Shi-WoeiLin
Department of Business Administration. Yuan Ze University
Hui-Lung Huang
Department of Business Administration. Yuan Ze University
Abstract
One of the behavioral patterns that deviate from what is predicted by traditional financial theories is the disposition effect. Although most empirical studies have reported a significant disposition effect, researchers have yet to conduct a conclusive test of this effect because a competing hypothesis or confounding effects might explain the documented significance. Thus, we use the tools of computational intelligence, instead of empirical approaches, to explore market behavior. In particular, we allow agents with different investment strategies to interact and to compete with each other in an artificial futures market. We found that the S-shaped value curve proposed by prospect theory may be one of the causes of the observed behavior of the disposition effect. However, rational expectation such as short-term mean reversion can even be more decisive.
Key words: agent-based model, disposition effect, behavioral bias, prospect theory, futures market
1. INTRODUCTION
While the rationality assumption posits that an investor makes a decision on the basis of his or her expected utility, the decision maker's real action usually deviates from what is predicted by the theory. One of the behavioral patterns arising from this line is the propensity of traders to hold losing investments too long and to sell winning investments too early. Shefrin and Statman ( 1985) labeled this phenomenon the "disposition effect."
PORTUGUESE JOURNAL OF MANAGEMENT STUDIES, VOL.. XI/, NO. 2, 2007
According to Shefrin and Statman ( 1985), the main theoretical basis of the disposition effect is prospect theory, developed by Kahneman and Tversky (1979). With a view different from that of traditional expected utility theory, prospect theory posits that most investors are loss averse. In other words, investors are risk seekers when facing a loss (and thus will try to hold losing investments) and risk avoiders when facing a gain (and thus will tend to realize winning investments).
In the two decades since Shefrin and Statman (1985), researchers have conducted many studies concerning the disposition effect. Some researchers empirically study disposition effects in the housing market and disposition effects associated with stock markets and mutual fund investors (see, for example, Ferris, Haugen, and Makhija, 1988; Garvey and Murphy, 2004; Genesove and Mayer, 2001; Odean, 1998; Shapira and Venezia, 2001). Recently, a few studies have focused also on this behavioral bias in the futures markets (Coval and Shumway, 2005; Frino, Johnstone and Zheng, 2004; Heisler, 1994; Locke and Mann, 2005; Locke and Onayev, 2005).
Compared to other financial markets, futures markets provide an ideal setting for testing the disposition effect. For example, the cost of trading in a futures market is usually much lower than the cost of trading other securities, and this low cost might help rule out the possibility that a trader, to avoid higher fractional trading costs, would refrain from selling securities whose value is declining. Also, most of the positions in futures contracts expire before the end of the financial year, so this feature rules out the possibility that a trader's desire to maximize tax benefits would motivate the trader to ride losses and to realize gains in a specific period of a year.
Although futures markets provide an ideal testing site for examining the disposition effect and although most empirical studies have reported a significant disposition effect, a conclusive test of it has yet to be conducted because the statistical significance might derive from competing hypotheses or confounding effects. Thus, we use the tools of computational intelligence to explore the market behavior. In particular, we allow the computer agents with different investment strategies to interact and to compete with each other in an artificial futures market. We found that the S-shaped value curve proposed by prospect theory may be one of the main causes of the observed behavior of the disposition effect, and this finding is consistent with the findings of empirical studies. However, when exploring the relationship between disposition effects and traders with various trading strategies, we found that the traders' rational expectations can play an even more important role than the aforementioned curve. Future studies might further clarify this issue.
PORTUGUESE JOURNAL OF MANAGEMENT STUDIES, VOL. XI/, NO. 2, 2007
our agent-based simulation. In Section 4, we state our results. In Section 5, we discuss conclusions and future directions.
2. LITERATURE REVIEW
2.1 Prospect Theory and the Disposition Effect
Traditionally, investors' behaviors are built on the foundation of the Capital Asset Pricing Model (CAPM) and the Efficient Market Theory (EMT). Many financial models are then derived from the CAPM and the EMT. However, in the late 1970s, many researchers found that their studies' empirical findings such as the size effect, the January effect, and the weekend effect were not consistent with the assumptions attributable to the CAPM and the EMT. While traditional finance scholars considered these phenomena just temporary market anomalies, a group of researchers began to challenge the traditional finance theories, which, themselves, rested mainly on expected utility theory. In their seminal work, Kahneman and Tversky (1979) proposed prospect theory for explaining decision makers' various behavior biases that utility theory cannot explain. The disposition effect, which was named by Shefrin and Statman ( 1985), derives from prospect theory, as well. Prospect theory, as developed by Kahneman and Tversky (1979), concerns decision making under uncertainty. Because the behavior of most participants in the researchers' study differed from what was expected according to utility theory, Kahneman and Tversky substituted a value function for the utility function to explain a decision maker's behavior. The prospect theory posits that investors are loss averse. In other words, investors are risk seekers when facing a loss (and thus will try to hold losing investments) and are risk avoiders when facing a gain (and thus will tend to realize winning stocks or investments). To explain the disposition effect, Shefrin and Statman (1985) also proposed other theories, such as those concerning mental accounting, regret aversion, and self-control. Andreassen (1988) related the disposition effect to investors' belief in short-term mean reversion. Similar points also received treatment in Lakonishok and Smidt (1986).
PoRTUGUESE JOURNAL OF MANAGEMENT STUDIES, VOL. XI/, NO. 2, 2007
longer). Using the same data set, i..ocke and Onayev (2005) investigated the relationship between trade duration and profitability and found that the duration for unprofitable trades is significantly longer than it is for profitable trades. This finding is also evidence of the disposition effect. Frino et al. (2004) compared different types of traders to one another and concluded that non-local traders exhibited a stronger disposition effect than the on-floor professional traders. Recently, Coval and Shumway (2005) have approached this issue from a different angle and used regression to investigate the relationship between traders' morning-trading performance and traders' afternoon-trading behavior. The researchers found that the traders were loss averse-that they became more risk-seeking when the morning-trading performance was poor.
It is critical that researchers study futures markets, which can yield significant information about the disposition effect. And it is equally critical to note that most empirical studies have reported a significant disposition effect. However, a conclusive test of it remains both difficult and, indeed, unrealized because the significance, as we mentioned earlier, might be attributable to competing hypotheses or to confounding effects. For this reason, our present study explores market behavior by using the tools of computational intelligence.
2.2 Agent-based Computational Finance
Rather than analyze the empirical data obtained from the activities of a real market, agent-based computational finance uses a different approach to study market behavior. Usually, an artificial market hosts multiple agents of multiple types who, by interacting dynamically with one another, determine the price of a financial product and other aggregate properties of the market. As Tsang and Martinez-Jaramillo (2004) mention, researchers in the field can learn important lessons from the work by LeBaron (2001), Farmer et al. (1999), and Tesfatsion (2001). With regard to computer-platform implementation, the Artificial Stock Market (ASM) developed by the Santa Fe Institute opened a new direction for much important work in this field.
PORTUGUESE JOURNAL OF MANAGEMEIVT STUDIES, VOL. X/1, NO. 2, 2007
over-confident agents. The purpose of the study was to determine how investors with behavioral biases affect asset price, and the researchers found that if there are considerable numbers of non-fundamentalists, the non-fundamentalists will survive and the traded price might significantly deviate from the fundamental value. Using a similar approach, Takahashi et al. (2004) discussed how passive investment strategy affects asset price.
While it is justifiable that we should refrain from using overly complicated agents, as suggested by LeBaron (2007), we found that the study by Takahashi and Terano (2003) and the study by Takahashi et al. (2004) open up a new direction for investigating behavior biases in financial markets and answer some of the most fundamental questions regarding irrational agents. However, we also notice that there are many modeling techniques that need to undergo refinement and many questions that await rigorous answers. In our study, we use a value function similar to that of Takahashi and Terano (2003) to formulate the investors' preference. However, the overall focus of our investigation concerns whether or not the value function suggested by prospect theory really leads to the observed disposition effect. We also want to see whether or not other trading strategies-not the S-shaped value function-can drive the disposition effect. Finally, we plan to examine the spot price and the futures pri.ce to determine how biased investors affect the CAPM.
3. DESIGN OF THE VIRTUAL FUTURES MARKET
U-Mart is a virtual futures market developed as a test-bed for investigating economic systems of futures markets; we borrowed it and adapted it to our study (Kita, Sato, and Mori, 2003; Ono et al., 2004; U-Mart Project, 2007). U-Mart allows for inputs of both computer-programmed agents and human agents. In our study, however, we consider only computer-programmed agents. U-Mart is also very flexible in parameter settings. It enables researchers not only to change the time-series data of spot price, the basic market settings such as sessions per day, and the agents' properties such as initial cash balance, but also to design new agents who possess specific risk attitudes and trading strategies.
PORTUGUESE JOURNAL OF MANAGEMENT STUDIES, VOL. )(}/, NO. 2, 2007
3.1 Assets Traded in the Market
The results of simulations can sometimes depend on the sequence of the spot price in use. The default spot price of U-Mart is called J30, which contains the actual data of the price index of stocks in Japan's stock market. Rather than use J30, we use a random work to simulate time-series data ranging from 4,000 to 8,000. The original purpose of generating these time-series data was to mimic the spot price of the price index of stocks in Taiwan's stock market. Although Taiwan's futures market is one of the largest 20 in the world, and although a reasonable object for our study would be one of the most important financial products in this market, we believe that the spot price chosen should have little effect on our results or on our conclusion.
3.2 Modeling of Investors' Behavior
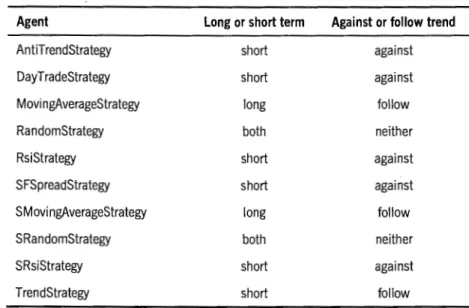
There are 10 different built-in agents in U-Mart. Usually, the agents take information such as the time-series data of spot prices, the time-series data of futures prices, current positions, and cash balances and treat this information as input. The agents then submit a limit price order as output. The main differences between various built-in traders center on the traders' strategies for forming (or predicting) the future price of a financial product and on the traders' strategies for submitting either a buy-limit order or a sell-limit order (based on the predicted price). The built-in traders in U-Mart are AntiTrendStrategy, DayTradeStrategy, MovingAverageStrategy, RandomStrategy, RsiStrategy, TrendStrategy, SFSpreadStrategy, SMovingAverageStrategy, SRandomStrategy, and SRsiStrategy. The first six strategies are the strategies that real-world investors often adopt as their decision criteria. On the basis of this naming scheme, we can easily identify ·the strategies as the anti-trend strategy, the day-trade strategy, the
moving-aver-age strategy, the random strategy, the relative-strength-index (RSI) strategy, and the trend strategy. The remaining four.strategies (SFSpreadStrategy, SMoving-AverageStrategy, SRandomStrategy, and SRsiStrategy) are strategies that mimic the aforementioned traditional investing strategies but that use spot price (instead of futures price) as the calculation basis. Table 1 lists some of the information regarding built-in agents.
Agent
AntiTrendStrategy
DayTradeStrategy
Movi ngAverageStrategy
RandomStrategy
RsiStrategy
SFSpreadStrategy
SMovingAverageStrategy
SRandomStrategy
SRsiStrategy
T rendStrategy
PORTUGUESE JOURNAL OF MANAGEMENT STUDIES, VOL. XI/, NO. 2, 2007
TABLE 1
U-Mart Built-in Agents
Long or short term Against or follow trend
short against
short against
long follow
both neither
short against
short against
long follow
both neither
short against
short follow
For the traders with the S-shaped value function, we used java code to build a new type of agent. We still partially used the built-in RandomStrategy to predict the futures price. In other words, to determine the predicted price, we randomly drew two values from a Gaussian distribution whose mean was the latest price. The major difference between our agent and the built-in RandomStrategy agents, however, is our use of an S-shaped value function to represent our agent's risk attitude. Although Kahneman and T versky ( 1979) did not explicitly specify the function form attributable to the value function proposed in their article, we believe the function forms used in formulating the utility curve in Utility theory is applicable here. Because the power function satisfies the property of decreasing absolute risk aversion and constant relative risk aversion, and because the power function is also relatively easy to manipulate, we use it in our study to formulate the value curve
{
xa
v(x)
=
- k(-x)a
if
X~0
if
X<0
(1)
PORTUGUESE JOURNAL OF MANAGEMENT STUDIES, VOL X//, NO. 2, 2007
passing through the reference point isS-shaped, so the agent is risk-averse when facing a gain and risk-seeking when facing a loss; and (3) the asymmetry of the value function (i.e., with k > 1) implies that the effect of losses is greater than the effect of gains.
FIGURE 1
Prospect Theory Value Function
loss eference point gain
For newly built agents with an S-shaped value function, the average price of their current positions serves as the reference point.
3.3 Determination of Traded Price
The U-Mart artificial futures market uses a double-auction method called "ltayose" to match orders and to determine the price. The ltayose method stores orders for a pre-determined period, and then all the orders are matched. Thus, only one price is settled during each session. This outcome differs from the outcome in the quote-driven trading system, where orders are continuously executed when the price and the numbers of lots match.
3.4 Measurement of the Disposition. Effect
PORTUGUESE JOURNAL OF MANAGEMENT STUDIES, VOL. XI/, NO. 2, 2007
sell winners. We use concepts suggested by Odean ( 1998). Odean defines the proportions of realized gains and losses, labeled PGR and PLR, by
PGR
PLR
realized gains realized gains + paper gains
realized losses realized losses+ paper losses
where the realized gains (losses) are the number of gain (loss) contracts realized and the paper gains (losses) are the number of contracts that investors could- but do not- realize as a gain (loss). The basic idea behind the PGR measure and the PLR measure is to count the number of contracts wherein an investor faces a gain (loss) and the number of times he or she opts to realize the gain (loss). These ratio metrics help control for the effects of market momentum.
4. RESULTS
4.1 Disposition Effects
We conducted many experiments on U-Mart. For each experiment, the trading period of the virtual market was 90 days, and eight sessions were held a day. Thus, each experiment featured 720 sessions. For the base case, in the value function, a is first set at 2/3 and k is set at 2. For these agents with S-shaped value functions, we found that the average PGR/PLR was 1.36. This finding indicates that the value function might be the main cause for the disposition effect.
4.2 Sensitivity Analysis
PORTUGUESE JOURNAL OF MANAGEMENT STUDIES, VOL. XI/, NO. 2, 2007
Effect of Changes in a on Disposition Effect
We first tested the effect that changes in a had on the magnitude of traders'
disposition effect, and to this end, we systematically changed the value of a, re-ran the experiment, and calculated PGR/PLR again. Table 2 summarizes the results
of the experiments. When a is close to 1, the value function is close to a straight
line, a finding that suggests that agents become more risk-neutral (regardless of
whether they are facing a loss or a gain). On the other hand, a smaller a makes the
value function more concave (risk-averse) when agents are facing a gain and more 'convex (risk-seeking) when agents are facing a loss. This effect did show up in their trading behavior. For example, the proportion of realized gains was not
significantly higher than the proportion of realized losses when a equals 1 and 11/
12. This finding indicates that agents with a flatter value curve will behave like a build-in agent who follows a random investing strategy. While this finding might reveal some of the constraints that characterize our newly built agents (because, by our default setting, they do not use an investing strategy more sophisticated than random strategy), the findings can also verify the correctness of the setting of the new agents.
TABLE 2
The Effect of Changes in a on PGR!PLR (Market Order)
1 11/12 4/5 2/3 1/2 1/8
Max. 1.18 1.17 1.93 2.07 2.26 2.08
Min. 0.81 0.82 0.85 0.79 0.78 1.02
Mean 1.01 1.03 1.21 1.36 1.43 1.46
Median 1.04 1.08 1.12 1.29 1.35 1.36
Sd. Dev. 0.11 0.12 0.34 0.52 0.57 0.40
PGR/PLR > 1' No No Yes Yes Yes Yes
* level of significance = 0.05
On the other hand, when a became smaller (i.e., the value curve became
more concave or more convex), we observed a negative correlation between a and
PORTUGUESE JOURNAL OF MANAGEMENT STUDIES, VOL. XI/, NO. 2, 2007
value function and the disposition effect. After agents dynamically interacted with one another, the bottom-level risk attitudes and the fundamental value systems that were built into the agents held up in output behavior and led the agents (traders) to realize gains more often than realize losses.
However, we also found that when a became smaller, the variation of PGR/ PLR between agents became larger. This phenomenon is easily detectable in Figure 2. Because traditional statistical analyses (such as analysis of variance) usually require the homoscedasticity assumption regarding their random components, the seeming violation of the eq ua I-va riance assumption might hinder add itiona I analyses and weaken the power of our inferences. More simulations and experiments need to be conducted for clarification of the issue.
FIGURE 2
The Effect of Changes in aon PGRJPLR (Market Order)
L....:....J L...:...J
11/12 4/5 2/3 1/2 1/8
Power
Effect of Changes in k on Disposition Effect
PORTUGUESE JOURNAL OF MANAGEMENT STUDIES, VOL X//, NO. 2, 2007
specific amount of money) is much greater than the effect of gains (the pleasure that one experiences in obtaining the same amount of money). Figure 3 summarizes the results for the simulations with k
= 2 (base case) and
k= 8.
FIGURE 3
The Effect of Changes in k on PGR!PLR (Market Order)
0
C\i
10
ci
0
ci
11/12 4/5 2/3 1/2
power
PORTUGUESE JOURNAL OF MANAGEMENT STUDIES, VOL. XI/, NO. 2, 2007
Effect of Order-type Changes on Disposition Effect
In analyses discussed so far, we allow the newly built agents to use a market order when they buy or sell futures contracts. However, in futures markets, limit orders might be more common owing to the high leverage. We thus tested the effect that changes in order types have on disposition effect. At the same time, we also tested the effect that changes in a had on the magnitude of traders' disposition effect. Table 3 summarizes the results of the experiments.
TABLE 3
The Effect of Changes in a on PGRJPLR (Limit Order)
1 11/12 4/5 2/3 1/2
Max. 1.04 1.12 0.98 1.08 1.79
Min. 0.32 0.45 0.48 0.56 0.63
Mean 0.67 0.75 0.73 0.86 1.02
Median 0.68 0.76 0.76 0.84 0.90
Sd. Dev. 0.19 0.22 0.17 0.23 0.40
PGR/PLR < 1* Yes Yes Yes Yes No
* level of significance = 0.05
Similar to what we obtained from the market-order case, when limit order is the primary order type used by the agents who correspond to the S-shaped value curve, the PGR/PLR ratio is still negatively correlated to the value of a. A flatter value curve exhibits much weaker disposition effects. Thus, we can conclude that the S-shaped value curve significantly affects traders' propensity to hold losers and to sell winners regardless of the order type. However, we also found that the mean PGR/PLR ratios are significantly smaller than 1 for various a when the limit order is the primary buy-or-sell option used by the traders. In other words, the trading behaviors attributable to even·traders reflective of the S-shaped value curves do not reveal the disposition effects suggested by Shefrin and Statman (1985).
PORTUGUESE JOURNAL OF MANAGEMENT STUDIES, VOL. XJ/, NO. 2, 2007
a more accurate measurement. Feng and Seasholes (2005) showed that the metrics of PGR and PLR, because they examine only an investor's portfolio on a trading day, might neglect the value of holding-time information. Further studies should address the issues discussed here.
FIGURE 4
The Effect of Changes in a on PGR/PLR (Limit Order)
c:: ..--,--,
...J ..--,--,
I
a. oc ~
C) ~ ..--,--, a.
..--,--,
i
i
i
'--'--''--'--'
"'
0'--'--' '--'--'
'--'--'
11/12 4/5 2/3 1/2
power
4.3 Is Disposition Effect Really a Behavioral Bias?
The next issue investigated in this study is the link between the magnitude of the disposition effect and the cumulated profit level of the agents. According to normative decision theory, the bounded rationality (or the biases) in humans' judgments will lead to inferior decisions (and usually to inferior outcomes). However, previous empirical studies argued that rational investment strategies can drive the disposition effect, which can thus sometimes lead to better performance (see, for example, Locke and Onayev, 2005).
PoRTUGUESE JOURNAL OF MANAGEMENT STUDIES, VOL. XI/, NO. 2, 2007
between PGR/PLR and investment performance. In other words, traders' propensity to sell winners more (frequently) than losers will lead to inferior return on investment. We also found that a trader can break even when his or her PGR/PLR ratio is approximately 1. As discussed before in our sensitivity analyses, for the traders who use primarily the market-order buy-or-sell mechanism, their loss aversion leads to higher PGR/PLR (i.e., a stronger disposition effect), and the stronger disposition effect leads to inferior return on investment. However, for the traders who use primarily limit buy-or-sell orders, the PGR!PLR ratios are usually less than 1. This indicates that the traders with S-shaped value curves can out-perform other (built-in) traders. Thus, in our experiments, we were not able to reach the conclusion that the agents with a prospect theory value function made an average profit that was lower than the market average.
Although some of the earlier empirical studies showed that the disposition sometimes positively correlated to the discipline of market professionals (i.e., floor traders), such a finding did not surface in our case because our agents did not possess the semi-fundamental information possessed especially by floor traders. Thus, more experiments (using different spot prices and different proportions of built-in traders) might further clarify this issue.
0:::
--'
[l_
2.5 2.0
ii: 1.5
(!)
[l_
1.0 0.5
FIGURE 5
The Relationship Between PGR/PLR and Investment Performance
-10"6
0
"' 0 0 0 8"
0 0 0
o ogooO ooo (o
0 0
o o dlo§ o o o
0 0 ·10"6 0 oo 0 Investment Performance 0 0
0 0
00
PORTUGUESE JOURNAL OF MANAGEMENT STUDIES, VOL. X//, NO. 2, 2007 4.4 Performance of Built-in Agents
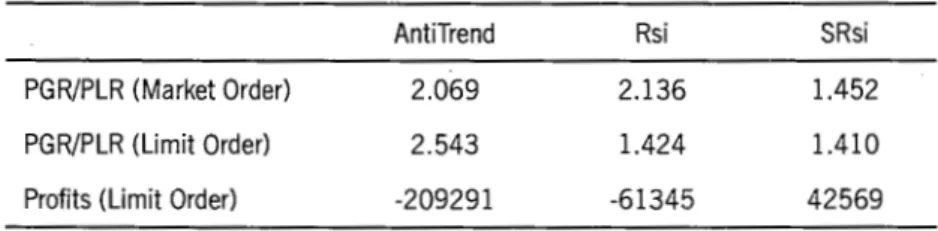
Because the empirical studies indicate that the disposition might rest on the semi-fundamental information possessed by specific types of investors or on the rational expectations of investors (such as the short-term mean reversion), we investigated the trading behaviors of built-in agents- those who possess a different trading strategy but who do not possess prospect theory value functions). We used the setup of the base case mentioned above to execute the simulation, and found that traders with three built-in strategies (AnitTrendStrategy, RsiStrategy, SRsiStrategy) exhibited significant disposition effects, regarrlless of order type. Table 4 summarizes the simulation results.
TABLE 4
Disposition Effect and Performance of Built-in Agents
PGR/PLR (Market Order)
PGR/PLR (Limit Order)
Profits (Limit Order)
Ant iT rend
2.069
2.543
-209291
Rsi
2.136
1.424
-61345
SRsi
1.452
1.410
42569
As discussed in the artificial futures market setup, agents who exhibit significant disposition effects use strategies that go against the trend of futures prices. In other words, all these agents expect a short-term mean reversion. Thus, we conclude that rational expectation can easily drive the disposition effect. However, not all agents who strategize in opposition to the trend exhibit significant disposition effects.
When we compared the mean PGR/PLR ratios for built-in agents who had above three investment strategies with the mean PGR/PLR ratios for the newly built agents who reflected the S-shaped value function, we found that these investment strategies triggered even stronger disposition effects than did the prospect theory value function. This finding brings up two additional issues. First, we might need to investigate further the observed disposition effect in the real financial markets to find out if it is driven mainly by the fundamental value system or mainly by specific investment strategies. Second, it would also be interesting to learn how these two factors interact with each other.
When exploring the relationship between observed disposition effects and observed investment performances for three built-in traders who exhibited PGR/
PLR > 1, we found that a higher PGR/PLR does not necessarily lead to poor
PORTUGUESE JOURNAL OF MANAGEMENT STUDIES, VOL. XI/, NO. 2, 2007
had a comparatively high mean PGR!PLR, they out-performed most of the traders during this simulation period. More experiments using different spot prices and different proportions of built-in traders might clarify this issue.
5. DISCUSSION AND CONCLUSION
In this study, we have used the tools of computational intelligence (instead of empirical analysis) to explore futures-market behavior and the causes of traders' disposition effects. We found that the S-shaped value curve proposed by prospect theory may be one of the causes of the observed behavior of the disposition effect, and this finding is consistent with the results obtained from empirical studies. However, we also found that some of the built-in investment strategies can drive even stronger disposition effects than the prospect theory value function. Furthermore, when exploring the relationship between disposition effects and profitability, we found that the results are not conclusive. Although we can identify a significant negative correlation between PGR!PLR and the investment performance for traders with S-shaped value functions, these traders' performance can sometimes out-perform other (built-in) traders, especially when traders are using limit orders as the primary buy-or-sell mechanism. Other experiments might further clarify this issue.
The contributions of this study are twofold. First, we have applied a new agent-based approach to our examination of the disposition effect. This procedure offers a precious opportunity for us to identify the different causes of the disposition effect and their relative importance. Second, this procedure offers us improved evidence that disposition may stem from rational investment strategy, rather than from the S-shaped value curve.
PORTUGUESE JOURNAL OF MANAGEMENT STUDIES, VOL. XI/, NO. 2, 2007
ACKNOWLEDGEMENTS
This material is based upon work supported in part by the ROC National Science Council under grant number NSC 95-2416-H-155-013. Any opinions, findings, and conclusions or recommendations expressed herein are those of the authors and do not necessarily reflect the views of the sponsor.
References
Andreassen, P. (1998). Explaining the Price-volume Relationship: The Difference Between Price
Changes and Changing Prices. Organizational Behavior and Human Decision Processes, 41,
371-389
Coval, J. and Shumway, T. (2005). Do Behavioral Biases Affect Prices? Journal of Finance, 60,
1-34.
Farmer, J. (1999). Physicists Attempt to Scale the Ivory Towers of Finance. Computing in Science
and Engineering, 1(6), 26-39.
Feng, L. and Seasholes, M.S. (2005). Do Investor Sophistication and Trading Experience Eliminate
Behavioral Biases in Financial Markets? Review of Finance, 9, 305- 351.
Ferris, S., Haugen, R. and Makhija, A. (1988). Predicting Contemporary Volume with Historic
Volume at Differential Price Levels: Evidence Supporting the Disposition Effect. Journal of
Finance, 43, 677- 697.
Frino, A., Johnstone, D., and Zheng, H. (2004). The Propensity for Local Traders in Futures Markets
to Ride Losses: Evidence of Irrational or Rational Behavior? Journal of Banking & Finance,
28, 353- 372.
Garvey, R. and Murphy, A. (2004). Are Professional Traders Too Slow to Realize Their Losses?
Financial Analysts Journal, 60, 35- 43.
Genesove, D. and Mayer, C. (2001). Loss Aversion and Seller Behavior: Evidence from the Housing
Market. Quarterly Journal of Economics, 116, 1233- 1260.
Heisler, J. (1994). Loss Aversion in a Futures Market: An Empirical Test. Review of Futures Markets,
13, 793-826.
Kahneman, D. and Tversky, A. (1979). Prospect Theory: an Analysis of Decision under Risk.
Econometrica, 47, 263-291.
Kita, H., Sato, H., and Mori, N. (2003). U-Mart System, Software for Open Experiments of Artificial
Market. In Proceedings of 2003 IEEE International Symposium on Computational
Intelli-gence in Robotics and Automation, July 16-20, Kobe, Japan (pp. 1328 -1333).
Lakonishok, J. and Smidt, S. (1986). Volume for Winners and Losers: Taxation and Other Motives
for Stock Trading. Journal of Finance, 41, 951- 974."
LeBaron, B. (2001). A Builder's Guide to Agent Based Financial Markets. Quantitative Finance, 1,
254-261.
LeBaron, B. (2007). Agent-based Computational Finance, In L. Tesfatsion and Judd, K. (Eds.), The
Handbook of Computational Economics, Vol. II (pp. 1187- 1234). Amsterdam: North Hol-land.
Locke, P. and Mann, S. (2005). Professional Trader Discipline and Trade Disposition. Journal bf
Financial Economics, 76, 401- 444.
Locke, P. and Onayev, Z. (2005). Trade Duration: Information and Trade Disposition. The Financial
Review, 40, 113- 129.
Odean, T. (1998). Are Investors Reluctant to Realize Their Losses? Journal of Finance, 53,
PORTUGUESE JOURNAL OF MANAGEMENT STUDIES, VOL. XI/, NO. 2, 2007
Ono, 1., Mori, N., Sato, H., Kita, H., Matsui, H., and Nakajima, Y. (2004). U-Mart System Version
2: A Multi-purpose Artificial Market Simulator. In Proceedings of the 3rd International
Work-shop on Agent-based Approaches in Economics and Social Complex Systems, May 27-29,
Kyoto University, Kyoto, Japan (pp. 217- 224).
Shapira, Z. and Venezia, I. (2001). Patterns of behavior of professionally managed and independent
investors. Journal of Banking and Finance, 25, 1573- 1587.
Shefrin, H. and Statman, M. (1985). The Disposition to Sell Winners Too Early and Ride Losers Too
Long: Theory and Evidence. Journal of Finance, 40, 777- 792.
Takahashi, H. and Terano, T. (2003). Agent-based Approach to Investors' Behavior and Asset Price
Fluctuation in Financial Markets. Journal of Artificial Societies and Social Simulation, 6(3).
Retrieved July 31, 2007, from http://jasss.soc.surrey.ac.uk/6/3/3.html
Takahashi, l;l., Takahashi, S., Tsuda, K., and Terano, T. (2005). Analysis Passive Investment
Strat-egies and Asset Price Fluctuation in Financial Market Through Agent. In Terano, T., Kita, H.,
Kaneda, T., Arai, K., and Deguchi, H. (Eds.), Agent-based Simulation: From Modeling
Meth-odologies to Real-world Applications, Post-proceedings of the Third International Workshop on Agent-based Approaches in Economic and Social Complex Systems 2004 (pp.
144-157), New York, Springer.
Tesfatsion, L. (2001). Agent-based Computational Economics: A Brief Guide to the Literature. In
Michie J. (Ed.), Reader's Guide to the Social Sciences, Volume 1. London, Fitzroy-Dearborn.
Tsang, E. and Martinez-Jaramillo, S. (2004). Computational Finance. IEEE Computational
Intelli-gence Society Newsletter, August, 8- 13.
U-Mart Project (2007). Retrieved July 31, 2007, from http://222.u-mart.econ.kyoto-u.ac.jp/
Resumo
Um dos padr6es comportamentais que se desvia do previsto pelas teorias financeiras tradicionais e
o efeito disposi~<ao. Embora a maioria dos estudos empiricos reporte um efeito disposi~<ao significative, as
investigadores conduziram testes ainda nao conclusivos deste efeito, dado existirem hip6teses concorrenciais au efeitos multiplos que podem explicar a significancia documentada. Oeste modo, neste estudo sao utilizadas ferramentas de inteligencia artificial como alternativa aos processos empiricos para explorar o comportamento nos mercados. Em particular, permite-se que agentes com diferentes estrategias de inves-timento interajam e compitam uns com as outros num mercado de futuros artificial. Concluimos que a
curva S proposta pela prospect theory pode ser uma das causas da observa~<ao do comportamento de
efeito disposi~<ao. No entanto, a expectativa racional, tal como a reversao para a media no curta prazo pode
desempenhar um papel ainda mais decisivo.