On the Use of the Quality Function Deployment
Matrix for Flexible and Quantitative Prioritization
André S. Domingos, João Carlos M. Silva, José Azevedo Pereira
Instituto Universitário de Lisboa (ISCTE-IUL), Lisbon, Portugal E-mail: asdss@iscte-iul.pt; joao.silva@iscte.pt; jpereira@iseg.ulisboa.ptAbstract—The QFD methodology is totally directed to the
client instead of the product, wherein the effort from all the involved departments allows the match between the client’s requirements and the offered product. Therefore, it is necessary to determine the engineering characteristics that aim at satisfying those customer attributes. These engineering characteristics must be measurable, in order to provide analysis and optimization opportunities. Afterwards, the prioritization of these engineering characteristics is carried out so that they are performed in the most efficient way. Throughout the paper, the authors propose the design of a new simple, flexible and quantitative methodology of activities prioritization. Strategic planning is introduced in the QFD methodology of organization and proposes the minimization of possible incompatibilities that may arise between its capabilities and customer requirements. Business variables are introduced at different stages of the design in order to calculate with greater precision the value resulting from the prioritization and to allow nullity or uniformity of the relative importance of customer attributes. The qualitative fulfillment of the correlations of the QFD methodology is replaced by a quantitative aspect that aims to minimize the filling of errors and interpretation when using the methodology. At the end of the paper, an example of planning the design of a smartphone using the new methodology is given.
Index Terms—normalization, prioritization, quality function deployment, strategic planning1
I. INTRODUCTION
Quality Function Deployment (QFD) is based on a concept of quality control that focuses and coordinates skills within the organization, starting with the planning step and later conception of products with value to the client [1]. It is also based on a Total Quality Management (TQM) philosophy, which is totally directed to the client instead of the product [2] resulting in an important management tool that adapts the dynamic of the process.
It is essential to identify and segment the clients (or stakeholders) and collect their needs through one of the following methodologies: Voice of Customer (VOC) or Voice of Stakeholder (VOS) [3]. Their needs are handled and then transcribed for each phase of the product’s life
Manuscript received July 1, 2017; revised August 23, 2017. We gratefully acknowledge financial support from FCT- Fundação para a Ciencia e Tecnologia (Portugal), national funding through research grant (UID/SOC/04521/2013).
cycle [4] – this is hard to accomplish and its difficulty derives from the fact that we intent to define what our client really wants instead of what we think he wants [2].
After gathering the client’s needs, we proceed to the translation of the items on the VOC/VOS to the customer attributes (what we will design). The functional and non-functional requirements are now identified and have different importance levels to the clients. Therefore, they should be labeled by relative importance from the information gathered from the client/stakeholder [3].
The next step should be carried out only by the organization and it defines which are the engineering of characteristics executed to accomplish the customer attributes. These actions aim at affecting one or more customer attributes and must be measurable in order to provide analysis and optimization opportunities [2]. After identifying and choosing the main initial elements, the prioritization of the actions to be executed must be made, in order to maximize efficiency and yield the greatest value both to the company and the client.
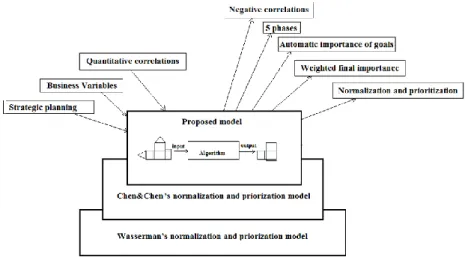
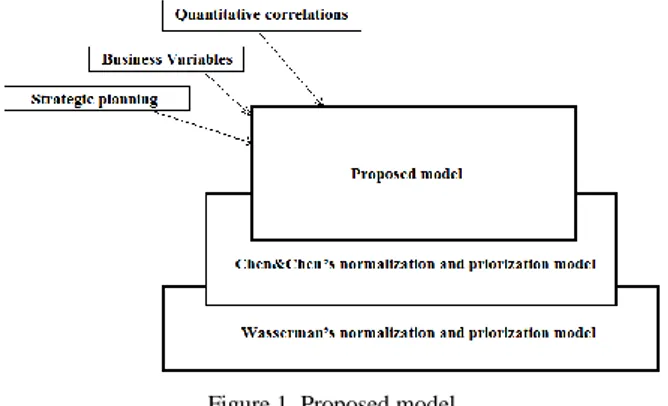
Figure 1. Proposed model
Numerous methods of prioritizing actions in order to meet requirements have been proposed and adopted over several years. The majority of these methods and its variants were (directly or indirectly) developed based on the normalization and prioritization model proposed by Wasserman [5], in which is developed a linear programming model that considers the correlation between the engineering characteristics (to achieve the customer attributes) as a vector space and all values of the correlations between items are normalized in order to achieve consistency. This model is considered complete but has some problems related to the values of normalized correlations. Thus, the authors Chen & Chen (2014) [6]
introduced improvements in the algorithm in order to enhance the accuracy of the resulting values of prioritization. The authors of this paper analyzed and improved the study presented by Chen & Chen (2014) [6] to develop a new flexible and quantitative model of actions’ prioritization. The proposed model integrates strategic planning, independent business variables involved in each phase of QFD and the filling of the correlation matrix exclusively numerical–Fig. 1.
II. RELATED WORK
The users of QFD methodology and the client define the importance for each customer attribute to include in the product matrix, where the sum of the degree of importance must equal 100, regardless of the number of requirements – Fig. 2. The values that are at the intersection between customer attributes and engineering characteristics are defined by intercorrelation and can be depicted on a scale that varies between 0 (no correlation), 1 (weak correlation), 3 (medium correlation) and 9 (strong correlation) [7].
Figure 2. Correlation and relative importance. Based on Wasserman [5] The client’s attributed importance to each requirement is referred to as degree of relative importance (𝑑𝑖), and is
used in the calculation of the Demanded Weight for each requirement. This value represents the sum of the correlation line multiplied by the degree of importance that is obtained by (1), where 𝑑𝑖 represents the degree of
relative importance and 𝑅𝑖,𝑗 the correlation between the
customer attribute 𝑖 and the engineering characteristic 𝑗). However, these values are not subsequently used to calculate the priority of execution of the actions. Instead, the Relative Demanded Weight, which is nothing more than the Absolute Demanded Weight expressed as percentages, is used. 𝑤𝑗′= 𝑑𝑖∙ ∑ 𝑅𝑖,𝑗 𝑛 𝑖=1 (1) In order to improve the perception of the data present in the matrix, Wasserman normalizes the QFD input values. Equation (2) defines the new value corresponding to the new correlation between the 𝑖(customer attribute) and 𝑗 (engineering characteristic) which is calculated using the correlation value divided by the row sum of several correlations. However, this solution can only be used when the engineering characteristics involved are totally independent, which in practice is not possible.
𝑅𝑖𝑗 ′ =
𝑅𝑖𝑗
∑𝑛𝑗=1𝑅𝑖,𝑗 (2)
Therefore, Wasserman [5] extends the normalization in order to incorporate the dependence of the engineering characteristics - represented by the top triangle at the House of Quality (HoQ) – Fig. 3. Equation (3), based on (2), shows a new value of correlation, taking into account the intra-correlation 𝛾 between 𝑘 and 𝑗 (engineering characteristics).
Figure 3. HoQ structure of Wasserman
𝑅𝑖,𝑗′′ =
∑𝑛𝑘=1𝑅𝑖,𝑘∙ 𝛾𝑘,𝑗
∑𝑛𝑗=1∑𝑛𝑘=1𝑅𝑖,𝑘∙ 𝛾𝑘,𝑗 (3)
However, this equation indicates a huge incongruity associated with the emergence of intercorrelation when previously it was null [6] – Fig. 4. To avoid this situation, Chen & Chen [6] propose a new normalization model (4) based on the previous equation, where 𝛾𝑘𝑗∈ [ −1, 1] and
𝛾𝑘𝑗 = 1 when 𝑘 = 𝑗. One detail that should be taken into
account is when ∑𝑛𝑘=1𝛾𝑘𝑗 ≤ 0, in this case the project team should recheck the correlations or even the actions [6].
𝑅′′′𝑖𝑗=
(∑𝑛𝑘=1𝛾𝑘𝑗) ∙ 𝑅𝑖𝑗
∑𝑛𝑗=1( ∑𝑛𝑘=1 𝛾𝑘𝑗) ∙ 𝑅𝑖𝑗 (4)
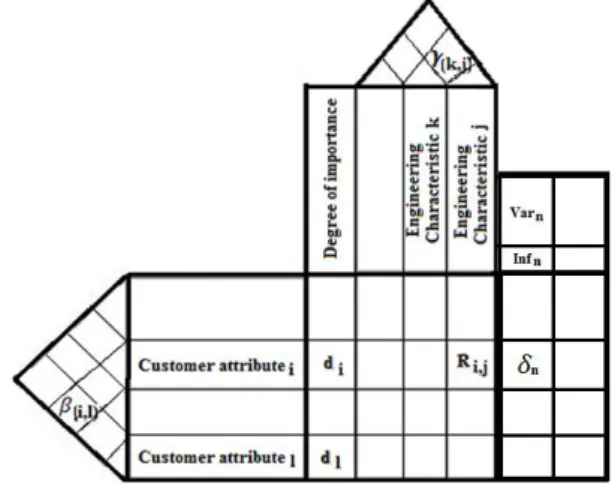
Therefore, the central matrix of HoQ is normalized, but we still need to explore the influence of dependence of customer attributes for the calculation of the engineering characteristics’ priority. Regarding this field, Wasserman [5] assumes that all requirements are mutually independent. On the other hand, Chen & Chen [6] develop (5), which includes the possible existence of several dependence levels between all customer attributes involved in this methodology – Fig. 5.
Figure 4. Comparison of normalization algorithms [6]
Figure 5. HoQ structure of Chen & Chen
Equation (5) gives us the final degree of importance (𝑑𝑖), decided by the customer at the customer attributes’
collection, along with the values of dependence 𝛽 of customer attributes 𝑖 𝑎𝑛𝑑 𝑙 where 𝛽𝑖𝑙 can be [0-1-3-9].
𝑑𝑖′′′′=
( ∑𝑚𝑙=1𝛽𝑖𝑙 ) ∙ 𝑑𝑖
∑𝑚𝑖=1( ∑𝑚𝑙=1𝛽𝑖𝑙) ∙ 𝑑𝑖 (5)
At this point, all the elements needed for determination of execution priority are gathered. Chen & Chen [6] consider that through the (6) is possible to determine the technical importance rating, also known as priority execution, for each engineering characteristic 𝑗 and then sort the results to obtain the most priority.
𝑤′′′
𝑗= ∑ 𝑑𝑖′′′′∙ 𝑅′′′𝑖𝑗 𝑚
𝑖=1
(6) Fig. 6 represents the influence of Chen & Chen’s normalization and prioritization algorithm in the input matrix.
Figure 6. Output matrix of Chen & Chen’s algorithm The core structure of the prioritization has been fully displayed, but the flexibility of the QFD allows the user to add any other information that might be useful to the decision making [2].
According to the study performed by Wasserman [5] and updated by Chen & Chen [6], the authors of this publication propose a model that integrates negative correlations, strategic planning and business variables in QFD methodology based on Chen & Chen’s work.
III. SOLUTION DESIGN
We begin by deciding which values to use in the filling of the QFD. Subsequently, the strategic planning is presented, minimizing the risk of failure between the capabilities of the organization and the customer attributes,
adding a new phase to QFD (Fig. 7). At the end of this section the new equations that integrate business variables are represented. These equations allow absence or uniformity of choosing the customer attributes’ relative importance degree. In this publication it is assumed that the data present in the matrix is consistent, in order to simplify the problems related with uncertainty.
A. Quantification and Correlations Values
QFD performs the transfer of multiple sets of information through its phases – Fig. 7, also known as deployments. These deployments promote the transformation of sets in other sets endowed with more details [3] – Fig. 8. In this subsection, we aim to demonstrate which language is used in the quantification and prioritization along these transfers.
Figure 7. Four-phase of QFD
Figure 8. Transfer of information between phases The language used allows the use of all operators and
mathematical techniques capable of managing real numbers [7]. Instead of commonly used scales, Classical and Modern QFD [3], this one has negative elements in order to cover all other events between the several items that are notoriously incompatible. The 7 points scale to use is: {-9; -3; -1; 0; 1; 3; 9}, wherein ±9 is for a strongly positive/negative correlation, ±3 for a moderate positive/negative correlation, ±1 for a weak positive/negative correlation and 0 when there is no correlation. In other words, we performed the uniformity of values used in the correlations – TABLE I.
TABLEI.COMPARISON OF THE CORRELATION VALUES Wasserman (1993) [5] Chen & Chen
[6] Proposed model 𝑅𝑖𝑗 [0 − 1 − 3 − 9] [0 − 1 − 3− 9] ±[1 − 3 − 9] and 0 𝛾𝑘𝑗 [−1; 1] [−1; 1] 𝛽𝑖𝑙 - [0 − 1 − 3− 9]
Unlike the models discussed, this proposed model leaves the graphical representation of the correlations for a numerical representation in order to minimize potential misreads.
B. Strategic Planning
After determining which scales will be used in the normalization and prioritization of the multiple items, we do a strategic planning within the organization that we are
adjacent to. This step allows that the requirements chosen are those that can be realized and are not out of the organization’s capabilities.
This publication explored the Internal Factors Analysis Summary (IFAS), External Factors Analysis Summary (EFAS) approach. Both are composed of four columns – TABLE II: The first is the name of the item. The second is the weight of each item that is rated from 0 to 1 and the sum of the weights of all the items must be equal to 1. The third column is the rating between 1 and 5, and represents the organization's ability to act towards that item. Finally, the last column calculates the weighted score resulting from multiplication between the weight and the rating. The sum of the weighted score is commonly used in benchmarking comparisons.
TABLE II.STRUCTURE OF FACTORS ANALYSIS SUMMARY
Name Weight Rating Weighted Score
Item1 0.25 2 0.50
Item2 0.25 1 0.25
Item3 0.50 5 2.5
Faced with the original table of IFAS and EFAS, the authors of this publication add a fifth column which allows determine a value that indicates how much the item needs to be improved. This column is denominated by improvement indicator and it is determined by (7). The rating is inverted in order of the obtained value be increased as the need to improve.
𝐼𝑚𝑝𝑟𝑜𝑣𝑒𝑚𝑒𝑛𝑡 𝐼𝑛𝑑𝑖𝑐𝑎𝑡𝑜𝑟𝑖𝑡𝑒𝑚
= 𝑤𝑒𝑖𝑔ℎ𝑡𝑖𝑡𝑒𝑚 ∙ (6
− 𝑟𝑎𝑡𝑖𝑛𝑔𝑖𝑡𝑒𝑚)
(7)
Having realized the fulfillment of IFAS and EFAS tables emerges the strategy table – TABLE IV - with items from previous tables and a value of suggested importance for each item 𝑚 – (8).
𝐼𝑚𝑝𝑡𝑚= (∑ 𝐼𝑚𝑝𝑟𝑜𝑣𝑒𝑚𝑒𝑛𝑡 𝐼𝑛𝑑𝑖𝑐𝑎𝑡𝑜𝑟𝐼𝑚𝑝𝑟𝑜𝑣𝑒𝑚𝑒𝑛𝑡 𝐼𝑛𝑑𝑖𝑐𝑎𝑡𝑜𝑟𝑚
𝑛 #𝑡𝑜𝑡𝑎𝑙𝐼𝑡𝑒𝑛𝑠(𝐼𝐹𝐴𝑆+𝐸𝐹𝐴𝑆)
𝑛=1
) ∙ 100 (8)
This step adds a new phase in QFD methodology and thus enables the alignment of strategy with the planning and design of the product – Fig. 9.
TABLEIII.STRUCTURE OF FACTORS ANALYSIS SUMMARY WITH IMPROVEMENT INDICATOR
IFAS or EFAS Table
Name Weight Rating Weighted
Score Improvement indicator Item1 0.25 2 0.50 1 Item2 0.25 1 0.25 1.25 Item3 0.50 5 2 0.50
TABLEIV.STRUCTURE OF STRATEGIES’TABLE Strategies
Name Suggested Importance
Item1 36.4%
Item2 45.5%
Item3 18.2%
Figure 9. Five-phase of QFD
C. Business Variables, Normalization and Prioritization Equations
All the elements are ready to proceed with the normalization and subsequent prioritization. The following equations are used in the new flexible and quantitative methodology to calculate the priority of items throughout the several stages of HoQ.
After the contact with the client, the gathering of needs and translation into customer attributes, determination of strategies and the correlation matrix filling (with the range of the aforementioned values), it’s time to begin defining what items will be performed in first instance.
It is essential to be aware that the client does not always provide all the information needed to design the product. Given this situation, we must optimize all the information that is provided in order to reach the goals.
Figure 10. HoQ structure of proposed model
Supposing that the client does not provide the degree of importance to each customer attribute, we need to collect this information through other means. These business variables are applied only to items that are in horizontal position for each phase of the methodology – Fig. 10. Each business variable has a name and weight.
Through the weight (𝐼𝑛𝑓𝑛) and the correlation (𝛿𝑛) with
the item 𝑖 you can determine the value of relative importance (11) – when it is missing (100% of importance) or influence the value of relative importance provided by the client (𝑥), when we can apply it (12). In equation (11) and (12) the symbol 𝛽 shows the intra-correlation between the list of customer attributes items 𝑖 and 𝑙 (Fig. 2) and 𝑑𝑖
shows the importance provided by the client to item 𝑖 𝐵𝑢𝑠𝑖𝑛𝑒𝑠𝑠 𝑉𝑎𝑟𝑖𝑎𝑏𝑙𝑒 𝐼𝑚𝑝𝑜𝑟𝑡𝑎𝑛𝑐𝑒𝑚 = ∑ 𝐼𝑛𝑓𝑛 ∙ 𝛿𝑚,𝑛 #𝐵𝑢𝑠𝑖𝑛𝑒𝑠𝑠𝑉𝑎𝑟𝑖𝑎𝑏𝑙𝑒 𝑛=1 (10) 𝑑′′𝑖= ( ∑𝑚 𝛽𝑖,𝑙 ) ∙ 𝐵𝑢𝑠𝑖𝑛𝑒𝑠𝑠 𝑉𝑎𝑟𝑖𝑎𝑏𝑙𝑒 𝐼𝑚𝑝𝑜𝑟𝑡𝑎𝑛𝑐𝑒𝑖 𝑙=1 ∑ ( ∑𝑚𝑖=1 𝑚𝑙=1𝛽𝑖,𝑙 ) ∙ 𝐵𝑢𝑠𝑖𝑛𝑒𝑠𝑠 𝑉𝑎𝑟𝑖𝑎𝑏𝑙𝑒 𝐼𝑚𝑝𝑜𝑟𝑡𝑎𝑛𝑐𝑒𝑖 (11) 𝑑′′′𝑖 = 𝑑′′𝑖∙ 𝑥 100+ ( ( ∑𝑚𝑙=1𝛽𝑖,𝑙 ) ∙ 𝑑𝑖 ∑𝑚𝑖=1( ∑𝑚𝑙=1𝛽𝑖,𝑙 ) ∙ 𝑑𝑖) ∙ 1 − 𝑥 100 (12)
Finally, the remaining equations to achieve the prioritization values are (3) to normalize the values of intercorrelation matrix and (6) to achieve the prioritization values. The value of 𝑑𝑖′′′′ – on (6) – can be 𝑑′′′𝑖 (11) or
𝑑′′′𝑖 (12), it depends on the situation provided by the
IV. EVALUATION
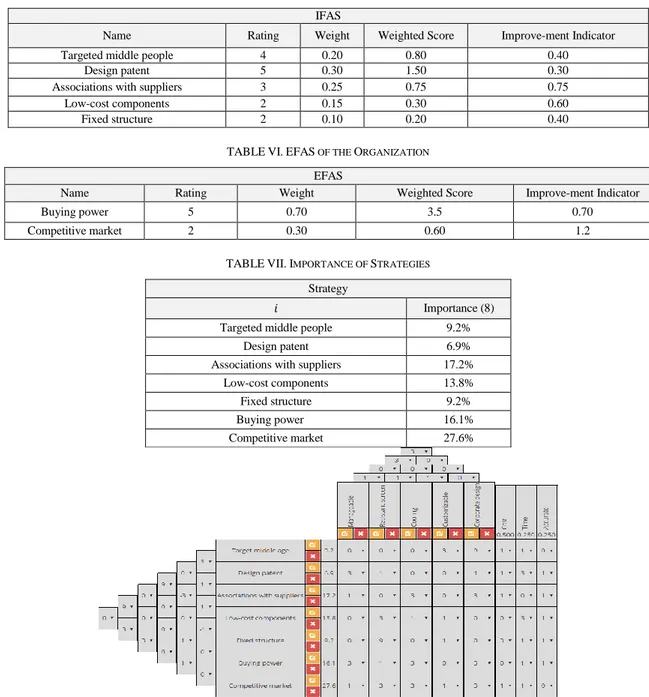
In the following example, we assume that the first steps of the QFD method are already accomplished. The client has chosen the following items as customer attributes: Manageable, Resistant screen, Cooling, Customizable, Corporate design. The organization is new on the market and before accepting the requirements, it is performed a strategic analysis – TABLE V, VI, VII.
At this point, it is possible to perform the intercorrelation between the strategy and the customer attributes to avoid potential problems – Fig. 11. The following business variables are used: cost, time and accurate, being that each of the variables possesses a distributed influence of 50%, 25% and 25%, respectively. Therefore, the equations used in the calculation are the following: (4) for normalization of the intercorrelation matrix values, (12) to define the importance of each item
of strategy and (6) (business variables were used and influenced the final importance value by 50%) for the prioritization of items of the customer attributes.
As can be seen in Fig. 12, the customer attributes have the following priority values, which are transferred as the relative importance to the next stage of the methodology – Fig. 8.
In the second phase (Customer attributes/Engineering characteristics), the user reunites with its team and both define which actions need to be accomplished in order to reach the goals for this stage. Light materials, metal structure, insulation and glass screen are the chosen items. Taking the relative importance of the goals from the previous phase into account, the second phase input matrix is filled – Figs. 13 and 14. The same procedure is used to calculate the Customer attributes’ importance (5) and the priority of the Engineering characteristics (6). TABLEV.IFAS OF THE ORGANIZATION
IFAS
Name Rating Weight Weighted Score Improve-ment Indicator
Targeted middle people 4 0.20 0.80 0.40
Design patent 5 0.30 1.50 0.30
Associations with suppliers 3 0.25 0.75 0.75
Low-cost components 2 0.15 0.30 0.60
Fixed structure 2 0.10 0.20 0.40
TABLEVI.EFAS OF THE ORGANIZATION EFAS
Name Rating Weight Weighted Score Improve-ment Indicator
Buying power 5 0.70 3.5 0.70
Competitive market 2 0.30 0.60 1.2
TABLEVII.IMPORTANCE OF STRATEGIES Strategy
𝑖 Importance (8)
Targeted middle people 9.2%
Design patent 6.9%
Associations with suppliers 17.2%
Low-cost components 13.8%
Fixed structure 9.2%
Buying power 16.1%
Competitive market 27.6%
Figure 12. Normalization and prioritization in the first phase The following stages of this method are submitted to the same execution as the previous ones, until the team defines that the level of detail has been reached or until the last phase (phase 5 - Key process operations vs. Production requirements).
Figure 13. Input matrix Customer attributes vs. Engineering characteristics
Figure 14. Normalization and prioritization in the second phase V. CONCLUSION
Our goal is to create a methodology that stands out for its simplicity and assertiveness while using this matrix method, in which we introduce negative values for the correlation, one more phase, automatic importance of goals and weighted final importance that supplements the definition of priority.
We plan to keep implementing the core of the Traditional QFD instead of the Modern QFD, mitigating its problems and adapting it to the main focus: the client’s satisfaction.
Lately, Modern QFD has been increasingly exploited and used [8]–[10], presenting itself more focused on speed, efficiency, rare use of matrices and the application of several additional tools. Modern QFD uses AHP for the prioritization of actions, providing an easy and accurate analysis, but it also has some shortcomings regarding cost and time [11]. However, the reduction of costs, improvement of product marketing, increased profits and reduced time to market are the main goals of the organizations. Therefore, the methodologies using the matrix method should be adopted when quick results are needed. The proposed model improves on Wasserman’s and Chen&Chen’s normalization, adding strategic planning, business variables and quantitative correlation, yielding results that are more precise than that of its reference models (Fig. 15).
Figure 15. Improvements of proposed model
REFERENCES
[1] J. R. Hauser and D. Clausing, “The house of quality,” Harv. Bus. Rev., pp. 63–73, 1988.
[2] C. P. M. Govers, “What and how about quality function deployment (QFD),” Int. J. Prod. Econ., vol. 46–47, no. 95, pp. 575–585, 1996.
[3] BSI Standards, “BSI Standards Publication Application of statistical and related methods to new technology and product development process Part 1 : General principles and perspectives of Quality Function Deployment ( QFD ),” 2015.
[4] E. Burke, J. M. Kloeber, and R. F. Deckro, “Using and abusing QFD scores,” Qual. Eng., vol. 15, no. 1, pp. 9–21, 2002.
[5] G. S. Wasserman, “On how to prioritize design requirements during the QFD planning process,” pp. 37–41, 1993.
[6] L. Chen and C. Chen, “Normalisation models for prioritising design requirements for quality function deployment processes,” Int. J. Prod. Res., vol. 52, no. 2, pp. 299–313, 2014.
[7] F. Franceschini and A. Rupil, “Rating scales and prioritization in QFD,” Int. J. Qual. Reliab. Manag., vol. 16, no. 1, pp. 85–97, 1999.
[8] G. H. Mazur, “QFD for membership organizations — practicing what we teach,” 2013.
[9] K. Mazur and Q. F. D. B. Belt, “Elementary QFD : Using QFD to assess and evaluate the learning environment of a private school library and to systematically engage an ISACS review,” 2012. [10] G. Özdağoğlu and L. Salum, “Modern QFD-based requirements
analysis for enterprise modelling: Enterprise-QFD,” Int. J. Comput. Integr. Manuf., vol. 22, no. 12, pp. 1102–1127, 2009. [11] H. Wang, M. Xie, and T. N. Goh, “A comparative study of the
prioritization matrix method and the analytic hierarchy process technique in quality function deployment,” Total Qual. Manag., vol. 9, no. January, pp. 421–430, 1998.
André S. Domingoswas born in Lisbon, Portugal, in 1992. He received the BSc degree for Computer Engineering from ISCTE – University Institute of Lisbon, Lisbon, Portugal, in 2014. From November 2016 to present he has worked as a business intelligence junior consultant in BI4ALL. In September 2016, he successfully completed the requirements to be recognized as a Microsoft Certified Professional. His current research interests include relational databases, business intelligence and related decision support tools. Email: andre_domingos@iscte.pt
João Carlos. M. Silva received the BSc and MSc
degree for Aerospace Engineering from Instituto Superior Técnico (IST) – Lisbon Technical University, (1995-2000). From 2000-2002 he worked as a business consultant in strategic management in McKinsey&Company. From 2002 to 2006 he undertook his PhD in telecommunications at IST, integrated in 3 EU projects (Seacorn, B-Bone e C-Mobile), having been the representative of the university. Since 2006, he has been working on computer networks, as an assistant professor in Instituto Superior das Ciências do Trabalho e da Empresa (ISCTE). Recently, he finished his MBA at ISEG (Instituto Superior de Economia e Gestão), and aims to work on technological management in the near future. Email: joao.silva@iscte.pt
José Azevedo Pereira is a full Professor of
Finance, at Universidade de Lisboa, ISEG - Instituto Superior de Economia e Gestão. He holds a PhD from the Manchester Business School and an MBA, from ISEG. Besides his academic career he has held top executive positions in several companies. During seven years he led the Portuguese Tax and Customs Authority, where he was Director-General and Chairman of the Board. Email: jpereira@iseg.utl.pt
![Figure 2. Correlation and relative importance. Based on Wasserman [5]](https://thumb-eu.123doks.com/thumbv2/123dok_br/19190431.949631/2.892.495.769.314.694/figure-correlation-relative-importance-based-wasserman.webp)
![Figure 4. Comparison of normalization algorithms [6]](https://thumb-eu.123doks.com/thumbv2/123dok_br/19190431.949631/3.892.147.754.120.599/figure-comparison-normalization-algorithms.webp)