2017
UNIVERSIDADE DE LISBOA
FACULDADE DE CIÊNCIAS
DEPARTAMENTO DE BIOLOGIA VEGETAL
Depicting epigenetic mechanisms involved in the regulation of
pseudogene expression
Ana Margarida Esteves Ferreira
Mestrado em Biologia Molecular e Genética
Dissertação
Dissertação orientada por:
Professora Doutora Ana Rita Grosso
Professora Doutora Mónica Vieira da Cunha
iii
Acknowledgements
Começo com um agradecimento à Doutora Ana Rita Grosso pela confiança que em mim depositou para trabalhar neste projecto. Agradeço-lhe profundamente por ter sido uma constante fonte de ânimo, apoio e disponibilidade em todas as etapas deste trabalho.
Devoto também a minha apreciação à Doutora Mónica Cunha por ter aceitado o convite para co-orientar este projecto e por ter mostrado sempre interesse em ajudar-me na execução desta tarefa.
Agradeço ao Doutor Sérgio de Almeida por me ter recebido no seu laboratório no Instituto de Medicina Molecular e pelos seus contributos científicos neste projecto. Menciono também os meus colegas Alexandra, Ana, Cláudio, João, Mafalda, Ram, Robert e Sílvia por terem facilitado a minha integração no laboratório e por todo o apoio que me deram.
Ao agrupamento 1242 de Ramada que pertence ao movimento CNE que pertence à Associação Mundial de Escutismo. É profundo o orgulho que tenho em pertencer a este movimento e da forma como me ensinou, conforme as palavras do seu fundador, a tentar deixar este mundo um pouco melhor do que o encontrei. Um obrigado especial à Nídia, à Marta, à Catarina, à Inês, ao Pedro, ao Barrué e ao Ricardo, amigos com quem tive a oportunidade de me entregar, construir e trilhar o caminho em direcção ao Homem Novo, tendo como farol os ensinamentos de Karol Wojtyla e o exemplo de conversão de São Paulo.
Agradeço à minha amiga de longa data, Sofia, que sempre assinala com compromisso todos os momentos importantes da minha vida. Ao menino e meninas que alegram a minha existência taciturna com a amizade que surge da sua simples presença. São eles a Tatázinha, a Fontainhas, a Salsa e o Dani. Um agradecimento muito especial e intensamente sentido à Inês por ser a coisa mais parecida que tenho com uma irmã mais velha e, na verdade, por tudo.
Para a maior bênção que possuo: família. Não tenho em mim capacidade para colocar em palavras esta graça que é, não só ter uma família grande, mas também ter uma grande família, tanto a que vem do sangue como a que vem de vincados laços de amizade. Se da minha vida algo valedor construir, a vós o devo. É obrigatório destacar os meus avós pelo constante contributo na minha educação, a minha tia por estar sempre presente e os meus primos-irmãos pela parvoíce saudável.
E por fim, vêm os primeiros. Mãe, Pai, lembram-se quando eu era pequena e vos disse que fiquei muito triste quando descobri que afinal não eram super-heróis? Que tola! Se olhava para vocês com admiração antes, relembro-vos agora que, apesar de serem humanos de carne e osso, creio vivamente que a vossa arma para salvar o mundo é a mais forte de todas. Obrigado por partilharem esse pequeno grande mistério comigo todos os dias. Obrigado por me ensinarem a transportar esse tesouro num vaso de barro.
“Por isso, já não sou eu que vivo; é Cristo que vive em mim. E a minha vida presente vivo-a por meio da fé no Filho de Deus que me amou e deu a sua vida por mim.”
v
Resumo Alargado
A epigenética dedica-se ao estudo de modificações que ocorrem, principalmente, sobre a dupla cadeia de DNA, sem que exista a edição da sequência nela contida (Waddington 1942b, 1942a). Graças às descobertas feitas nesta área nos últimos anos, existem vários tipos de modificações epigenéticas já descritas, entre as quais se destaca as modificações de histonas e a metilação do DNA (Li et al. 2007). Assim, avaliando a presença ou ausência destas modificações, poderemos inferir relativamente à activação ou silenciamento de uma determinada região do genoma. Vários estudos têm sido realizados para caracterizar a forma como estas modificações afectam a transcrição de genes codificadores de proteína (Kouzarides 2007), no entanto, pouco se sabe como estas modificações podem condicionar outras classes de genes, nomeadamente, os pseudogenes. Neste sentido, o objectivo deste trabalho consiste na determinação de modificações epigenéticas que possam estar envolvidas na expressão dos pseudogenes, potencialmente exercendo um papel crucial na sua regulação.
Os pseudogenes são cópias ancestrais de sequências codificantes que, possivelmente devido à perda de pressão selectiva, degeneraram em novas unidades genéticas (Jacq et al. 1977). Actualmente, os pseudogenes são classificados em três grandes grupos que são definidos com base no seu processo de formação: processados, a classe de pseudogenes mais representada e cuja formação envolve um processo de transcrição reversa e integração de um RNA mensageiro novamente no DNA, num processo conhecido por retrotransposição; não processados, no caso do processo de formação do pseudogene acontecer através da duplicação de um gene completo; e unitários, quando a própria estrutura física do gene sofre modificações que levam à perda da capacidade de codificar uma proteína (Pink et al. 2011). O processo de formação dos pseudogenes que resulta na incapacidade do novo pseudogene codificar uma proteína denomina-se “pseudogenização” (Gregório 2016).
Graças ao recente desenvolvimento de plataformas de sequenciação em larga escala, revelou-se que os pseudogenes são transcritos e que a sua transcrição pode estar envolvida na condução de importantes processos celulares nos quais os pseudogenes podem desempenhar funções celulares específicas. Presentemente, sabe-se que os pseudogenes conseguem também actuar através de diferentes mecanismos para modular a regulação dos seus genes parentais, nomeadamente através da competição para esponjas de microRNAs (Thomson and Dinger 2016), transcritos antisense ou lncRNAs com a capacidade de conduzir complexos proteicos remodeladores de cromatina (Groen et al. 2014). Para além desta actuação mediada por RNA através dos potenciais transcritos dos pseudogenes, pensa-se também que os pseudogenes podem ter mecanismos de acção ao nível do DNA que podem condicionar a actividade do gene parental, por exemplo através de um evento de recombinação homóloga entre o pseudogene e o gene parental que pode resultar na deleção do gene parental (Poliseno 2012). Dada esta possível contribuição em vários processos celulares, os pseudogenes definem um novo paradigma de como o genoma não codificante pode ter importantes contribuições em diversas funções biológicas, nomeadamente no desenvolvimento e no cancro. Um exemplo destas contribuições é o pseudogene Oct4p4, que tem a capacidade de regular a transcrição do seu gene parental, o regulador de pluripotência Oct4. Quando expresso, este pseudogene conduz a célula a iniciar o processo de diferenciação neural, através da imposição da modificação repressiva da histona H3 (H3K9me3) na região promotora do gene Oct4 (Liedtke et al. 2007). Um outro exemplo de um pseudogene com uma função importante, neste caso em cancro, é o PTENP1, um pseudogene do gene supressor tumoral PTEN. O PTENP1 é o exemplo de um pseudogene com diversificados mecanismos de acção através de um único pseudogene conseguindo actuar como uma esponja de microRNAs, um catalisador do recrutamento de remodeladores da cromatina para o promotor do gene PTEN e um transcrito antisense que consegue regular a estabilidade e a função de esponja de microRNAs do próprio transcrito sense do PTENP1 (Johnsson et al. 2013).
vi
Contudo, os mecanismos pelos quais a expressão dos pseudogenes é regulada e qual o seu papel biológico estão ainda por explorar. Grande porção dos pseudogenes não aparentam ter sequências regulatórias a montante do corpo do pseudogene, o que pode sugerir que outros mecanismos poderão estar envolvidos neste processo, em resultado da observação de modificações nas histonas de pseudogenes que são transcritos e que não são características nos seus genes parentais ou nos restantes genes codificadores de proteínas (Pei et al. 2012). Um destes exemplos é a presença de H3K9me3 na região do promotor de pseudogenes expressos (Guo et al. 2014).
Tendo em consideração estas observações, propomos a hipótese que os pseudogenes possuem mecanismos epigenéticos próprios a regular a sua transcrição. Para testar esta hipótese, estudámos o transcriptoma e epigenoma dos pseudogenes durante a diferenciação neural de células estaminais embrionárias, através da combinação de análises de dados em larga de escala do transcriptoma (RNA-seq e GRO-(RNA-seq), metilação de DNA (BS-(RNA-seq), regiões de cromatina aberta (hipersensibilidade à DNase) e modificações de histona (ChIP-seq). Os dados usados foram obtidos através da plataforma NIH Roadmap Epigenomics Consortium (Bernstein et al. 2010), consistindo em 72 amostras e um total de 194 replicados. Devido à elevada expressão de pseudogenes no cérebro (Pei et al. 2012), este projecto incidiu essencialmente na diferenciação neural, durante a qual células estaminais embrionárias (H1) foram diferenciadas in vitro em células progenitoras neuronais (H1N).
As nossas análises referentes ao transcriptoma revelaram um número mais elevado de pseudogenes a serem expressos durante a diferenciação neural quando comparado com a diferenciação mesenquimal. No entanto, observámos que a detecção da transcrição dos pseudogenes pode ser incorrectamente determinada usando dados de RNA-seq, pois os perfis obtidos por esta tecnologia são influenciados pela estabilidade dos transcritos. Em concordância, os resultados obtidos usando dados de GRO-seq suportam esta hipótese, dado que permitem identificar um maior número de pseudogenes a serem transcritos. Após a identificação dos pseudogenes transcritos e silenciados, analisámos o seu enriquecimento em modificações de histonas. De todas as alterações observadas, destacamos três importantes observações associadas com a transcrição de pseudogenes, nomeadamente a presença de: H3K36me3 no corpo do pseudogenes transcritos, associada a episódios de continuação da transcrição do gene na região a montante (“read-through”); H3K9me3, uma marca epigenética usualmente associada a regiões não transcritas; e, por fim, domínios bivalentes (H3K4me3 e H3K27me3) na região promotora de alguns pseudogenes. Estas observações parecem sustentar a hipótese que sugere que a transcrição dos pseudogenes é regulada. Estudos mais profundos são necessários para perceber a extensão destas modificações na expressão dos pseudogenes, apesar da presença de H3K36me3 e H3K9me3 terem sido já observadas previamente em pseudogenes transcritos (Pei et al. 2012; Guo et al. 2014).
No entanto, são ainda muitas as limitações associadas ao estudo dos pseudogenes e que precisam de um melhoramento no futuro. Primeiramente, a semelhança existente entre pseudogenes e os genes parentais dificulta o mapeamento destas regiões usando dados de sequenciação de transcriptoma. Adicionalmente, a expressão de pseudogenes por “read-through” do gene a montante pode sugerir a existência de erros na anotação de bases de dados e pressiona para a crescente necessidade de melhoramento na caracterização de genomas.
Concluindo, os resultados aqui observados e discutidos confirmam que os pseudogenes são transcritos e que a sua transcrição parece ser regulada, sugerindo que o seu papel não será assim tão “pseudo” como previamente se pensava. Contudo, mais esforços são necessários para caracterizar a extensão destas alterações, bem como para aferir a contribuição da metilação do DNA na regulação da expressão dos pseudogenes.
vii
Abstract
Pseudogenes are genetic elements that derive from normal protein-coding genes which, through the accumulation of deteriorating mutations, have lost coding potential in a process which is known as “pseudogenization”. However, recent high throughput sequencing technology has shown that pseudogenes are transcribed and that their transcription is tissue-specific, which suggests that pseudogenes might have an important role in biological processes. Many pseudogenes have been described to regulate important processes in development or cancer. Yet, not much is known about how pseudogene expression is regulated. Most pseudogenes seem to have lost their upstream regulatory sequences, indicating that trans-acting mechanisms might be responsible for this regulation. Studies evidence that pseudogenes have different histone modifications compared to their parental genes, suggesting that they might have specific transcriptional mechanisms.
In this project, we aimed at identifying the epigenetic pattern responsible for the regulation of pseudogene transcription through a genome-wide analysis. For this analysis, we used transcriptomic data (RNA-seq and GRO-seq) to detect pseudogene transcription and epigenomic data (ChIP-seq, DNase Hypersensitivity and WGBS-seq) to assess epigenomic changes in silent and expressed pseudogenes. Since pseudogene expression has been shown to be higher in the brain, we choose to address our research questions using in vitro neural differentiation of embryonic stem cells (ESCs) as a cell differentiation model system.
Our analysis confirmed that there are more pseudogenes being expressed during neural differentiation when compared to mesenchymal differentiation. Regarding their epigenetic modifications, our results show that some pseudogenes, in which the histone modification H3K36me3 is present, might be transcribed as a consequence of transcription read-through from the upstream gene. Expressed pseudogenes also seem to be enriched with the histone modification H3K9me3, a modification that is known to be associated with inactive transcription. As well as in protein-coding genes and lncRNAs, pseudogenes are enriched with bivalent promoters features, such as the co-localized presence of H3K4me3 and H3K27me3 in both undifferentiated and neural differentiated cell lines.
To conclude, although the regulation of pseudogene transcription still requires further work to truly apprehend the epigenetic mechanisms that contribute to pseudogene expression, our work has confirmed that mainly histone modification such as H3K36me3 and H3K9me3 may indeed play a role, either direct or indirect, that can help modulate the expression of these very particular genes.
ix Table of Contents Acknowledgements ... iii Resumo Alargado... v Abstract ... vii Table of Contents ... ix
List of Figures and Tables ... xi
List of Abbreviations ... xiii
1. Introduction ... 1
1.1. The role of the epigenome in the regulation of gene expression ... 1
1.1.1. Histone Modifications ... 1
1.1.2. DNA methylation ... 2
1.2. Pseudogenes – a mysterious genetic element... 3
1.2.1. Pseudogenes Typology ... 3
1.2.2. Pseudogene Transcription ... 4
1.2.3. Pseudogene Transcriptional Regulation ... 5
1.3. High-throughput Sequencing Technology (HTS) ... 6
1.3.1. The NIH Roadmap Epigenomics Mapping Consortium ... 8
1.4. Background of the project and Aims ... 9
2. Methods... 10
2.1. Database and Samples ... 10
2.2. Quality Assessment ... 10
2.3. Genome Mappability ... 11
2.4 Expression Data: RNA-seq and GRO-seq ... 11
2.5 Epigenomic Data: ChIP-seq, WGBS-seq, DNase Hypersensitivity ... 11
3. Results ... 14
3.1 Public high-throughput sequencing data and quality issues ... 14
3.2 Defining Transcribed Pseudogenes ... 15
3.3 Canonical Histone Modifications in Pseudogenes ... 17
3.4. Chromatin States and Dynamics of Pseudogenes ... 20
4. Discussion and Conclusions... 24
5. References ... 27
xi
List of Figures and Tables Figures
Figure 1.1 - Examples of different molecular mechanisms of epigenetic control……….... 1 Figure 1.2 - Effects of different histone modifications on the determination of functional activity
in the genome………... 2
Figure 1.3 - Pseudogene formation……….. 4
Figure 1.4 - Example of the effect of the PTENP1 pseudogene transcription in the regulation of
PTEN expression………... 5
Figure 1.5 - Illumina’s next generation sequencing steps. ……….. 7
Figure 1.6 - NIH Roadmap Epigenomics Mapping Consortium Data………. 8
Figure 2.1 - Analysis pipeline according to each type of dataset for NIH Roadmap Epigenomics
Data……… 12
Figure 3.1 - Data Quality Analysis for NIH Roadmap Project data………. 14 Figure 3.2 – Quantification of gene expression in neural (H1-H1N) and mesenchymal
differentiation (H1-H1M)……….………. 15
Figure 3.3 – Gene transcription defined using GRO-seq and RNA-seq……….. 16
Figure 3.4 – Canonical histone modifications distribution in the gene body of expressed (full
line) and silent (dashed line) protein-coding genes, pseudogenes and lncRNA………... 18
Figure 3.5 - H3K36me3 is present in expressed pseudogenes………. 19
Figure 3.6 - 18-state ChromHMM model for expressed genes and silent genes divided according
to gene type (protein-coding genes in red, pseudogenes in blue and lncRNAs in green)…………. 21
Figure 3.7 - 51-state ChromHMM model displaying overall state enrichment for expressed
genes and silent genes divided according to gene type (protein-coding genes in red, pseudogenes in blue and lncRNAs in green) and expression level in H1 cell line………. 22
Figure 3.8 - 51-state ChromHMM model displaying overall state enrichment for expressed
genes and silent genes divided according to gene type (protein-coding genes in red, pseudogenes in blue and lncRNAs in green) and expression level in H1N cell line……….. 23
Tables
Table 2.1 - Criteria for Quality Analysis applied to all replicates……… 10 Table 2.2 - Filtering criteria to define genes used in epigenomic analysis………... 13 Table 3.1 - Number of genes divided according to gene type and expression after filtering……... 17 Table 6.1 - All replicates initially processed for this analysis identified by the respective GEO
xiii
List of Abbreviations
bp base pair (s)
ChIP-seq Chromatin Immunoprecipitation sequencing DNA Desoxirribonucleic Acid
ESC Embryonic stem cells FDR False discovery rate
GRCh38 Genome Reference Consortium human genome (build 38) GRO-seq Globan Run-On sequencing
H1 H1 human embryonic stem cells H1M H1 derived mesenchymal stem cell
H1N H1 derived neuronal progenitor cultured cells HTS High-throughput Sequencing
lincRNA Long intergenic non coding RNAs lncRNA Long non coding RNAs
mRNA messenger RNA
NGS Next Generation Sequencing NIH National Institute of Health PCR Polimerase Chain Reaction RNA Ribonucleic Acid
RISC RNA-induced silencing complex RPKMs Reads per kilobase per million RNA-seq RNA sequencing
TPMs transcripts per million TSS transcription start site TTS transcription termination site
UCSC University of California Santa Cruz UTR untranslated terminal region
1
1. Introduction
1.1. The role of the epigenome in the regulation of gene expression
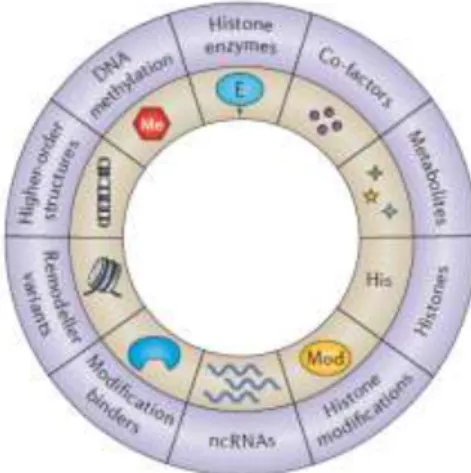
The term “epigenetics” arises for the first time in 1942 attributing now a word to the concept of phenotypic change without genotypic change (Waddington 1942b, 1942a). Nowadays, it is known that the DNA template works in collaboration with epigenetic programs to regulate gene expression through several mechanisms (Figure 1.1). The advances in epigenetics have gone from the identification of different levels of chromatin condensation (transcriptionally active regions as “euchromatin” and silent regions as “heterochromatin”), to more detailed insights such as the effects of histone modification and DNA methylation in transcriptional programs (Li et al. 2007). These last two epigenetic features will be discussed in this project.
1.1.1. Histone Modifications
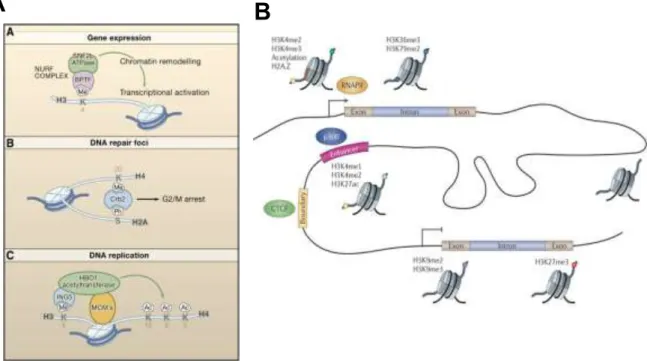
The DNA inside the nucleus is compacted as a chromatin fibber which is organized in nucleosomes, the building-block structure of the genome. The nucleosome structure is composed of an octamer of four histones, namely H3, H4, H2A, and H2B, which are encircled by 147 base pairs of DNA (Kornberg and Lorch 1999). It is known that histones have large N-terminal tails that can suffer several modifications, such as methylation, acetylation or phosphorylation, which can affect several DNA-related processes, including transcription (Karlić et al. 2010), splicing (Kornblihtt et al. 2009) or DNA repair (Fillingham et al. 2006) (Figure 1.2, A).
The development of high-throughput sequencing (HTS) technologies has allowed the mapping of all these modifications across the genome. This transformation allowed the association of specific modifications to regulatory processes (Kouzarides 2007), namely transcription (Li et al. 2007; Soboleva et al. 2014). There have been many histone modifications that were described to regulate transcription. Transcription regulation can be performed at several levels, namely through specific modifications in enhancer, promoter and gene body regions (Figure 1.2, B). For instance, trimethylation of lysine 4 in histone H3 (H3K4me3) in promoter region and trimethylation of lysine 36 also in histone H3 (H3K36me3) throughout the gene body correlates positively with active transcription. On the contrary, presence of trimethylation of lysine 9 in histone H3 (H3K9me3) and trimethylation of lysine 27 in histone H3 (H3K27me3) are usually associated with transcriptional
Figure 1.1 – Examples of different molecular mechanisms of epigenetic control (adapted from Allis and Jenuwein
2
repression. Interestingly, H3K4me3 and H3K27me3 histone modifications are also concomitant with bivalent chromatin associated structures that are characteristic of early development stages in cell differentiation. In these bivalent domains, transcription activation and repression histone modifications are co-existent in a regulated equilibrium (Voigt et al. 2013). Throughout differentiation, there is a tendency for these regions to undergo silencing, which results in the decrease of these bimodal domains. It has been observed that, in ES cells, these bivalent regions are associated to pluripotency factors, such as OCT4, delivering their contribution at maintaining basal activation levels for these factors (Voigt et al. 2013).
1.1.2. DNA methylation
DNA methylation is an epigenetic modification that occurs in the DNA itself, through which, in eukaryotes, a methyl group is added to the fifth position of the cytosine nitrogenous base ring in the cytosine-guanine dinucleotides (CpG) (Holliday and Pugh 1975). This modification is highly conserved in both animal and plants (Law and Jacobsen 2010) and is thought to be present in 60-80% of the estimated 28 million CpG dinucleotides found in somatic cells (Smith and Meissner 2013). CpGs occur in CG-dense regions called CpG islands, predominant in transcription initiation sites. DNA methylation of gene promoter regions is associated with a decrease in gene expression and can lead to gene silencing (Suzuki and Bird 2008). These findings have established the role of DNA methylation in the definition of repressed chromatin states and silent gene activity. In mammals, the addition of this methyl group is completed by the family of methyltransferases DNA methyltransferase 3 (DNMT3), for de novo methylation, and DNA methyltransferase 1 (DNMT1),
Figure 1.2 - Effects of different histone modifications on the determination of functional activity in the genome. (A)
(A.A) NURF complex being transported to H3K4me locations to induce changes in transcription. (A.B) DNA repair response prompted recruitment of Crb2 complex to DNA repair foci. (A.C) Transport of HBO1 acetyltransferase to H3K4me3 in DNA replication sites (adapted from Kouzarides 2007). (B) Functional consequences of histone modifications in transcriptional dynamics. According to their expression level, genes and promoter regions are enriched with different histone modifications that help shape the robustness of transcriptional programs. Besides genes, other genomic transcriptional regulatory elements, such as enhancers, also seem to be characterized by the presence of specific histone modifications (adapted from Zhou et al. 2011).
3
responsible for the maintenance of the methylation pattern during replication (Cheng and Blumenthal 2008). The tight regulation of CpG methylation heritability (Smith and Meissner 2013) suggests that this modification must be of great importance in the maintenance of the stability of several DNA metabolic processes.
1.2.
Pseudogene – a mysterious genetic element
The definition of pseudogene appeared for the first time in 1977, when Jacq et al. described the 5S DNA, coding for oocyte type 5S RNA, of Xenopus laevis. This 5S DNA is composed of several repeats of a 700 base pairs sequence which included a long spacer, the gene, a linker and a 101 base pairs sequence almost identical to a portion of the 121 base pairs gene to which no function was associated. The finding of this sequence led to the definition of a new genetic element which, up to this day, can still be partially described by the same words as in 1977:“Further studies showed that this homologous structure was nearly as long as, and almost an exact repeat of, the gene itself; hence the name – pseudogene” (Jacq et al. 1977). From 1977 to present date, the definition of pseudogene has grown more intricate. While before it was thought that pseudogenes had no coding potential, mainly due to the accumulation of deteriorating mutations, recent evidence has shown that pseudogenes are transcribed (Harrison et al. 2005; Groen et al. 2014; Kandouz et al. 2004) and can impact the expression levels of their parental genes (Liedtke et al. 2007; Poliseno et al. 2010).
1.2.1. Pseudogene Typology
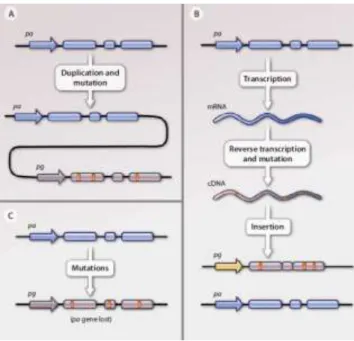
Pseudogenes are very similar to regular protein-coding genes however, through time, they accumulated mutations that were capable to damage their coding potential. According to the mechanism through which they were generated, pseudogenes can be divided in 3 different classes: unprocessed, processed and unitary pseudogenes (Figure 1.3) (Pink et al. 2011).
Unprocessed pseudogenes (Figure 1.3 A) are generated by a process of duplication of an original protein-coding gene and subsequent accumulation of mutations which could have led to the loss of the coding potential and also the transcription initiation signals. (Milligan et al. 2016)
Processed pseudogenes (Figure 1.3 B) are derived through retrotransposition, a process where the transcriptional product from an original protein-coding gene is converted back to DNA and integrated in the genome. Since the mature (spliced) mRNA is the template for the reverse transcription, these pseudogenes are usually intronless (Sakai et al. 2007). Processed pseudogenes are the most represented class in mammalian genomes, possibly due to several bursts of retrotransposition (Ohshima et al. 2003).
Unitary pseudogenes (Figure 1.3 C) are the only type of pseudogenes that do not have parental genes since they are generated through the accumulation of mutations in the ancestral protein-coding gene body (Zhang et al. 2010). These mutations can lead to loss of promoter signals or coding potential (through introduction of premature stop codons, frameshift mutations or splice site alterations), process known as “pseudogenization” (Gregório 2016).
Due to the emergence of genome-wide data and computational approaches, 18000-20000 pseudogenes were thought to exist in the human genome (Torrents et al. 2003; Svensson et al. 2006). However, a more recent and exhaustive studies reduced this number to 14000 pseudogenes in the human genome (Pei et al. 2012).
Although pseudogenes are very abundant in the mammalian genome, their parental genes represent only 16% of all protein-coding genes (Pei et al. 2012; Poliseno 2012). It is also known that some
4
parental genes originated a greater number of pseudogenes, namely ribosomal proteins (Tonner et al. 2012), olfactory receptors and metabolic enzymes, such as GAPDH (Liu et al. 2009; Zhang et al. 2003).
1.2.2. Pseudogene Roles
The product of pseudogene transcription is thought to have a biological function in the regulation of their parental genes. Pseudogenes can affect the regulation of their parental genes mostly at RNA level although it has been described that pseudogenes can alter the structure of their parental genes at DNA level. For instance, BRCA1 has an unprocessed pseudogene, ΨBRCA1, which is thought to be a potential recombination hotspot due to the extensive similarity between them. In families with breast and ovary cancer, this gene has been shown to be nonfunctional due to the loss of its promoter and initiation codon, providing a mechanism whereby this oncosuppressor gene can become inactivated in cancer (Puget et al. 2002). Another example is the pseudogene CYP2A7, which originates from the parental gene CYP2A6 coding for an hepatic enzyme. CYP2A6 gains a polymorphic site that stabilizes its mRNA leading to an augment in its abundance and stability. The enzyme resulting from this polymorphism metabolizes nicotine much faster and this genotype is often associated with an increased risk of developing lung cancer (Wang et al. 2006).
The major mechanisms through which pseudogenes can change the expression of their parental genes is through competition for microRNA sponges (Thomson and Dinger 2016), antisense transcripts or as lncRNA guides of chromatin remodeling complex proteins (Groen et al. 2014). PTEN is an example of a gene whose pseudogene shows a combination of several regulatory functions through the production of different RNA products from the same pseudogene, PTENP1. This pseudogene can, through several mechanisms, act as: 1) a lncRNA, when it is expressed in its sense
Figure 1.3 – Pseudogene formation. (A) Duplicated pseudogenes are copies of their parental protein-coding genes that
through time acquired mutations that conditioned their function. (B) Retrotransposed pseudogenes are a consequence of the combination of the reverse transcription of a processed mRNA followed by the insertion of this structure in a random region of the genome. (C) In the bottom case, pseudogenes are formed by the degradation of the original gene structure through the accumulation of several mutations (adapted from Poliseno 2012).
5
form acting as a microRNA sponge; 2) an antisense RNA, responsible for the recruitment of chromatin remodelers to the promoter of the PTEN gene; 3) an antisense RNA which binds to PTENP1 sense transcript altering its stability and ability to act as a microRNA sponge (Johnsson et al. 2013). Another evidence of the great importance of this pseudogene’s activity is the fact that cells induce cell-cycle arrest when the antisense RNA mechanism is disrupted (Johnsson et al. 2013).
Pseudogene expression can also have an influence on differentiation processes. One of these pseudogenes is Oct4 pseudogene. Oct4 is responsible for the maintenance of the undifferentiated state in embryonic stem cells. Conversely, when Oct4 pseudogene is expressed, it is responsible for repressive chromatin rearrangements to the promoter regions of the Oct4 gene leading to its decreased expression. Consequently, it allows the cell to enter the neural differentiation process (Liedtke et al. 2007).
1.2.3. Pseudogene Transcriptional Regulation
Prior to the development of computational tools, the identification of pseudogene transcripts was conducted using PCR techniques which failed to be successful due to the similarity between pseudogenes and parental genes (Poliseno et al. 2010). Recent computational approaches have shown that pseudogenes are expressed (Pei et al. 2012) and that their expression can be tissue specific, not only in normal cells (Pei et al. 2012) but also in cancer (Han et al. 2014; Kalyana-Sundaram et al. 2012). Besides being tissue specific, pseudogene expression is particularly elevated in certain cell types, namely, testis, adrenal, oocytes and brain (Pei et al. 2012).
Figure 1.4 – Example of the effect of the PTENP1 pseudogene transcription in the regulation of PTEN expression. PTENP1 has two antisense RNAs, α and β. The α isoform is responsible for the epigenetic modulation of PTEN transcription.
The β isoform pairs with PTENpg1 sense changing its stability and the interaction with microRNA sponges (adapted from Johnsson et al. 2013).
6
The specific patterns of pseudogene expression suggest a coordinated transcription (Han et al. 2014). However, not much is known regarding the mechanisms through which pseudogene expression is regulated. Since processed pseudogenes arise from the retrotransposition of processed mRNAs, lacking most promoter regulatory regions, their transcription regulation may differ from their cognate genes (Kandouz et al. 2004). Moreover, the upstream region of pseudogenes lack the regular transcription factor binding sites (Pei et al. 2012). On the contrary, unprocessed pseudogenes originate through genomic duplication, mechanism that preserves the genomic and regulatory features of their ancestors (Pink et al. 2011).
All these facts suggest that different mechanisms might be responsible for pseudogene transcription. One hypothesis relies on the fact that some pseudogenes are located within other loci and can be expressed by “hitchhiking” on the transcriptional machinery of the genes present there (Vinckenbosch et al. 2006). This mechanism suggests that mostly processed pseudogenes, which do not have upstream regulatory sequences, might become functional by being integrated in regions that favor transcription. This behavior is characteristic of retrogenes which integrate nearby genes, perhaps in the pursuit of the opportunity of being transcribed. An alternative theory proposes that pseudogenes transcription can be modulated at chromatin level. Globally, pseudogenes show the canonical histone modifications from transcribed (H3K4me3 and H3K36me3) and repressed (H3K27me3) protein-coding genes (Pei et al. 2012). However, recent studies described distinct features associated with pseudogenes transcription. First, the histone modification H3K36me3, prevalent in the gene-body of protein-coding genes, appear to be enriched near the transcription start-site of pseudogenes and long non coding RNAs (lncRNAs) (Pei et al. 2012; Sati et al. 2012). Also, expressed pseudogenes show an enrichment of H3K9me3, an histone modification usually associated with repressed regions (Guo et al. 2014). Moving apart from histone modifications, it is also known that DNA methylation can regulate gene activity (Schultz et al. 2015). Indeed, pseudogene expression is tissue-specific repressed by de novo methylation after the gene duplication event (Cortese et al. 2008). Also, the high expression of pseudogenes in testis appear to be a consequence of the transient demethylation during spermatogenesis (Grunau et al. 2000). Nevertheless, more studies are need to fully characterize the impact of DNA methylation in the regulation pseudogene expression.
1.3. High-throughput Sequencing Technology (HTS)
It was approximately 20 years between the discovery of DNA’s double helix structure by Watson and Crick in 1953 (Watson and Crick 1953) and the first sequencing reactions in the 1970s developed by Sanger et al (Sanger et al. 1977). Due to its impact, Sanger’s sequencing method was widely used to determine the DNA sequence of a given location in the genome for another 30 years. Until, in the 2000’s, motivated by the need to increase throughput power, we were greeted with more automate and parallel processing technologies that became able to sequence the whole genome (Hattori 2005), culminating in the establishment of next generation sequencing (NGS) technologies. Presently, we find several technologies that present a diversified array of biological applications considering the goals to which these technologies are used.
Examples of NGS technologies are Roche 454, Illumina/Solexa, ABI-SOLiD and Ion Torrent. NGS sequencing protocols can be divided into three major steps as described in Figure 1.5, which are: library preparation, amplification and sequencing (Goodwin et al. 2016). The development of sequencing machines and protocols led to a significant reduction of the sequencing cost when compared to the cost of sequencing a human genome in 2004, meeting the goal to make this technology affordable and accessible (Van Dijk et al. 2014). Illumina is one of the most used sequencing platforms mainly due to their competitive cost, accuracy, and performance. Rapid
7
advances in the development of sequencing technologies in recent years have enabled an increasing number of applications in biology, namely in the fields of transcriptomics, epigenomics or metabolomics. In this project we used five types of sequencing data which are RNA-seq, GRO-seq, ChIP-seq, WGBS-seq and DNase hypersensitivity. Since the main goal of this project is to investigate how transcription can be affected by epigenetic features in pseudogenes, this data can be further divided into transcriptomic, which includes RNA-seq and GRO-seq, and epigenomic data, including ChIP-seq, WGBS-seq and DNase Hypersensitivity. RNA-seq evaluates the overall amount of polyadenilated RNAs inside the nucleus, therefore determining the relative amount of a given mRNA in the nucleus (Garber et al. 2011). GRO-seq determines active transcription through identifying genes with an engaged RNA polymerase (Core et al. 2008). ChIP-seq assesses the binding sites of proteins that bind to DNA (Mardis 2007). WGBS-seq uses bisulfite conversion to identify methylated cytosines in the genome (Ziller et al. 2015). DNase Hypersensitivy is a method that uses DNase I enzyme to identify regions that are sensitive to cleavage by this enzyme, thus assessing if the DNA found in this region can be accessible (Piper et al. 2013).
Figure 1.5 – Illumina’s next generation sequencing steps (adapted from
8
1.3.1. The NIH Roadmap Epigenomics Mapping Consortium
The NIH Roadmap Epigenomics Mapping Consortium was developed with the main goal of producing a public database that contained mostly epigenomic sequencing data from normal tissues and cell lines (Bernstein et al. 2010). Presently, it has sequencing information regarding DNA methylation, histone modifications, chromatin accessibility and transcriptome from human cells and tissues, with a total of 127 both human tissues and cell lines. Besides sequencing data, the Consortium also aims to standardise the protocols used for both sequencing and analysis steps in order to allow the scientific community to increase data uniformity, through the usage of the same guidelines. One of the major goals of the consortium is the public dissemination of raw sequence data, processed data and integrated data maps (Romanoski et al. 2015). The NIH Roadmap Epigenomics Consortium is part of a bigger consortium, the International Human Epigenome Consortium (http://ihec-epigenomes.org/), which gathers sequencing information for several others consortiums, like ENCODE (https://www.encodeproject.org/) and Blueprint (http://www.blueprint-epigenome.eu/). Similarly to NIH Roadmap, the International Human Epigenome Consortium has, as main objectives, the generation of reference maps of human epigenomes in health and disease.
A
B
Figure 1.6 – NIH Roadmap Epigenomics Mapping Consortium Data (A) Covered epigenomic information contained in
each of the data sets (B) All cell lines and tissues found in this database (adapted from
9
1.4.
Background of the thesis and Aims
The development of high-throughput sequencing technologies, their applications and the gerneration of public databases allowed the disclosure of tissue-specific expression of pseudogenes, suggesting a regulated transcription. However, the mechanisms driving pseudogene transcription are incompletely understood.
Thus, the main goal of this thesis was to identify the epigenomic features that coordinate pseudogene transcription. To achieve this goal, a comprehensive analysis was applied assessing chromatin accessibility (DNase Hypersensitivity), DNA methylation (BS-seq), histone modifications (ChIP-seq) and transcriptome (RNA-seq and GRO-seq) of pseudogenes. The genome-wide data was retrieved from the NIH Roadmap Epigenomics Consortium covering 72 samples and 194 replicates. Due to the high expression and role of pseudogenes in brain, we surveyed pseudogene features throughout in vitro neural differentiation of human embryonic stem cells (H1) into neuronal progenitor cultured cells (H1N). We also included also H1 derived mesenchymal embryonic cells to understand if the epigenetic patterns in neural differentiation are unique. Hence, through the assessment of an epigenome-wide map, we aim to disclose the epigenomic “active” and “repressive” states ruling pseudogene transcription during neural differentiation.
10
2. Methods
2.1. Database and Samples
Samples. High-throughput sequencing (HTS) profiles for 194 replicates (corresponding to 72
samples) were produced by the NIH Roadmap Epigenomics Mapping Consortium (Consortium et al. 2015) and the raw data was collected from the GEO database (https://www.ncbi.nlm.nih.gov/geo/roadmap/epigenomics/) (Supplementary Table 1.1). In addition, GRO-seq data for H1 cell line (GEO accession no: GSM1006728) was also included to assess nascent RNA.
Cell Lines. The 3 cell lines chosen for this analysis were human embryonic stem cell lines H1,
(H1), H1 derived mesenchymal stem cells (H1M) and H1 derived neuronal progenitor cultured cells (H1N).
Genome Annotation. Gene coordinates were obtained from GENCODE Annotation v23 for
GRCh38. This version was chosen over GRCh37 because it contained a higher number of pseudogenes.
2.2. Quality Assessment
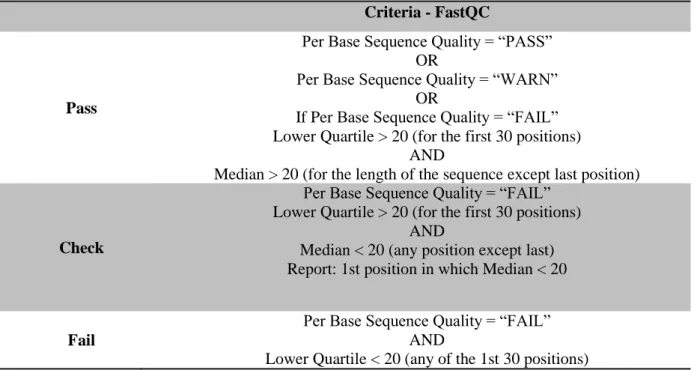
All runs were converted from SRA files to FASTQ files and a data quality analysis was performed using FastQC software (Andrews 2015). Due to the large number of samples, a workflow was used to parse the FASTQC output files and filter out the bad quality samples. FastQC outputs several quality measurements being the most important: per base sequence quality; per sequence quality scores; per base sequence content; per sequence GC content and overrepresented sequences. Per base sequence quality defines the range of quality values at each nucleotide position and is usually the measure where most HTS samples show problems. To overcome this issue and recover data, samples were split according to quality criteria and reads from problematic samples were trimmed (Table 2.1).
Criteria - FastQC
Pass
Per Base Sequence Quality = “PASS” OR
Per Base Sequence Quality = “WARN” OR
If Per Base Sequence Quality = “FAIL” Lower Quartile > 20 (for the first 30 positions)
AND
Median > 20 (for the length of the sequence except last position)
Check
Per Base Sequence Quality = “FAIL” Lower Quartile > 20 (for the first 30 positions)
AND
Median < 20 (any position except last) Report: 1st position in which Median < 20
Fail
Per Base Sequence Quality = “FAIL” AND
Lower Quartile < 20 (any of the 1st 30 positions)
Table 2.1 – Criteria for Quality Analysis applied to all replicates. All sequencing files labelled as “pass” were automatically
included in the analysis. All sequencing files labelled as “check” were trimmed in length according to the first position in which the median value is below 20. “Fail” sequencing files were automatically excluded from the analysis.
11
2.3. Genome Mappability
The genome mappability (also known as uniqueness) improves with increased read length and generally shows an inverse correlation with the presence of genomic repeats. Genome mappability is an important feature to determine mapping depth which allows the identification of noncomplex or repetitive regions. It is assessed by fragmentation of the genome in K-mers (Kbps sliding windows of 1 bp step size) and determination of their frequency in the genome (after alignment). Due to lack of mappability tracks for the latest human genome version (GRCh38), we generated mappability tracks using the software GEM (Derrien et al. 2012). GEM software outputs a mappability score for each position of the genome (ranging from 0 to 1) which is calculated based on the fragmentation of genome in K-mers followed by alignment of the generated k-mers. Since the genome mappability varies with the read length, we determined the mappability for K-mers of 36bps and 101 bps (read lengths of the ChIP-seq and RNA-seq data, respectively).
Gene mappability was defined as the sum of the mappability value of each base pair, divided by the total length of the gene. For the epigenomic analysis, only genes with a mappablity higher than 80% were considered.
2.4 Expression Data: RNA-seq and GRO-seq
Transcriptomic data was aligned using Kallisto (Bray et al, 2016) and transcripts per million (TPMs) were calculated. For RNA-seq, TPMs for each gene were defined as the mean of TPMs across replicates for each cell line. All genes with TPMs > 1 were defined as expressed. In order to compare RNA-seq and GRO-seq samples (Figure 3.2, B-D), RPKMs (normalized reads per kilobase per million mapped reads) were obtained using normalized library size, as implemented in edgeR R package (Robinson et al, 2010). Bayesian analysis was applied to determine differentially expressed genes using limma R package (Ritchie et al, 2015) and the following thresholds: B-value > 0 and fold-change > 2.
2.5 Epigenomic Data: ChIP-seq, WGBS-seq, DNase Hypersensitivity
ChIP-seq Data Analysis. To reduce redundancy, improve data quality and achieve uniformity
required for our integrative analysis, we decided to trim all ChIP-seq sequences to 36 bp and merge all replicates from the same sample in order to increase the number of reads per sample thus augmenting the coverage of the analysis. Because discrepancies in the number of reads across samples can compromise the quality of the analysis, we decided to subsample all replicates that had more than 20M reads to 20M reads (Consortium et al. 2015). Bowtie software (Langmead et al. 2009) was used to align ChIP-seq replicates to the new reference genome GhRC38, reporting only uniquely mapped reads. PCR duplicates were removed using Picard software (http://picard.sourceforge.net). Histone modification enriched regions (peaks) were identified using MACS2 software with the options – broadpeaks –broadcutoff 0.1. Peaks with minimum FDR value (qvalue) < 0.5 were defined as highly significant peaks and used for the identification of enriched sequences. For quantitative calculation and profiles for all genes, uniquely mapped reads were extended in the 3’ direction to reach 150 nt with the Pyicos (Althammer et al. 2011). Only read counts that overlapped enriched regions identified above were considered.
WGBS-seq Data Analysis. BS-seq reads were mapped to the reference human genome (GRCh38)
using Bismark (Krueger and Andrews 2011), that aligns bisulfite converted sequence reads and determines cytosine methylation states.
12
DNase Hypersensivity Analysis. DNase Hypersensitive reads were aligned similar to the
ChIP-seq data. DNase Hypersensitive regions are identified using a peak calling software Homer (Heinz et al. 2010). These regions were subjected to further analysis using the software pyDNase (Piper et al. 2013) for a more accurate identification of DNase Hypersensitive regions
Figure 2.1 – Analysis pipeline according to each type of dataset from NIH Roadmap Epigenomics Data.
ChromHMM. ChromHMM (Ernst and Kellis 2012) was used to assess chromatin states based on
histone modifications (ChIP-seq) and chromatin accessibility (DNase-seq) data. Two chromatin states models were inferred as previously described, comprising: 18 states (5 core chromatin marks H3K4me1, H3K4me3, H3K36me3, H3K9me3,H3K27me3 and DNase Hypersensitive regions) and 51 states (18 chromatin marks and DNase Hypersensitive regions). These models were used afterwards to map the epigenomes and for chromatin state enrichment analyses. These downstream analyses were performed using ChromHMM tools to detect chromatin state enrichment in gene regions (Overlap enrichment function) and to infer chromatin state enrichment around anchor positions (TSS) (neighbourhood function).
Other tools. The SAMtools utility for storing large nucleotide sequence alignments and
manipulating alignments (Li et al. 2009) and BEDtools software for the comparison of genomic
Post-Processing Alignment (Uniquely Mapped Reads) Data Trimming and Subsampling Quality and Data Filtering Data Acquisition Raw Data (180 samples) FastQC (Per base sequence
quality)
Trim Galore Bismark
1) Trim to 36 bp 2) Merge replicates 3) Subsample to 20M
reads
Bowtie Peak Calling
(MACS2)
No Kalisto Gene Expression
No Bowtie 1) Peak Calling (Homer) 2) Footprints (pyDNase) BS -seq C hIP -seq RNA -seq GR O -seq
DN
ase
1
2
2
3
4
4
5
13
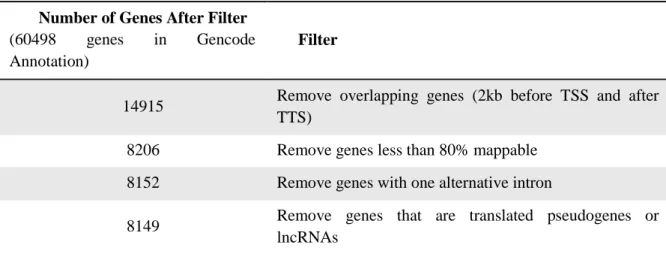
features (Quinlan and Hall 2010) were used for filtering steps and file format conversion. Finally, processed data was plotted and visualized using software of the R project for statistical computing (Team 2011). For the metagene profile, genes were aligned at the first and last nucleotides of the annotated transcripts and read counts were scaled as follows: the 5’ end (2 kb upstream of the transcription start site) and the 3’ end (2 kb downstream of the transcription termination site) were unscaled and averaged in a 50-bp window, and the remainder of the gene was scaled to 200 windows using cubic spline interpolation (so that all genes seem to have the same length). Individual profiles were produced using a 50-bp window. All profiles were plotted on a normalized reads per kilobase per million mapped reads (RPKMs). For the epigenomic analysis, we defined a subset of genes considered for the analysis based on the criteria present on Table 2.2.
Number of Genes After Filter
(60498 genes in Gencode Annotation)
Filter
14915 Remove overlapping genes (2kb before TSS and after TTS)
8206 Remove genes less than 80% mappable 8152 Remove genes with one alternative intron
8149 Remove genes that are translated pseudogenes or lncRNAs
14
3. Results
3.1 Public high-throughput sequencing data and quality issues
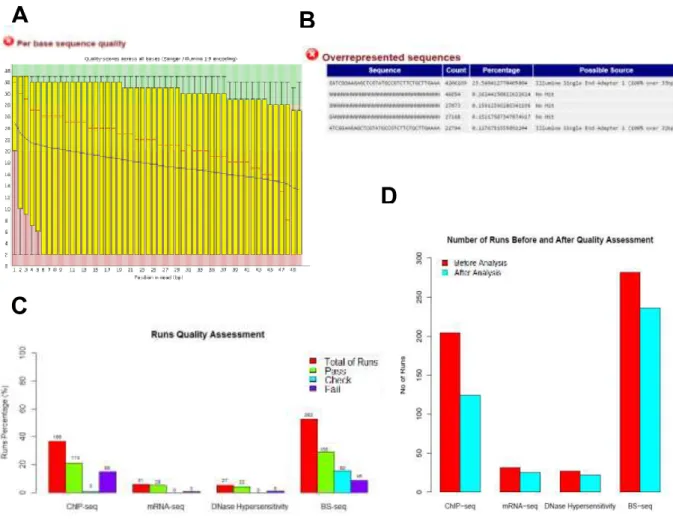
After downloading the raw data from the NIH Epigenetics Roadmap, we assessed the read quality using FastQC software (Andrews, 2010). Due to the high number of sequencing files (runs) that presented poor quality, mainly due to low per base sequence quality and adapter contamination (Figure 3.1 - panels A and B), we were forced to define a set of criteria in order to rigorously identify which samples could be considered for further analysis, as explained in methods. Files with quality problems were either subjected to post-processing (namely trimming and removing adapter sequences) or discarded from the analysis, in the latest case when the quality check was very poor. As seen in Figure 3.1C, around 40% of all ChIP-seq data was discarded due to poor quality as well as around 30% of BS-seq data. In contrast, around 80% and 90% of DNase Hypersensitivity and RNA-seq data were classified as high quality data sets. Thus, overall around 150 RNA-sequencing replicates from NIH Epigenetics Roadmap displayed very low levels of quality and could not be included in the downstream analyses. Due to quality problems and complex post-processing steps in WGBS-seq that require more complex analysis, we decided not to integrate this data in the analysis.
A
C
D
B
Figure 3.1 Data Quality Analysis for NIH Roadmap Project data (A) Per base sequence quality from FastQC report. In
this box whisker it is shown the quality score associated with each base pair from the reads in a representative replicate. The score associated with each base pair is drastically decreasing throughout the length of the read indicating a bad replicate. (B) Overrepresented sequences in FastQC report. Example of replicate with high amount of overrepresented sequences (C) Quality Number of sequencing files (runs) within each dataset (D) Number of sequencing files before and after Quality Assessment for each dataset.
15
3.2 Pseudogene transcription
To assess pseudogenes expression levels, we used transcriptome data (RNA-seq) from H1, H1N and H1M cell lines. First, we assessed the expression alterations during neural and mesenchymal differentiation to verify if the brain-specific expression of pseudogenes could be established during early development stages (Pei et al. 2012; Guo et al. 2014). Overall, pseudogenes and lincRNAs expression decreases throughout neural and mesenchymal differentiation (Figure 3.2A), which might be explained by the absence of repressive histone modifications in early embryonic stages (Zhu et al. 2013). However, we observed a higher number of pseudogenes being upregulated in neural differentiation relatively to mesenchymal differentiation (Figure 3.2A). The same was also observed for lincRNAs which suggests that not only pseudogenes but other non-coding RNAs might be upregulated in neuronal differentiation. Second, we evaluated the expression levels to define sets of transcribed pseudogenes on each cell type. However, only around 500 pseudogenes could be identified as expressed (TPMs > 1) in H1 (Figure 3.2B). Although, the neural progenitor cell line (H1N) containing the highest number of expressed pseudogenes, only 587 could be detected. Since RNA-seq technology determines steady-state RNA levels (dependent of transcription activity and RNA stability) we decided to assess pseudogenes expression by directly measuring nascent RNA production (GRO-seq).
A
B
Num b e r o f Ge n e s 11776 (90.1%) 11990 (89.2%) 11222 (93.5%) 796 (6.1%) 872 (6.4%) 430 (3.6%) 500 (3.8%) 587 (4.4%) 344 (2.9%)Protein-coding Pseudogenes LncRNAs
P e rce n ta g e o f e xp re ssio n va ria b le g e n e s( % )
Figure 3.2. Quantification of gene expression in neural (H1-H1N) and mesenchymal differentiation (H1-H1M). (A)
Differentially expressed genes according to gene type in neural and mesenchymal differentiation. (B) Expressed genes divided according to gene type in each cell line.
*** ***
*** p-value < 0.0005 Fisher’s Test
16
Thus, we assessed the number of expressed genes detected by RNA-seq and GRO-seq in H1 cell line. The overall number of expressed genes was higher in GRO-seq, as observed in panel A from Figure 3.3. However, the proportion of pseudogenes (14.7%) and lincRNAs (14.45%) increased relative to all expressed genes (Fisher’s Exact Test p-value < 0.001). Second, we compared the RNA-seq and GRO-RNA-seq expression levels (normalized RPKMs) for each gene set (Figure 3.3B). Higher association was obtained for protein-coding genes, whereas pseudogenes showed the lowest correlation value. Moreover, a large fraction of pseudogenes and lincRNAs appear to be actively transcribed but with low final transcript levels, which might suggest a fast degradation of these RNA species. Overall these results are in agreement of previous studies showing general lower RNA stability for pseudogenes and lincRNAs (Thomson and Dinger 2016).
Since we aim to assess the regulatory features of actively transcribed pseudogenes, the expressed genes for downstream analyses were determined using GRO-seq data. However, due to the unavailability of GRO-seq data for H1N and H1M cell lines, expressed genes were determined using RNA-seq data.
Figure 3.3. Gene transcription defined using GRO-seq and RNA-seq (A) Number of expressed genes divided by
gene type defined by GRO-seq or RNA-seq. Fisher’s test was performed comparing protein-coding genes with both pseudogenes and lincRNAs in GRO-seq and RNA-seq. (B) (C) (D) Comparison between RPKMs for all protein-coding, lincRNAs and pseudogenes respectively. Protein-coding genes are represented in red, pseudogenes in blue and lncRNA in green. The dashed line represents y = x correlation. Estimated correlation coefficients were obtained using Pearson’s correlation.
R = 0.7843718 P-value < 0.001 R = 0.6374715 P-value < 0.001 R = 0.7626316 P-value < 0.001
A
B
D
C
11776 (90%) 796 (6%) 500 (3.8%) 14856 (70.8%) 3088 (14.7%) 3032 (14.45%)RNA Expression Levels (Log2 RPKMs)
RNA-seq RN A E xp re ssi o n L e v e ls ( L o g2 RP K M s) GRO -s e q RN A E xp re ssi o n L e v e ls ( L o g2 RP K M s) GRO -s e q RN A E xp re ssi o n L e v e ls ( L o g2 RP K M s) GRO -s e q
RNA Expression Levels (Log2 RPKMs)
RNA-seq
RNA Expression Levels (Log
2 RPKMs) RNA-seq Num b e r o f G e n e s *** *** p-value < 0.0005 Fisher’s Test
17
3.3 Canonical Histone Modifications in Pseudogenes
To understand if transcribed pseudogenes bear the canonical histone modifications associated with transcription (Black et al. 2012), we examined H3K4me3, H3K9me3, H3K27me3 and H3K36me3. However, to guarantee that the effect of these histone modifications is specific to the subset of genes we defined, we decided to filter genes that overlapped with other genes to a minimum of 2 kb before or after the TSS or TTS, respectively. Then, due to the problem of pseudogenes being highly similar to their parental genes, we only selected genes at least 80% mappable. In the final filtering stages, we removed all genes that had an alternative 5’SS splice site and possible translated pseudogenes, as described by Ji et al. (Zhe Ji et al. 2015). These filtering steps are mentioned in Table 2.2 in methods. These genes were then divided according to gene type and expression as seen in Table 3.1.
Protein-Coding
Genes Pseudogenes LincRNAs
Initial Genome Count 19815 14505 7674
After filtering 2650 3083 2416
Divided by expression group
Expressed 1452 201 596
Silent 1198 2882 1820
First, we studied the histone modification H3K4me3, typical of the promoter region in actively transcribed genes. As described before (Pei et al. 2012), pseudogenes presented a subtle peak of H3K4me3 around the TSS, smaller that the promoter mark in lincRNAs and protein-coding genes. Then, we explored the H3K9me3 and H3K27me3 histone modifications, that are defined as repressive marks and correlate inversely with transcription (Pérez-Lluch et al. 2015). Indeed, we observed a notorious enrichment in both H3K27me3 and H3K9me3 for silent protein-coding genes. However, for pseudogenes and lincRNAs, the enrichment of presence of repressive signals was not so obvious. Indeed, expressed pseudogenes appear to have an H3K9me3 enrichment right after the TSS region, as previously described (Guo et al. 2014). The same results were obtained for H1N and H1M (data not shown).
18
Second, we explored the H3K36me3 histone modification that is found to be enriched in the body of intron-containing protein-coding genes, correlating with expression levels (de Almeida et al. 2011). Thus, we segregated our genes sets based on the presence and absence of introns. As expected, intron-containing protein-coding genes showed an enrichment of H3K36me3 towards the end of the gene body, as opposed to intronless protein-coding genes (Figure 3.5A). Surprisingly, H3K36me3 levels were higher in intronless pseudogenes. To deeply explore the distribution of H3K36me3 in pseudogenes, we evaluated individual profiles for all the expressed pseudogenes. Notably, some pseudogenes revealed transcription activity upstream and downstream of the annotated region (Figure 3.5B). Indeed, the patterns of nascent transcription suggested that the transcription initiated in the upstream gene GALTN1 and proceeded throughout the pseudogene. Moreover, the absence of regulatory features (DNase hypersensitive sites and H3K4me3) in the pseudogene promoter supports this hypothesis. Overall, all these results suggest that some pseudogenes are transcribed by “hitchhiking” the transcriptional machinery of the upstream genes. This hypothesis can explain the low levels of the promoter histone mark H3K4me3 observed in pseudogenes.
Pseudogenes
H3 K 4 me3Protein-Coding
LincRNAs
H3 K 9me3 H3 K 27 me3Figure 3.4. Canonical histone modifications distribution in the gene body of expressed (full line) and silent (dashed line) protein-coding genes, pseudogenes and lincRNA in H1.
19
Figure 3.5. H3K36me3 is present in expressed pseudogenes (A) Distribution in the gene body of expressed (full line) and
silent (dashed line) protein-coding genes, pseudogenes and lncRNAs (B) Individual profile of H3K36me3, H3K4me3 and expression of an expressed pseudogene (right) and genome browser screenshot of the same pseudogene (left).
H3K36me3 H3K4me3 GRO-seq Mappability
P
se
ud
og
enes
Intronless
Pr
ot
e
in
-Co
d
in
g
Lin
cRNA
s
Intron-containing
A
B
DNase RP K Ms20
3.4. Chromatin States and Dynamics of Pseudogenes
In order to assess the epigenetic features associated with pseudogenes transcription, we used a more complex approach that identifies chromatin states based on a multivariate hidden Markov models (implemented in ChromHMM). The simplest model contained 18-states (defined by five core chromatin marks H3K4me1, H3K4me3, H3K36me3, H3K9me3, H3K27me3 and DNase Hypersensitive regions), revealed an enrichment of the bivalent marks H3K4me3 and H3K27me3 in TSS of expressed pseudogenes (state 10 in H1 and state 4 in H1N) (Figure 3.6). Bivalent chromatin domains were previously associated to developmental genes in embryonic stem cells and to genes expressed at low levels (Bernstein, et al 2006, Cell). Notably, the region close to the TSS also possessed DNase hypersensitive sites (state 15) in H1, not observed for the 200-400nt downstream region of the TSS (state 10). More striking, the chromatin states approach confirmed the enrichment of H3K36me3 and H3K9me3 close to the TSS of expressed pseudogenes for both H1 and H1N (state 4 in H1 and state 14 in H1N). This association was not found for lincRNAs or protein-coding genes. Relative to the silent pseudogenes, an overall enrichment of H3K9me3 was observed for the entire loci and flanking regions. Overall, expressed pseudogenes present a more diversified chromatin arrangement in the transcription initiation regulatory region, when compared to silent pseudogenes, in which the most significant trait is the isolated presence of H3K9me3, as observed in Figure 3.6. Additionally, when compared to protein-coding and lncRNA genes, states attributed to active genes in the three defined classes resemble each other more than when compared to silent genes, in which the enrichment of H3K9me3 appears to be exclusive of pseudogenes.
Finally, we extended the model to all histone modifications available and build a 51-state model (defined by 18 chromatin marks and DNase Hypersensitive regions) (Figures 3.7 and 3.8). Similarly, to the results for the 18-states, expressed pseudogenes were mostly associated with the presence of bivalent marks H3K4me3 and H3K27me3 (states 22 in H1 and 11 in H1N). In addition, we could observe an enrichment of a chromatin state containing subtle levels of H3K4me1 and several histone acetylations (state 15 in H1). Silent pseudogenes were mostly associated to H3K9me3 in both H1 and H1N, coherent to the results from 18-state model.
21 TSS TSS TSS TSS
H1
H1N
Exp
re
ssed
Sil
e
n
t
Exp
re
ssed
Sil
e
n
t
Figure 3.6. 18-state ChromHMM model for expressed genes and silent genes divided according to gene type (protein-coding genes in red, pseudogenes in blue and lncRNAs in green). The first 2 heatmaps are a reference
built by the program which associates each histone modification and each genomic regions to a specific state (row), respectively. The following heatmaps depict the overall state enrichment for each of the three gene groups. Heatmap 7-12 represent the overall state enrichment centered on the TSS of all three gene groups.
22
Expressed Silent
Figure 3.7. 51-state ChromHMM model displaying overall state enrichment for expressed genes and silent genes divided according to gene type (protein-coding genes in red, pseudogenes in blue and lncRNAs in green) and expression level in H1 cell line. The first 2 heatmaps are a reference built by the program which associates each
histone modification and each genomic regions to a specific state (row), respectively. The following heatmaps depict the overall state enrichment for each of the three gene groups divided according to expression level.
23 Expressed Pr o te in -c o d ing Ge n o m e % Ps eu d o g en es Ge n o m e % Ge n o m e % Ln cR N As Pr o te in -c o d ing Ge n o m e % Ps eu d o g en es Ge n o m e % Ge n o m e % Ln cR N As Silent
Figure 3.8. 51-state ChromHMM model displaying overall state enrichment for expressed genes and silent genes divided according to gene type (protein-coding genes in red, pseudogenes in blue and lncRNAs in green) and expression level in H1N cell line. The first 2 heatmaps are a reference built by the program which associates
each histone modification and each genomic regions to a specific state (row), respectively. The following heatmaps depict the overall state enrichment for each of the three gene groups divided according to expression level.