alguns padrões espaciais de fogo
em regiões de tipo
mediterrânico
Ana Margarida Grácio de Barros
Tese apresentada para obtenção do grau de Doutor em Engenharia
Florestal e dos Recursos Naturais
Orientador | Doutor José Miguel Cardoso Pereira
Co-orientador | Doutor Max Alan Moritz
Presidente | Reitor da Universidade de Lisboa
Vogais | Doutor José Miguel Cardoso Pereira
Professor catedrático
Instituto Superior de Agronomia da Universidade de Lisboa
Doutor Carlos do Carmo de Portugal e Castro da Camara
Professor associado
Faculdade de Ciências da Universidade de Lisboa
Doutor Paulo Alexandre Martins Fernandes
Professor associado
Escola de Ciências Agrárias e Veterinárias da Universidade de Trás-os-Montes e Alto Douro
Doutor Mário Jorge Modesto Gonzalez Pereira
Professor auxiliar
Escola de Ciências e Tecnologia da Universidade de Trás-os-Montes e Alto Douro
Doutor Francisco Manuel Ribeiro Ferraria Moreira
Investigador auxiliar
Instituto Superior de Agronomia da Universidade de Lisboa
Resumo
O fogo ´e um processo ecol´ogico intr´ınseco `a dinˆamica de muitos ecossistemas. No
entanto, nas ´ultimas d´ecadas, a ocorrˆencia de incˆendios de grandes dimens˜oes, tem
chamado a atenc¸˜ao de gestores, cientistas e sociedade, para a ameac¸a de incˆendios
ca-tastr´oficos. Compreender o que determina a propagac¸˜ao do fogo, constitui a melhor
forma de identificar ´areas de maior risco, estabelecer prioridades de protecc¸˜ao e gerir
a paisagem de forma a aumentar a sua resiliˆencia. O principal objectivo deste
traba-lho ´e explorar as relac¸˜oes entre fogo, vegetac¸˜ao, topografia e meteorologia `a escala da
paisagem. Foi avaliada a existˆencia de padr˜oes espaciais de orientac¸˜ao dos per´ımetros
de fogo em duas regi˜oes de clima de tipo mediterrˆanico, recorrendo `a an´alise de
com-ponentes principais e estat´ıstica circular, tirando partido de 31 anos de mapas de ´areas
ardidas em Portugal e 100 anos de mapas de ´areas ardidas na Calif´ornia.
Adicional-mente, utilizou-se regress˜ao por quantis para avaliar a relac¸˜ao entre a dimens˜ao dos
fogos e a selectividade fogo em relac¸˜ao aos diferentes tipos de combust´ıvel, em
Por-tugal. Os resultados obtidos reforc¸am a importˆancia das condic¸˜oes meteorol´ogicas
como principais condicionantes do fogo `a escala da paisagem, nas ´areas de estudo
consideradas.
Palavras-chave:
Portugal; Calif´ornia; Estat´ıstica Circular; Regress˜ao Quant´ılica; Componentes
Princi-pais; Determinantes do Fogo; Vegetac¸˜ao; Meteorologia; Topografia
ii
Title: Environmental determinants of some spatial fire patterns in mediterranean
type regions
Abstract
Fire provides a fundamental ecological function to many ecosystems.
Neverthe-less, in the past decades, the occurrence of very large, severe fires, has called for
at-tention from managers, scientists and society in general. Understanding fire drivers
constitutes an important step to identify regions of higher risk, establish priorities for
protection, and manage the landscape to increase its fire resilience. The main goal of
the present work is to explore relationships between fire, vegetation, topography and
meteorology at landscape scale. It applies principal component analysis and circular
statistics to determine the existence of spatial patterns in fire perimeter orientation,
in two mediterranean climate regions, relying on a 31-year fire atlas for Portugal and
100-year fire atlas for California. Additionally it applies quantile regression to
evalu-ate the relationship between fire size and fire selectivity towards different land cover
types, in Portugal. The results presented here reinforce the importance of
meteoro-logical conditions as the primary driver of fire spread, at landscape scale and in the
regions considered.
Keywords:
Portugal; California; Circular Statistics; Quantile Regression; Principal Components;
Fire Drivers; Fuel; Meteorology; Topography
This thesis is the result of the past four years of research in the Forest Research
Centre, Technical University of Lisbon and in the Moritz Lab at the University of
Ca-lifornia, Berkeley. It was nurtured in a inspiring and scientifically stimulating work
environment, only possible due to contribution of all the people with whom I had the
privilege to work with, and hereby gratefully acknowledge. They are:
My advisor Prof. Jos´e Miguel Cardoso Pereira, for the endless inspiration,
gui-dance and support at both academic and personal levels, since that extraordinary first
class in the aftermath of the 2005 fire season.
My co-advisor Prof. Max Alan Moritz, for creating the conditions that allowed me
to study and work in one of world’s leading university and research center.
My co-authors Prof. Ulric Lund and Prof. Scott Stephens, as well as Dr. Brian Cade
for their kindness and willingness to help when nothing made sense.
Several remarkable people with whom I crossed paths, and to whom I rambled
about my objectives, success and lack of it, namely: Prof. Carlos Da Camara, Dr.
Francisco Moreira, Prof. Paulo Fernandes, Prof. Ricardo Trigo, Prof. Francisco Rego,
Prof. Jorge Cadima and Sean Parks.
My lab colleagues in Berkeley, Meg Krawchuk, Marc Parisien, Erica Newman, Eric
Waller, Enric Presas and Kevin Krasnow, for the warm welcoming and friendly work
environment.
The Foundation for Science and Technology for the funding.
Members of the jury, reviewers and editors that evaluated, rejected and approved
my work.
Eng. Tiago Oliveira for pushing me to limits I did not know I had and make me
cross every single one.
Eng. Francisco Oliveira Martins for the friendship and for showing me the applied
side of fire research.
My lab colleagues in Lisbon, particularly Duarte Oom, Isabel Rosa, Joana Melo,
Jo˜ao Carreiras, Jo˜ao Silva, Renata Pinto, Catarina Pepo, Ioannis Bistinas, Sofia Oliveira
iv
and Gerardo Salda ˜na for creating a crazy in the good way, friendly workplace, that
saved my day(s) even when everything was going sideways.
Friend and colleague Ana S´a for unquantified support and friendship.
Friends, Andr´e Guedes, Sean Kerr, Genevieve Miranda, Yannick Le Page, Duarte
Neiva, Alice Neiva, Filipa Vieira and Cl´audia Leal, for being friends even when I don’t
reply calls.
My family, father M´ario, mother Ana, and brother M´ario that have given me everything
that I have and made me everything that I am. For the pride, trust and support that I
see in their eyes when they look at me.
1 Introduction
1
2 Original Contributions
6
2.1 Identifying geographical patterns of wildfire orientation: A watershed
based analysis . . . 11
2.2 Spatial characterization of wildfire orientation patterns in California . . 22
2.3 A test for directional–linear independence, with applications to wildfire
orientation and size . . . 44
2.4 Wildfire selectivity for land cover type: does size matter? . . . 60
3 Conclusions
85
I
NTRODUCTION
The natural basis for a fire regime is alternation between moist conditions that
promote biomass production, and drought conditions that allow biomass to burn. The
mediterranean climate provides a text-book example of such an environment (Keeley
et al., 2012). Typical mediterranean climate alternates wet and cool winters, with
pro-longed summer droughts, characterized by low atmospheric humidity, high
temper-ature and strong, dry winds (Chandler et al., 1983). In many mediterranean climate
regions natural ignitions, such as lightning, are common, while in others ignitions are
almost exclusively from human origin (Stephens, 2005; Syphard et al., 2007; Slocum
et al., 2007). Mediterranean type vegetation has evolved under climatic conditions
favorable to the outbreak of fires and therefore has become xerophilous, drought
re-sistant and highly flammable (Chandler et al., 1983).
Mediterranean type climates occur in all five continents, in areas extremely
distant from one another: southern Europe, northeastern Africa around the
Mediter-ranean Sea, California and northern Baja California in North America, part of Chile in
South America, the southwest tip of South Africa and, southwestern and southeastern
parts of Australia (Chandler et al., 1983). In all these regions anthropogenic pressure
has shaped the landscape and fire regimes since milenia (Pyne, 2009; Bowman et al.,
2009). In pre-Columbian California, Chile and primitive Australia fire was used by
indigenous people as a tool for managing the land, hunting and war (Pyne, 2006). In
southern Europe - from Portugal to Greece - the landscape was a complex mosaic of
agricultural crops and pastures (Pyne, 2006). Also here, fire was used as tool to control
weed species, clear agricultural lands and renew pastures (Pyne, 2006).
Today, while there are significant differences among mediterranean climate
re-gions around the world, they all share an increase over the past decades in fire
fre-quency, and a surge in large, severe, catastrophic fires (Pausas, 2004; Pereira et al.,
2006; Westerling et al., 2006; Pausas and Fern´andez-Mu ˜noz, 2012). In southern
Eu-rope, and particularly in the Portuguese context, land cover and land use changes
2
coupled with demographic shifts from rural areas to urban centers partially explains
the increase in fire hazard over the past 30-50 years (Moreira et al., 2001, 2011).
Hu-man exodus from rural areas, and consequently the abandonment of agricultural and
pastoral practices led to the conversion to shrublands or afforestation of areas that
were previously covered with annual crops, vineyards, orchards and pastural lands
(Moreira et al., 2001). Conversion from this heterogeneous mosaic of agricultural land
cover to continuous patches of tall shrublands and woodlands, led to increase of fuel
loads, flammability and consequently fire hazard. Disorganized and inefficient fire
suppression techniques concurrent with years of extreme fire weather also account for
the increase in fire frequency and annual burnt area, over the last decades in Portugal
(Moreira et al., 2011).
On the other hand, in other mediterranean regions, such as California, there are
still wild uninhabited territories much of which is public land, and the focus of a
vig-orous fire suppression policy since the beginning of the nineteenth century (Stephens
and Ruth, 2005). In the California mixed conifer forest, the highly successful exclusion
of fire from wildland areas led to fuel acumulation to levels capable of sustaining very
large, high severity fires, ignited by lightning or by human activity (Minnich et al.,
1995; McKelvey et al., 1997; Miller et al., 2009). In southern California, where
veg-etation is dominated by fire-prone chaparral, population encroachment in scattered
dwellings, delineates a continuously expanding wildland-urban interface (Radeloff
et al., 2005). While the probabilities for large fires in this area have not increased,
mostly due to fire suppression, there was an increase in fire frequency concurrent
with human population growth (Moritz, 1997; Keeley et al., 1999). This coexistence
between people and fire has contributed to increase the risk of catastrophic fires with
high socioeconomic impacts (Keeley et al., 2004; Syphard et al., 2007, 2009; Keeley
et al., 2009).
Under these circumstances, there has been a growing awareness of the
dele-terious environmental and socioeconomic impacts of wildfire (Bowman et al., 2009).
The increase in fire size and fire severity in all vegetated continents has caught
pub-lic attention and raised fundamental questions about the nature and consequences of
these events (Pausas et al., 2008). Nonetheless, growing awareness of negative fire
ef-fects on biodiversity, human health and economy, underlies the lack of understanding
of the intrinsic and unavoidable role of fire in many ecosystems (Bond and Keeley,
2005; Bowman et al., 2009). The need to reintroduce wildfire in many wilderness
land-scapes and, moreover, to accept fire as natural and unavoidable ecosystem process is
well documented (Agee, 2002; Brown et al., 2004; Bowman et al., 2009; Pyne, 2009).
However, as the interface between settlements and wildland becomes more extensive,
encouraging fire restoration becomes a more sensitive, contentious and constrained
issue (Gill and Stephens, 2009; Miller et al., 2011).
con-trols and ecosystem impacts that vary across multiple scales of time and space (Falk
et al., 2007; Peters et al., 2004, 2007). Fire is a a contagious disturbance, because its
intensity depends directly on interactions with the landscape (Mckenzie et al., 2011b).
However, while fire events occur over time spans of days to months, ecosystem
re-sponse can take decades to centuries to unfold. Ecosystem rere-sponse, both in pattern
and process, will interact with fire and create a feedback between fire and landscape
that is strong and ecosystem-specific (Mckenzie et al., 2011b). Fire effects on the
land-scape illustrate such interaction. Fire consumes biomass as it spreads, creating a patch
mosaic of burned area that will affect subsequent fires. The heterogeneity of such
mosaic reflects a landscape pattern resulting from the variability in fuel distribution
(type, load and connectivity), local topography and micro scale meteorology (Miller
and Urban, 1999; Viedma, 2008; Mckenzie et al., 2011b).
While spatial and temporal patterns of ignitions are controlled by lightning
patterns and human activities, fire growth and behavior is mostly a function of
bio-physical variables, weather, fuel and topography, often represented as the fire
envi-ronment triangle (Pyne et al., 1996). Interactions between these variables and with fire
itself determine the characteristics and behavior of a fire at any given moment. The
relative importance of each fire triangle component varies across a range of time and
space, thus determining changes in fire behavior in both space and time (Falk et al.,
2011).
At the spatial scale of a single fire event, spread rate and direction, will be
controlled by local topography, weather, spatiotemporal variation in the amount,
con-dition and distribution of fuel and the existence of barriers to fire spread (Heyerdahl
et al., 2007; Kellog et al., 2008; Gill and Taylor, 2009; Parks et al., 2011). This
site-specific influence, also known as bottom-up fire control, combines to create the fire
environment that determines fire behavior. Beyond the reach of a single spreading
fire, regional climate and land use are primary top-down fire drivers, that promote
synchrony or interrupt fire occurrence at regional or broader scales (Heyerdahl et al.,
2007; Gill and Taylor, 2009; Parks et al., 2011).
Interaction between top-down and bottom-up fire controls frames the central
challenge in understanding fire regimes, which summarize the aggregate properties
of multiple fire characteristics to a specific ecosystem (Miller et al., 2011). The strength
of this interaction may vary as a function of the scale of study (Peters et al., 2004; Falk
et al., 2007; Parisien and Moritz, 2009; Parisien et al., 2010; Slocum et al., 2010; Falk
et al., 2011), and non linear fire-environment relationships further limit the ability to
isolate the relative influence of a specific control (Kasischke et al., 2002; Schoenberg
et al., 2003; Peters et al., 2004; Parisien and Moritz, 2009).
Climate and vegetation are the main contributors to fire proneness of
mediter-ranean regions, though it is not clear the relative importance of their roles or
mecha-nisms of their interaction across different spatial and temporal scales (Chandler et al.,
4
1983; Keeley et al., 2012). Identifying fundamental fire drivers and understanding
their interactions is of key importance to characterize fire regimes in mediterranean, as
well as other regions, and entails significant implications for land management
prac-tices and fire prevention and suppression policies (Keeley et al., 2004; Moreira et al.,
2009; Keeley et al., 2009).
Research on landscape drivers of fire regimes in California has fueled the
de-bate over the role of weather vs fuels (Keeley, 2006), but those arguments can
eas-ily be adjusted to other mediterranean regions (Fernandes et al., 2012; Pausas and
Fern´andez-Mu ˜noz, 2012). If for a specific region, the dominant fire regime is
charac-terized by fuel driven fire events, fire hazard will be a function of fuel age. In such
case, it is reasonable to assume that fuel management practices removing or
reduc-ing hazardous vegetation types, may effectively provide some protection regardreduc-ing
high intensity fires (Minnich, 1983, 1995, 2001). On the other hand, if the regional
fire regime is dominated by occurrence of extreme fire weather, it will increase the
likelihood of large and severe fires, regardless of fuel type or age (Keeley et al., 1999;
Keeley and Fotheringham, 2001; Moritz, 2003; Keeley and Zedler, 2009). In such case,
it is likely that broad-scale fuel treatments are ineffective and fire management policies
should focus resources in fire prevention, attempt to minimize ignitions and prioritize
fuel treatments in the wildland-urban interface (Moritz et al., 2004, 2010). Despite
the importance of understanding the importance of key fire drivers in fire regimes,
the quantification of their unique contribution can be challenging due to multi-scale
temporal and spatial relationships between drivers and their cross-scale interactions
(Parisien and Moritz, 2009; Slocum et al., 2010; Parks et al., 2011; Parisien et al., 2011).
Pausas and Fern´andez-Mu ˜noz (2012) analyzed 130 years of fire history in the
mediter-ranean basin and concluded that in the region fire regime had a major shift circa 1970
from which fires increased in both annual fire frequency and area burned. The authors
argued that the main driver of this shift was the increase in fuel load and continuity
due to rural abandonment. Their results also suggested that prior to 1970 fires where
mostly fuel-limited and poorly related with climatic conditions. After 1970, fires
be-came less fuel-limited and more drought-driven, thus suggesting a shift in the main
driver for fire activity (Pausas and Fern´andez-Mu ˜noz, 2012).
One of fire ecology’s fundamental research needs is to improve our
under-standing on the nature of fire controls (Cushman et al., 2006; Mckenzie et al., 2011a).
If we can infer controls on fire regimes, we’ll be able to better predict how fire-prone
landscapes may change, as the controls change. This is an essential step to support
successful landscape management interventions. There is no such thing as a forest
immune to fire (Agee, 2002). Furthermore, it is now clearer than ever the paradox
in-herent to fire suppression, that the more intensely forests are protected from fire, the
worse the problem may become (Butry et al., 2001; Stephens, 2005; Pyne, 2009).
There-fore, no management or preservation plan will be successful unless it recognizes and
incorporates fire as elementary ecosystem process. It is necessary to find solutions
that work across boundaries and that anticipate the scientific and social challenges
that the combination of global climate change, increase human population and land
use changes, impose on fire ecology and fire management (Milar et al., 2007; Moritz
and Stephens, 2008; Miller et al., 2011).
C
HAPTER
2
O
RIGINAL CONTRIBUTIONS
The present thesis focuses on fire-environment relationships at the landscape scale
in two mediterranean type regions - Portugal and California. Its main goal is to
im-prove understanding of the relative role of fire controls, framed by the challenge of
incorporating such knowledge into landscape management. It unfolds around two
underlying research questions:
— What can we learn from past fire spatial patterns?
— How can we incorporate such information in support of landscape management
strategies for fire prevention and fire effects mitigation?
Herein, four studies are presented, three of which focused on Portugal, taking
advantage of a 31-year fire atlas, and a fourth one, relying on a 100-year fire atlas of
California. Having the landscape as spatial scale for all analyses, the common
ob-jective among these studies is to draw significant relationships between fire spatial
patterns and fire controls, specifically, weather, topography and land cover.
In the first study (Chapter II, section 2.1) we assess the existence of fire
perime-ter orientation patperime-terns at landscape scale, in Portugal, between 1975 and 2005. The
objective is to identify, at watershed level, the existence of preferential fire
orienta-tion, as opposed to a uniform distribution of fire perimeter orientations. This is done
by applying principal component analysis to compute the orientation of each fire in
the 31-year Portuguese fire atlas (Davis, 1986; Luo, 2005). Due to the circular nature
of the data, hypothesis tests based on circular statistics were applied to determine
whether fire perimeter orientation in each watershed had a significant mean
orienta-tion, against the alternative that any orientation is equally probable (Fisher, 1993).
The analysis was conducted at the watershed scale to provide topographic
support for the interpretation of the results, and potential incorporation into
land-scape fuel management programs. It is hypothesized that the existence of preferential
fire perimeter orientation, at landscape scale, may be due to synoptical weather
pat-terns, coupled with macro scale topographic features. Hence, this analysis is aimed at
searching for evidence of the effect of wind and topography as top-down fire controls.
Secondary objectives were to determine if preferred fire orientation varied as
function of fire season severity and to search for evidence of topographic alignment
between fire orientation and major valley in each watershed. In watersheds where
fire perimeters have historically been aligned according to an specific axis, it is likely
that such spatial pattern of orientation may reflect the influence of wind as primary
top-down control on fire spread. On the other hand, whenever patterns of orientation
are random, it is possible that local scale fire drivers exert stronger control.
The second study presented in this thesis (Chapter II, Section 2.2) follows closely
the methodology presented in Chapter II, Section 2.1 to investigate landscape patterns
of fire perimeter orientation in California between 1910 and 2010.
The occurrence of foehn wind, a high speed, dry and hot wind is a common
aspect in mediterranean regions throughout the world (Chandler et al., 1983). In
southern Europe they are the tramontana, and in France, mistral. In Morroco, Algeria
and Tunisia, hot and dry winds blowing from the Sahara desert are known as sirocco,
while in Greece they are known as bora (Chandler et al., 1983). In southern California
they are called SantaAna (Raphael, 2003; Westerling et al., 2004; Moritz et al., 2010).
Throughout the mediterranean-type regions, the largest and most destructive fires
oc-cur during foehn outbreaks (Chandler et al., 1983; Keeley et al., 2009; Moritz et al.,
2010). Therefore, it is expected that geographic patterns of fire orientation in distinct
mediterranean regions may exhibit evidence of top-down wind control, at landscape
scale.
Results from these analyses sustain important landscape management
impli-cations. Basic principles of fuel management treatments include reducing surface
fu-els, increasing height to live crown and decreasing crown density (Agee and Skinner,
2005). The objective of fuel treatments is to reduce torching and crown fire potential
and therefore provide a window of opportunity to facilitate fire control and
contain-ment (Agee and Skinner, 2005). During a given fire event, landscape scale effectiveness
of fuel treatments will be determined by its location, design and level of suppression
effort. Fire behavior modeling and field observations show that treatment
effective-ness is higher when fuel treatment intersect fire in the heading direction (Finney, 2001;
Finney et al., 2007). Under the assumption that fire perimeter orientation allows
infer-ence on fire spread direction, it is possible to map average historical fire travel paths, at
watershed level. Such information may be incorporated into fuel treatment design in
order to maximize its effectiveness. From a fire suppression operational stand-point,
identifying locations of potential fire-topography interaction contributes to increase
the safety of firefighting personnel (Viegas, 2006, 2004; Viegas and Simeoni, 2011).
8
In Chapter II, Section 2.3 is presented a study in which a nonparametric
inde-pendence test for directional-linear data is developed and applied to the original data
from Section 2.1. The main objective of the test application to data in Section 2.1, is
to identify watersheds where there is evidence of independence between fire
orien-tation and fire size. This was done in two distinct settings: 1) in a two-dimensional
case where independence is tested for fire size (linear) and fire orientation (circular)
as calculated in Section 2.1 and 2) in a three-dimensional approach where the circular
variable is represented by two angles - one representing fire orientation and the other
measuring the mean slope of the fire perimeter, hereafter referred to as inclination. For
each fire perimeter, the inclination is calculated through principal component analysis
applied to the X, Y coordinates and elevation value of each vertex in the fire
perime-ter. It is expected that inclination would provide an indication of the fire topographic
position, theoretically varying from 0
◦for flat terrain to a maximum of 90
◦for vertical
slope, with intermediate values representing increasingly steeper slopes. While the
core of this work is within the field of circular statistics, application of the
indepen-dence test to the Portuguese fire orientation data provides support for the orientation
analysis conducted in 2.1. A limitation of the fire perimeter orientation analysis
con-ducted for Portugal and California is that it relies on fire counts, disregarding fire size.
Testing for independence between fire size and orientation allows us to identify
lo-cations where independence can be rejected (at a desired significance level), which
suggests that using an event based approach is very likely to generate results different
from those of an area-based approach.
The fourth study of this thesis is focused on the relationship between land
cover and fire, described through the concept of fire selectivity (Chapter II, Section
2.4). The concept emerges from the metaphor introduced by Bond and Keeley (2005),
who compared fire to a herbivore, and follows closely common animal ecology
meth-ods and concepts from resource selection analysis (Manly et al., 2010). Fire is
con-sidered selective if it burns through a certain land cover typer disproportionally to
its local abundance. Positive selectivity, or preference, occurs when the proportion of
land cover consumed is higher than availability, whereas negative selectivity, or
avoid-ance, results from proportion of consumed land cover being smaller than proportion
available (Manly et al., 2010).
Fire selectivity towards land cover types, also referred to as land cover
prone-ness to burn, has been shown to occur in Portugal, Spain, Italy, Switzerland and
Canada (Cumming, 2001; Nunes et al., 2005; Moreira et al., 2009; Silva et al., 2009;
Pezzatti et al., 2009; Bajocco and Ricotta, 2008; Moreno et al., 2011). In general, most
of these studies concluded that fires are more likely to burn through shrubland areas,
while agriculture is clearly avoided. At small spatial scales fire selectivity reflects the
physics of combustion, thus fire ignition and spread will mostly depend on intrinsic
characteristics of the fuel complex such as fuel load, density and surface to volume
ratio, as well as on the interaction with the surrounding environment that determines
the dead/live fuel proportion and fuel moisture content (Albini, 1976; Pyne et al.,
1996). At larger scales, distinct degrees of land cover burning are more likely to result
from the interaction between fuel connectivity, topography, meteorological conditions
and level of fire suppression effort (Peters et al., 2004; Brotons et al., 2013). Under
simi-lar conditions, agricultural lands will be given higher priority to fire suppression than
shrublands (Nunes et al., 2005; Moreira et al., 2011). This is due to the higher economic
and social value attributed to agriculture, and also a consequence of its proximity to
populated areas, therefore posing a higher threat to human and life property (Pereira
et al., 2006; Moreira et al., 2010). It also has been shown that while fire exhibits
pref-erence towards specific land cover types, such control is more likely to be stronger
in smaller fires, thus suggesting that land cover type acts as a bottom-up fire control,
being overriden by interaction among other fire drivers, as fire size increases (Nunes
et al., 2005).
The main objective to this study was to quantify how fire selectivity to land
cover types varies as a function of fire size, in Portugal. We analyzed fire selectivity
towards five land cover types - annual crops, evergreen oak woodlands, shrublands,
pine stands and eucalypt plantations. The analysis was conducted using all fires of the
1990-1994 fire seasons and undertakes two assumptions: 1) that fire size can be taken
as a proxy variable for the meteorological conditions under which the fire occurred,
thus implying that smaller fires occurred under mild meteorological conditions, while
larger fires occur under severe meteorological conditions (Boer et al., 2008; Slocum
et al., 2010; Fernandes et al., 2012) and 2) fire selectivity towards distinct land cover
types will decrease as fire size increases, and the rate of change in selectivity will be
different among land cover types, i.e., beyond a certain fire size, fires are expected to
burn independently of land cover type (Keeley et al., 2009). To examine fire-dependent
variation in fire selectivity we used Jacobs’ resource selection ratio (Jacobs, 1974) to
de-scribe selectivity, and linear quantile regression, a procedure that allows the study of
the edges of the response variable distribution (fire selectivity) conditioned on values
of the predictor variable (fire size) (Koenker, 2005). Jacobs’ index varies between -1
for maximum land cover avoidance and 1 for maximum preference. A value of zero
means that the fire is considered indifferent to the land cover type. In this
frame-work, for a certain land cover type, lower quantiles of Jacobs’ ratio will represent
fire avoidance while upper quantiles represent preference. The sign and slope of the
estimated linear quantile functions in lower/upper quantiles, describe how
avoid-ance/preference varies as function of fire size.
To test whether fire selectivity and changes in fire selectivity - slope in
avoid-ance and preference quantiles - differ from what would be expected by chavoid-ance alone,
a distribution of fire selectivity and lower/upper quantiles slopes was created, under
the null hypothesis of randomly located fires (Bajocco and Ricotta, 2008; Moreno et al.,
10
2011). For each land cover type we compared observed values of slope and selectivity
with the null model distribution and rejected the null hypothesis when p-value of the
observed selectivity/slope is lower than 0.05 (α = 0.05). P-value corresponds to the
ranking of the real test statistic among the random fire distribution (Good, 2000).
Results from this analysis bear relevant management implications.
Identifica-tion of land cover types that are more fire prone provides a critical insight into wildfire
risk assessment Miller and Ager (2012). These land cover types are more likely to
ex-perience recurrent fires, thus increasing fire hazard and potential for severe fire effects.
These aspects also should be taken into consideration when considering afforestation
with species that are more fire prone (Silva et al., 2009). On the other hand, if
cer-tain land cover types are less fire prone, independently of fire-size, then such land
cover types can be used to minimize wildfire risk in the landscape. A fuller
under-standing of preferential burning of different land cover types and its size-dependent
relationships also contributes to debate over the relative role of fuel vs weather
Min-nich (2001); ?. Fire spread and behavior is a non-linear process that transitions from
fine-scale to broad scale dynamics (Peters et al., 2004). The strength of relationship
between fire selectivity and fire size provides critical insight into potential scale
in-teractions between fuel, weather and fire (Peters et al., 2004). Under the hypothesis
that fire size can be used as proxy for weather conditions, as fire size increases fires
are expected to burn independently of land cover type suggesting that small fires are
essentially fuel-driven while in large fires weather control overrides the effect of fuel
(Peters et al., 2004; Slocum et al., 2010).
AMG Barros, JMC Pereira, UJ Lund
Published in Forest Ecology and Management
November, 2011
Identifying geographical patterns of wildfire
orientation: A watershed-based analysis
Ana M.G. Barrosa,⇑, José M.C. Pereiraa, Ulric J. LundbaForest Research Centre, School of Agriculture, Technical University of Lisbon, Portugal bDepartment of Statistics, California Polytechnic State University, United States
a r t i c l e i n f o
Article history: Received 6 July 2011
Received in revised form 26 August 2011 Accepted 19 September 2011 Available online 5 November 2011
Keywords: Fire orientation Orographic channelling Watershed Portugal Circular statistics a b s t r a c t
We searched for geographical patterns in the orientation of wildfires, using watersheds as spatial support for the analysis. An 1975–2005 annual fire atlas of mainland Portugal was used to compute the orienta-tion of fire perimeters and watersheds, using principal component analysis. Circular statistics were employed to test for the existence of a preferred, as opposed to random, mean fire orientation in each watershed, and to search for evidence of orographic channelling of fire by comparing fire orientation and watershed orientation. We also tested for differences in fire orientation patterns under conditions of mild versus severe fire weather. Our findings show that in the 31 year period of the study, 84% of the overall area burned is accounted for by watersheds where fires display preferential orientation. Twelve of 102 watersheds display evidence of alignment between fire and watershed orientation and we found no distinction in fire orientation as response to fire weather. The spatial arrangement of water-sheds where fires present similar orientation suggests wind as a major driver of the broader patterns found in this study. Results from this analysis ought to be relevant for supporting the delineation of land-scape-scale fuelbreaks.
! 2011 Elsevier B.V. All rights reserved.
1. Introduction
During the 1980–2004 period, wildfires in Portugal burned the equivalent of 30% of the area of the country, an incidence about three times higher than that recorded for neighboring Spain and
Italy (Pereira et al., 2006). Large fires, by the standards of
temper-ate, developed countries, are a feature of the contemporary fire re-gime in Portugal. Over 40 fires larger than 1000 hectares occurred in the summer of 1991, and more recently in 2003 and 2005, sev-eral fires exceeded 10,000 hectares. A 50,000+ hectares fire in central-eastern Portugal, which occurred under the extreme heat
wave of 2003 (Trigo et al., 2006), was possibly the largest fire on
record in southern Europe during the last 40 years.
Concerns with the social, economic and environmental conse-quences of large wildfires led to the development of a National
Plan for Forest Protection Against Wildfires (AFN, 2006), which
rec-ommended a range of landscape and stand level, fuel management practices. These recommendations offer general guidelines for size, placement and maintenance of fuel treatments to be applied nationwide, but reinforce the need for site-specific analyses to be incorporated in regional implementation, sustaining the idea there
is no such thing as a ‘‘one size fits all’’ in fuel treatment design
(CNR, 2005; Reinhardt et al., 2008; Syphard et al., 2011).
Fuel treatments at landscape scale have the primary objective of reducing the risk of large, high intensity wildfires with devastating
effects, while enhancing supression efforts (Weatherspoon and
Skinner, 1996; Agee and Skinner, 2005; Reinhardt et al., 2008;
Syphard et al., 2011). Moving from stand to landscape scale bears
the underlying assumption that strategically placed treatment
areas can modify fire behavior for the entire landscape (Collins
et al., 2010).
Conceptual modeling shows that the greatest reduction in fire spread and intensity occurs when fuel treatments intersect head
fire spread (Finney, 2001, 2004; Finney et al., 2007; Schmidt
et al., 2008), confirming the topological inefficiency of random
pat-tern fuel treatments (Loehle, 2004; Finney et al., 2007; Schmidt
et al., 2008).Finney et al. (2007)showed that long-term landscape
treatment effects on fire growth and behavior, in the western US, are primarily dependent on the rate of application and spatial
pat-tern of treatment units.Schmidt et al. (2008)showed the efficiency
of dispersed, strategically arranged treatments in reducing fire spread and area burned, particularly in simulations of high
inten-sity fire.Finney et al. (2007)also showed that placement of fuel
treatments intersecting spread direction, would require half the area treated than random treatments, to produce the same reduc-tion in fire growth and behavior. The orientareduc-tion of optimized treatment units in that study was determined using a fire growth
0378-1127/$ - see front matter! 2011 Elsevier B.V. All rights reserved. doi:10.1016/j.foreco.2011.09.027
⇑Corresponding author. Address: Departamento do Recursos Naturais, Ambiente e Território, Instituto Superior de Agronomia, Tapada da Ajuda, 1349-017 Lisboa, Portugal. Tel.: +351 213653387; fax: +351 213653338.
E-mail address:barros.anamg@gmail.com(A.M.G. Barros).
Forest Ecology and Management 264 (2012) 98–107
Contents lists available atSciVerse ScienceDirect
Forest Ecology and Management
j o u r n a l h o m e p a g e : w w w . e l s e v i e r . c o m / l o c a t e / f o r e c osimulation technique to identify major fire travel routes (Finney,
2001). Fire growth was simulated under specified weather
condi-tions characterized by fuel moisture, wind speed and direction, obtained from historical records of climatology associated with
se-vere fire events (Finney, 2001). Typically, this results in orientation
of treatment units perpendicular to major fire spread movement, because heading fire behavior is more important to modify than
flanking or backing portions (Finney, 2007). This suggests that
re-search on the geographical orientation of fires is useful for fire management, assuming that the orientation of fire perimeters re-veals the combined effects of wind and topography on fire spread patterns, and allows inference on heading fire movement. System-atic fire mapping over a time frame adequate for fire regime char-acterization can provide useful information for landscape-scale planning of fuel treatments, by establishing an historical pattern of spread orientation.
A few studies have addressed the issue of fire orientation in
relation to weather patterns and topography. Parisien et al.
(2006)found that the geographic orientation of fires was highly
variable within and among Canadian ecozones, responding to the spatial variability of meteorological conditions. The main trends in fire direction across and within ecozones can be attributed not only to dominant weather patterns, but also to specific synoptic patterns associated with high fire danger. Throughout Canada, pre-vailing winds are generally from the west, and south-west winds dominate behind drying high pressure systems, often associated with increasing fire danger. As a consequence, nine out of the 10 ecozones had the highest fire bearing class frequency from west
to east or southwest to northeast (Parisien et al., 2006).
Bergeron et al. (2004)analyzed the main direction of fire spread
in northwestern Quebec’s black spruce forest, and showed that most of the distance covered by fires occurred in the northwest– southeast direction, although the frequency of occurrence of this direction was not high compared to the other directions. Also, those were larger fires, with a mean spread distance of 14.8 km
(Bergeron et al., 2004).
Haydon et al. (2000)analyzed orientations of 196 fire
‘‘ton-gues’’, more commonly known as fire fingers, extracted from 224 grassland fires in the Great Victoria Desert, Australia, and found good correspondence between prevailing wind direction and ‘‘ton-gue’’ orientation.
The main objective of this study was to determine whether fires display a preferred, as opposed to random orientation, at landscape scale. Secondary objectives were to determine if preferred fire ori-entation, when present, varies as a function of fire weather severity and to search for evidence of orographic wind channelling on fire orientation. We used principal component analysis to compute the orientation of fire and watershed perimeters following the
methods developed byLuo (1998). A sequence of hypothesis tests
for circular data were applied to establish preferential alignment of fire perimeter orientation in each watershed and for (1) comparing fire orientation between years with area burned above and below the mean annual value for the study period and (2) comparing fire orientation between small (6100 hectares) and large fires (P1000
hectares) (Fisher, 1993). Orographic channelling was evaluated
according to three different criteria: (1) by comparing a water-shed’s orientation with the 95% confidence interval of the mean fire perimeter orientation, (2) by comparing mean fire perimeter orientation with an interval within ±15! of watershed orientation, and (3) by computing circular–circular correlation between
wa-tershed and mean fire perimeter orientation (Fisher, 1993).
2. Methods 2.1. Study area
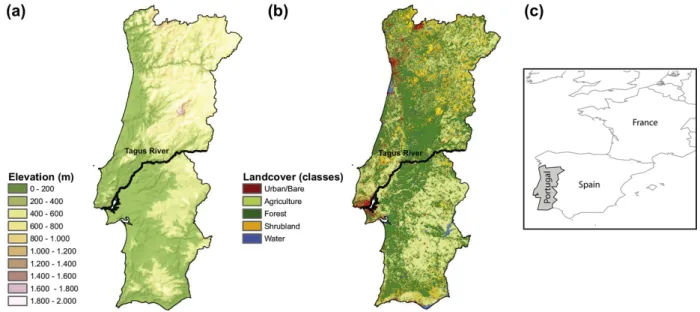
The study area is mainland Portugal, covering around 89,000
km2, located in the Iberian Peninsula, southwestern Europe
(Fig. 1). It exhibits sharp topographic contrasts and can be roughly
divided into two distinct regions, north and south of the Tagus
riv-er (Fig. 1). The region north of the Tagus river is dominated by a
complex arrangement of mountains and highlands above 800 m, interspersed by sharp valleys and pronounced depressions. South of the Tagus river valley is dominated by gentle rolling hills and plains and altitude is seldom higher than 600 m, except for the
mountains at the southwestern end (Ribeiro et al., 1987).
According to Koppen’s classification, Portugal’s mainland climate is classified into two distinct types of warm temperate
climates with a dry season in the summer (Strahler and Strahler,
1992). North of the Tagus river and throughout the southern coast,
the mean of the warmest month is below 22!C (Csb), while south
Fig. 1. Map of the study area, mainland Portugal, elevation (a), land cover classification (b) and location in Iberian Peninsula, southwestern Europe (c). A.M.G. Barros et al. / Forest Ecology and Management 264 (2012) 98–107 99
of the Tagus river the warmest month mean temperature is above
22!C (Csa) (Strahler and Strahler, 1992). Mean annual
precipita-tion is around 900 mm and spatially variable, with highest values being recorded in the highlands of the northwest region and lowest
values in the southern and eastern regions of the territory (
Miran-da et al., 2002). Precipitation is distributed unevenly throughout
the seasons, with the summer season (June to August) recording the lowest values of precipitation, corresponding to only 6% of
the annual precipitation (Miranda et al., 2002).
Forests of mostly evergreen species and woodlands cover nearly
60% of the study area (AFN, 2007). The natural vegetation is
pyro-phytic and resistant to drought. The most important tree species are maritime pine (Pinus pinaster) in the northern half of the coun-try, and blue gum (Eucalyptus globulus) along the western half of the country, as well as in a few areas in the eastern central region
of the country (Fig. 1).
Land cover in southern Portugal is dominated by evergreen oak woodlands, managed as agro-forestry systems. Agricultural areas occupy about half of the study area and mostly dominate in the central coastal plain, along main river valleys, and in the southern part of the country. In central and northern Portugal, land ownership is very fragmented, and the agricultural landscape is a fine-grained mosaic of small parcels of diverse crops, vineyards, and olive groves. The agricultural landscapes of southern Portugal are more extensive and homogeneous, dominated by dryland farming of cereal crops. Most shrublands are found in eastern Portugal, but also occur in other parts of the country, usually in
mountainous and sparsely populated regions (Fig. 1).
Fire incidence is higher in the northern half of the country, where the typical Mediterranean summer coexists with high net primary productivity, leading to an abundance of available fuels. Most of the area burned in Portugal (80%) is due to fire events
occurring during a small number (10%) of summer days, under a typical atmospheric circulation pattern dominated by a strong
ridge located over the Iberian Peninsula (Pereira et al., 2005).
Carvalho et al. (2008)investigated the relationship between fire
weather, the Canadian Fire Weather Index System and the area burned for 11 Portuguese districts, representing 66% of the total area burned between 1980 and 2004. Results suggested that fire weather explains the majority (80.9%) of the variance of the area burned.
Fire history data were obtained from the Instituto Superior de Agronomia national fire atlas, based on late summer/fall Landsat imagery, covering the period from 1975 to 2005, on an annual basis. During the period used in this study, the fire atlas includes 34,345 fire perimeters, accounting for a total area burned of 3,670,000 hectares. The mean annual area burned is 118,000 hectares, with a minimum of 15,500 hectares in 1997, and a maximum of 440,400 hectares in 2003.
2.2. Watershed delineation
Watershed delineation was based on the 90 m digital terrain
data from the Shuttle Radar Topography Mission (Farr et al.,
2007), and the number and size of watersheds was determined
iteratively with two goals: to obtain a detailed topographically-based partitioning of the region, and to ensure that each watershed
contained a minimum of 25 fires (Fisher, 1993).
Watersheds were delineated automatically in ArcMap 9.2 (ESRI,
2009), using a minimum area criterion. In the first iteration,
mini-mum watershed area was set at 10,000 hectares, yielding a highly detailed map with 700 watersheds. Most of these contained fewer than 25 fires. Consequently, the minimum area threshold was in-creased in 10,000 hectares increments, up to a value of 40,000
(a)
(b)
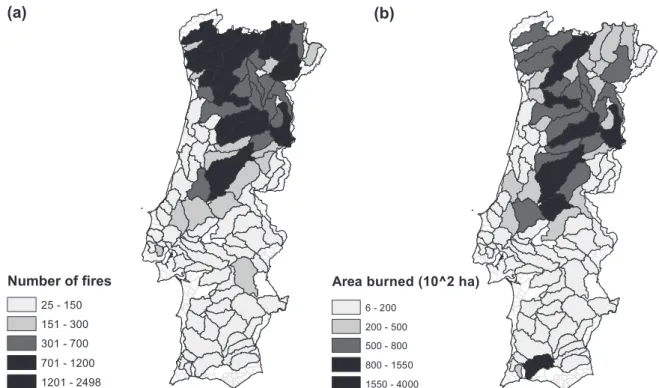
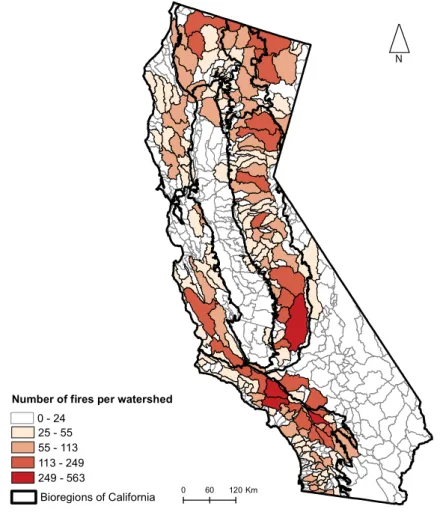
Fig. 2. Number of fires (a) and area burned (b) per watershed. Each fire perimeter is associated with the watershed that contains its centroid. Automatic delineation of watersheds, based on setting the minimum size threshold and delineating all watersheds above it, resulted in a partition of the study area into 102 watersheds with minimum of 25 fire observations in each. International watersheds and watersheds with less than 25 fires were excluded. Area burned reported for a watershed is the sum of the area of all fire perimeters associated with that watershed.
100 A.M.G. Barros et al. / Forest Ecology and Management 264 (2012) 98–107
hectares. Along coastal areas, watersheds smaller than 40,000 hectares were included as long as they contained at least 25 fires. The final map was edited to exclude international watersheds, since we do not have the perimeters of fires occurring in the Span-ish portion of these watersheds. This resulted in a total of 102 watersheds, with sizes varying from 10,400 hectares to 277,835 hectares. Each fire was considered belonging to the watershed con-taining its centroid. The 102 watersheds correspond to 83% of the Portuguese mainland territory and contain 30,459 fire perimeters, accounting for 90% of the 1975–2005 overall area burned. The number of fires per watershed ranges from 25 to 2498, while the
area burned varies from 500 hectares to 380,900 hectares (Fig. 2).
2.3. Orientation vs direction
Circular data refers to data measured on an angular scale, in de-grees or radians. There are two kinds of circular data, vectorial (directional) and axial (orientational) circular data. Vectorial data consists of a directed line where both the departure point and direction of movement are known, e.g., the vanishing directions of homing pigeons. Axial data consists of an axis or undirected line, where either end of the line can be taken as the direction of
move-ment, such as a fracture in a rock exposure (Fisher, 1993).
The analysis of circular data requires the definition of an origin, and a sense of rotation – clockwise or counterclockwise
(Jammalamadaka and Sengupta, 2001). In this work we computed
the orientation of each watershed and fire event. These orienta-tions correspond to axial data, since we lack information on igni-tion points or the actual fire spread direcigni-tion. We considered
true north (N) as the origin and measured orientations clockwise. Given that all orientations are axial, it follows that 0! (North, N)
is equivalent to 180! (South, S) (Fig. 3). For the sake of simplicity,
we shall refer to axial measurements in the compass classifications: N/S, NE/SW, E/W and SE/NW, which can be re-garded as equivalent to the orientations S/N, SW/NE, W/E and NW/SE, respectively.
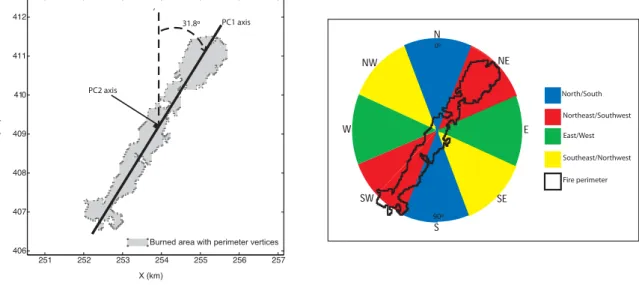
Fig. 3. Classification of axial data in terms of compass orientation. For each fire and watershed perimeter an orientation value, hor, is calculated. Orientation values
range between 0! and 180! and were classified into compass classification as a function of hor as follows: N/S ,hor2[0;22.5]^hor 2]157.5;180]; NE/
SW,hor2]22.5; 67.5]; E/W ,hor2]67.5; 112.5]; SE/NW ,hor2]112.5;157.5]. Differ-ent shades of grey distinguish the range of the intervals described above.
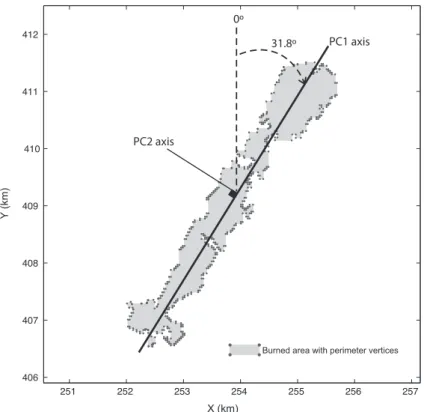
Fig. 4. Fire perimeter vertices are represented by its X and Y coordinates, in a bi-dimensional space. From all possible axis passing through the object center of mass, the first principal component axis (PC1 axis), corresponds to the axis that maximizes the variance among projection of all points that constitute the object boundary and also reflects the longest diagonal of the object. The second principal component axis (PC2 axis) is orthogonal to the PC1 axis. In this example principal component analysis of the vertices resulted in a PC1 axis with NE/SW (31.8!) orientation. This orientation is measured considering True North as 0! and rotating clockwise.
2.4. Fire and watershed perimeter orientations
We used principal component analysis (PCA) (Jolliffe, 2002) to
determine the orientation of fire and watershed perimeters,
fol-lowing the approach proposed byLuo (1998). Each object (fire or
watershed) boundary vertex corresponds to a point in a bi-dimen-sional space defined by its (X,Y) geographical coordinates. The first principal component (PC1) corresponds to an axis in this bi-dimen-sional space that passes through the object’s center of mass and onto which all points are projected. The orientation of this axis maximizes the variance of the projected boundary points, reflect-ing the length of the object’s longest diagonal, and is taken as the
object’s orientation (Fig. 4).
Object orientation obtained by PCA is less sensitive to boundary details, including inaccuracies, than alternative methods for
orientation analysis (Luo, 1998). This is advantageous in our case,
since fire boundaries have different levels of detail, depending on whether they result from automatic image classification, or from post-classification manual boundary editing. For a detailed description of a four-step algorithm to compute orientation by
principal component analysis seeLuo (1998), pp. 131–136. For
the purpose of the present work, this algorithm was implemented
in Matlab using the built-in princomp function (MathWorks, 2008).
2.5. Circular statistics analysis
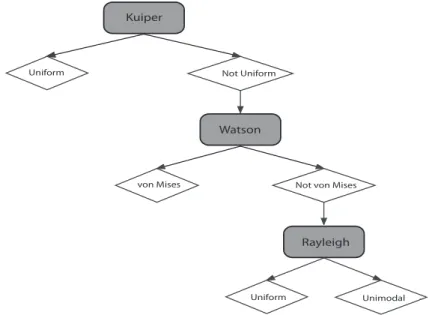
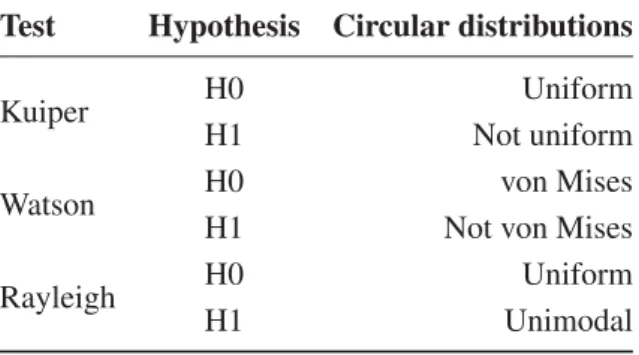
We conducted a sequence of hypothesis tests – Kuiper’s, Watson’s and Rayleigh’s tests – that investigate the distribution of the population of fire perimeter orientations in each watershed
(Fig. 5). These three tests can assess the evidence for a uniform, von
Mises and unimodal distribution, respectively.
The circular uniform distribution plays a central role in circular statistics because it represents the absence of a preferred direction, i.e., all directions are equally probable. The von Mises distribution, is the circular analog to the Normal distribution of linear statistics
(Davis, 1986). It has two parameters, the first of which defines the
location of the reference direction of the distribution (mean direc-tion), while the second parameter defines the scatter about that location and is called concentration (k). The von Mises distribution
is symmetric around the mean and increasing k corresponds to increasing concentration around the mean direction. As k ap-proaches zero the von Mises distribution tends toward the circular
uniform distribution (Fisher, 1993).
If the data fit neither a von Mises, nor a uniform distribution, it may still contain a single mode, thus following a unimodal
distri-bution (Fisher, 1993). In this case, although it is not possible to
identify the actual distribution, the presence of a mode not only indicates a preferred orientation in the sample, but also enables the use of non-parametric methods to estimate a mean direction with a confidence interval.
Fig. 5represents the sequence of hypothesis tests performed in
this analysis. The Kuiper test is an omnibus test, meaning it tests the hypothesis of the sample following a uniform distribution, against any alternative distribution. If the null hypothesis is re-jected, then there is evidence against uniformity and the possibility that the data fit the von Mises distribution is tested. The goodness of fit of the von Mises model can be formally assessed using
Watson’s test (Fisher, 1993). The null hypothesis in this test is that
the data are drawn from a von Mises distribution, against the alter-native that they are not drawn from a von Mises distribution. Rejection of the null hypothesis in the Watson’s test, leads to rejecting the hypothesis that the data fits a von Mises model. The next step is to determine whether the data presents a single modal direction, using Rayleigh’s test, where the alternative hypothesis is
unimodality (Fisher, 1993).
For each watershed for which there is evidence of a preferred fire perimeter orientation (von Mises or unimodal), we calculated
the circular mean (Fisher, 1993; Otieno and Anderson-Cook,
2006), its confidence interval, and circular variance. The circular
mean, denoted by h, is computed from:
cos h ¼CR and sin h ¼RS ð1Þ
where, C ¼X n i¼1 cos hi; S ¼ Xn i¼1 sin hi; ð2Þ
Fig. 5. Flowchart representing the sequence of hypothesis tests based on circular distributions. Round rectangles represent tests and splits to the left and right represent acceptance and rejection of the null hypothesis, respectively. White diamonds represent the decisions regarding the fit to circular distributions (uniform, von Mises, unimodal) at a significance level of 5%.
102 A.M.G. Barros et al. / Forest Ecology and Management 264 (2012) 98–107
R2
¼ C2þ S2 ð3Þ
The circular variance varies between zero and one and its inter-pretation is similar to variance in linear data, the smaller the value of circular variance, the more concentrated is the distribution. Circular variance is defined as:
V ¼ 1 % R ð4Þ
where R is the mean resultant length associated with the mean ori-entation h, and is defined by:
R ¼Rn ð5Þ
where, n is the number of observations and R is defined by Eq.3.
Confidence intervals for the circular mean fire orientation were computed in two ways, depending on whether the goodness of fit tests indicated a von Mises distribution or a unimodal distribution for the fire orientations within the watershed. A parametric approach was used if the fire orientations had a von Mises distribu-tion, and a non-parametric approach was used if only a unimodal
distribution was suggested by the goodness of fit tests (Fisher,
1993).
The 95% confidence intervals for the mean fire orientation in each watershed were used to formally assess alignment between mean fire orientation in a watershed and the orientation of the tershed itself. Alignment is considered to occur when the wa-tershed orientation is contained in the mean fire orientation
confidence interval (Rothermel, 2004). This definition of alignment
is sensitive to the number of observations in each watershed. Therefore, as an alternative measure of similarity between fire and watershed orientation, we identified watersheds where mean fire orientation was within ±15! of watershed orientation. To eval-uate the influence of major watershed orientation on fire perimeter mean orientation we calculated the circular correlation between
watershed orientation and mean fire orientation (Fisher, 1993).
Airflow is guided by topographic features, such as mountains or
valleys, establishing local wind direction (Schroeder and Buck,
1970). Alignment between fire orientation and the watershed
ori-entation may be indicative of watersheds where topography determines directional orographic alignment of winds and
conse-quently, wildfires (Schroeder and Buck, 1970; Pyne et al., 1996).
We hypothesized that fire orientation patterns may differ in re-sponse to distinct synoptic weather patterns. We tested this hypothesis using two alternative partitions of the original data. In the first approach,we compared fire orientations between mild and severe fire years, using total annual area burned as proxy for
fire weather severity (Nunes et al., 2005; Pereira et al., 2005; Trigo
et al., 2006; Syphard et al., 2011). We used the 10 years with higher
area burned and the 10 years with lower area burned, under the assumption that the two samples are drawn from distinct popula-tions. This analysis was performed considering watersheds with at least 25 fire observations in both time periods, which corresponds to 36 of the 102 watersheds in the study area. In the second ap-proach, we compared individual fire orientations between all the fires with area burned below 100 hectares (small fires) and area burned above 1000 hectares (large fires), using fire size as a proxy for the atypical meteorological conditions conducive for days of
extensive area burned (Pereira et al., 2005; Hoinka et al., 2009).
The statistical comparison between the high and low area burned data in each watershed, was done using the Watson– Wheeler test which compares two populations to determine if
their distributions are identical (Fisher, 1993). This is a
non-para-metric test, with the null hypothesis stating that the two
popula-tions are drawn from identical distribupopula-tions (Fisher, 1993). The
same test was used to compare small and large fires nationally,
since the small number of fires larger than 1000 hectares pre-cluded a watershed-level analysis.
All statistical analyses were performed with Oriana (Kovach,
2003), with the exception of the non-parametric confidence
inter-vals, which were computed in Matlab (MathWorks, 2008). All
formal hypothesis tests were conducted using a 5% significance level.
3. Results
Analysis of fire perimeters over the 31-year dataset showed that, of the 102 watersheds in the study area, 53 watersheds dis-played a preferred fire orientation, out of which 41 watersheds fit a von Mises distribution, whilst 12 watersheds followed a
uni-modal distribution (Fig. 6). Forty-eight watersheds followed a
uniform distribution. For one watershed no conclusive results were attained regarding its fire orientation distribution. However, this watershed only accounts for less than 0.5% of the study area and of the overall area burned.
Watersheds where fires display a uniform distribution of fire orientation, mostly found along the southern half of the country, represent 38% of the study area, and account for 16% of overall area burned. Watersheds with von Mises and unimodal fire orientation distributions are mostly located in northern and central Portugal and represent 86% of the overall area burned, while covering 61% of the study area. Variances of fire orientations range from 0.25 to 0.48, and watersheds in the northern part of the country present
higher dispersion around the mean fire orientation (Fig. 6).
The circular mean orientation was computed for watersheds where fires display preferential orientation. Compass classification of mean fire orientation shows two distinct clusters in central
Portugal, with NE/SW and SE/NW orientations (Fig. 6). These two
clusters account for around 65% of total area burned in the 31-year
dataset (Fig. 7). All watersheds aligned NE/SW occur in the
north-ern half of the study area, while the remaining orientations are associated with watersheds, either clustered or isolated, but dis-tributed throughout the entire study area. There is also a group of watersheds with E/W orientation in northeastern Portugal.
Major topographic orientation of each watershed varies throughout the study area, with clusters of NE/SW and SE/NW orientation in the center and northwest regions, N/S clusters along the coast and northeastern border with Spain, and E/W clusters
throughout the entire study area (Fig. 8). Comparison between fire
and watershed orientation shows that while fire orientation shows two important clusters, with NE/SW and SE/NW orientations
(Fig. 6), watershed orientation is more variable (Fig. 8).
From a total of 53 watersheds evidencing preferential fire orien-tation, only eight display a watershed orientation that is contained within the mean fire orientation confidence interval, indicating strong alignment between watershed orientation and fire orienta-tion in these eight watersheds. Following the alternative criterion for topographic alignment resulted in four more watersheds with evidence of mean fire-watershed alignment. The circular–circular correlation coefficient between watershed orientation and mean fire orientation per watershed has a value of 0.208, suggesting a weak relationship between major watershed orientation and cor-responding fires.
The Watson–Wheeler test did not indicate that fires occurring in the 10 years with highest area burned and fires occurring in the 10 years with the lowest area burned had differing distribu-tions of fire perimeter orientation. For only one of the 36
water-sheds analyzed, was there a significant difference (a= 0.05). This
suggests that during severe fire weather years, although total area burned increases, the orientations of fire perimeters remain consis-tent with those observed during moderate and mild fire seasons.
(a)
(b)
(c)
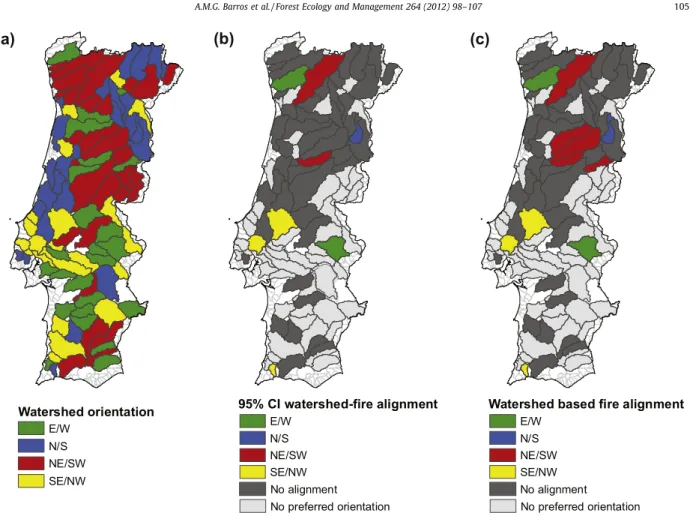
Fig. 6. Circular distributions fitted to fire perimeter populations (a), mean fire perimeter orientation (b) and its circular variance (c), in each watershed. Both von Mises and unimodal distributions indicate the presence of a preferential orientation in the data, while watersheds where fire perimeters follow a circular uniform distribution show no indication of preferential orientation, at a 5% significance level (a). Watersheds where fires display a preferential orientation are represented in a color coded scheme according to the compass classification of its mean fire perimeter orientation – green, blue, red and yellow, for mean fire orientation in the E/W, N/S, NE/SW and SE/NW orientations, respectively (b). Light grey represents watersheds with no preferred orientation (uniform distribution). Circular variance ranges from 0 to 1, with higher values for higher variance around the mean direction (c). (For interpretation of the references to color in this figure legend, the reader is referred to the web version of this paper.)
Fig. 7. Area burned per orientation class. Two major clusters, in the NE/SW and SE/NW account for around 65% of the total area burned in the 1975–2005 time period. Watersheds where fire perimeter orientation is circular uniform, i.e., with no preferential orientation of fires, represent roughly 16% of the overall area burned and are mostly located in the southern portion of the study area.
104 A.M.G. Barros et al. / Forest Ecology and Management 264 (2012) 98–107
Results for the comparison between small and large individual fires also found little evidence of differing orientations (p = 0.69). 4. Discussion and conclusions
The primary objective of this work was to determine whether fires display geographical orientation patterns, at the watershed scale. A secondary objective was to analyze the relationship be-tween the orientation of fires in a watershed and the orientation of the watershed itself. We also investigated the hypothesis that fire orientation patterns would vary between low and high area burned fire seasons and between small and large fires.
Our analysis suggests that orientation patterns are similar
during mild and severe fire seasons and also small (6100 hectares)
and large (P1000 hectares) fires have similar orientations nation-ally. However, these analyses had two underlying assumptions: total area burned in each year and fire size can be used as proxies for severe fire weather, which primarily determines the occurrence of the majority of area burned in each fire season. This may not be the case; and perhaps a more appropriate delineation to study the effects of fire weather on fire perimeter orientation would focus on comparing the orientation of fires that occurred during days of extensive area burned with fires occurring under milder weather
conditions (Pereira et al., 2005; Carvalho et al., 2008). This was
not done in this study because we lack information regarding the date of ignition and duration of individual fires.
The circular statistics analysis showed that 84% of the area burned between 1975 and 2005 is located in watersheds where fires display preferential orientation. This is a remarkable result, considering the heterogeneity of land cover, topography and infra-structure networks across these watersheds, and the role of fire suppression activities. In southern Portugal only a few watersheds display non-uniform fire orientation, but this region corresponds to a small fraction of the total number of fires and area burned. Gently rolling terrain, without very prominent topographic fea-tures, relatively homogeneous land cover, and a prevalence of agri-cultural land management fires, typically set under mild weather conditions, may account for the lack of preferred orientation of fire perimeters.
Two large clusters of watersheds with preferentially-oriented fires are found in central Portugal. Fire orientation is typically NE/SW in the northernmost cluster (red), and SE/NW in the southernmost cluster (yellow). Together, these two clusters repre-sent 65% of overall area burned and contain many of the largest fires recorded during the study period. The location and geograph-ical extent of these clusters is suggestive of a broader scale, cli-matic determinant, rather than finer scale topographic control.
(a)
(b)
(c)
Fig. 8. Watershed orientation (a), watershed-fire alignment following the 95% confidence interval (b) and alignment according to watershed orientation (c). In (b) fires were considered aligned with watershed when watershed orientation is contained in the 95% confidence interval for fire mean direction. An alternative measure of alignment (c) is to consider that fires are aligned with watershed if mean fire orientation is within the angular interval centered at the watershed orientation ±15!. The analysis of potential topographic alignment is performed only for watersheds where fires display evidence of preferential orientation, i.e., watersheds where fire orientation fits the circular uniform distribution were excluded.