Evaluating the financial performance of Companies
from the Pharmaceutical Industry
Mirela Camelia BABA
1Abstract: The pharmaceutical industry has become a highly competitive environment, which is why performance represents the key element to stay on a market. Evaluating the performance of the economic entities from this sector is of high importance for the management, shareholders, trading partners and creditors. This study focuses on investigating and analyzing the financial statements for 12 drug producing companies in Romania. The analysis is based on data corresponding to the period 2008-2015.
Key-words: financial statements, performance, pharmaceutical industry
1. Introduction
The pharmaceutical market refers to the industry of manufacturing and marketing drugs. In the past years the consumption of drugs has increased per inhabitant, the period 2008-2015 being quite favorable for the pharmaceutical market from Romania. In times of crisis and economic uncertainty, the companies from the pharmaceutical sector have registered economic growth, but given the fact that competition is quite fierce, performance remains an important criterion for maintaining your company on the market. Also, it can not be neglected the structure of the analyzed sector, because on one hand it can determine the sectors' competitive intensity and on the other hand its average profitability (Drumea, 2004).
Dincă and Dincă (2014) have analyzed financial performances for five Bucharest stock exchange listed companies using an econometric model with data for 2014-2011. The authors found that 64% of return on investment’s (ROI) evolution was explained by the influence exerted by the determinants of the cash conversion cycle, by return on assets and by the relative modification of the sales turnover. Deari and Dincă (2015) have analyzed financial performances of 40 selected Romanian companies for the 2009-2013 period. They found that the companies with higher current to total assets ratio have higher assets turnover and ROA. The performance of an economic entity can be analyzed by using its financial
1
statements, namely with the help of the profit and loss account. An economic entity is performing if it has the ability to make profit (it’s cost effective) and if it has the ability to pay its debts on short and long term.For profit and must be performance company win customers' trust (Neacşu, 2015).
2. Methodology
factors of production involved, as well as achieving a surplus, represented by the overall result of the economic activity.
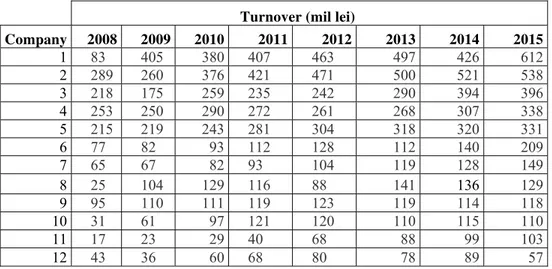
An indicator that measures the performance of companies, used as a criterion for ranking them in terms of their economic importance is the turnover. The turnover represents the value of sales made over a period of time by an economic entity. This indicator allows assessing the place of the company in its sector, its market position, its skills to launch and develop different activities which would bring profit. However, the change of the turnover is reflected on the main financial indicators as well as on the efficiency of the activity of economic entities. In the manufacturing sector, the net turnover expresses the total volume of businesses and includes all the revenue from the sale of the products obtained. The dynamics of the turnover for the 12 economic entities producing drugs is shown in Table 1.
Turnover (mil lei)
Company 2008 2009 2010 2011 2012 2013 2014 2015
1 83 405 380 407 463 497 426 612
2 289 260 376 421 471 500 521 538
3 218 175 259 235 242 290 394 396
4 253 250 290 272 261 268 307 338
5 215 219 243 281 304 318 320 331
6 77 82 93 112 128 112 140 209
7 65 67 82 93 104 119 128 149
8 25 104 129 116 88 141 136 129
9 95 110 111 119 123 119 114 118
10 31 61 97 121 120 110 115 110
11 17 23 29 40 68 88 99 103
12 43 36 60 68 80 78 89 57
Table 1. The turnover of the drug producing companies
The companies listed in Table 1 are the top 12 companies producing pharmaceutical products in Romania which have recorded the highest sales in 2015. The turnover has registered an upward trend in the analyzed period (especially between 2011-2015), this trend is mostly due to an increase in the products sold as well as to an increase in the number of employees.
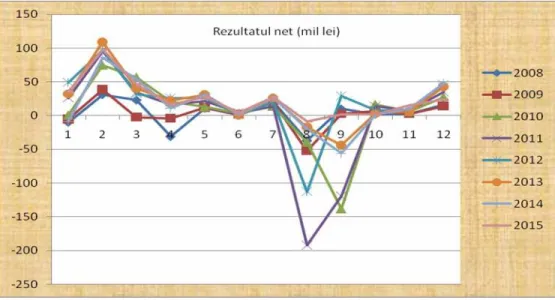
net result which had negative values in the period under review. The evolution of the stock market climate starting with 2008 resulted in a negative impact on the financial result due to the revaluation of the stock portfolio. It is one of the factors that competed at the volatility of the net result of the companies from the pharmaceutical sector in the period 2009-2010. The other 10 companies have registered positive and increasing values of the net income (Figure 1).
Fig. 1. Evolution of the net result
Fig. 2. Return on equity
An indicator that can quantify the amount of external financing in relation to the possibility of self-financing of an economic entity is the degree of indebtedness. This may also be a barometer of the entity's independence face to its creditors (Anton, 2009). The degree of indebtedness is calculated as the ratio between total debt and equity. The higher this indicator is the more dependent the economic entity is on commercial loans or debts. A reasonable situation demands that this indicator does not exceed the threshold of 0.5. The degree of indebtedness of analyzed entities is between 0.06 and 25.45. The economic entities have registered a high degree of indebtedness face to its creditors, especially in the period 2009-2012. Among the analyzed companies, only two of them do not exceed the threshold of 0.5. Given the high level of the degree of indebtedness registered by the analyzed economic entities, we can say that their funding depends on a lower proportion of own resources and on a greater proportion of borrowed sources (usually bank loans). The mentioned entities may face the danger of insolvency, the given situation reflects an increased dependence on external sources.
3. Conclusions
years 2009-2012. Another finding of this study refers to the rather sensitive position concerning the degree of indebtedness. In the case of four out of the twelve analyzed companies, the degree of indebtedness has recorded quite high values mostly in 2009-2011, which indicates a relatively low potential for self-financing, meaning that the economic entities finance themselves from external sources. One possibility for reducing debts would be compensating claims with debts, and thus eliminating the possible delay penalties. In conclusion, we note that the economic entities from the pharmaceutical sector show an overall positive financial performance that might generate significant added value, as evidenced by the calculated indicators. The present research has some limitations, inevitable in any scientific endeavor of this kind, that only open up new horizons for future research. A first restriction in appreciating the performances refers to the number of analyzed companies, and the temporary horizon.
4. References
Anton, C., 2009. Considerations Related to the Analysis of the Financial Balance of the Trading Company Interlink Group SRL. Bulletin of the “Transilvania”
University of Braşov , Vol. 2 (51), Series V, pp. 151-160.
Busuioceanu, S., 2014. Characteristic features of the marketing in the accounting profession. Young Economists Journal ,10 (21), pp. 65-73.
Căruntu, C. and Lăpăduşi, M., 2009. Financial return on assets. The impact of the financial return on assets over the company’s development. Annals of the „Constantin Brâncuşi” University of Târgu Jiu, Economy Series, pp. 96-108. Deari, F. and Dincă G., 2015. Financial performances of Romanian wood industry
companies. Bulletin of the “Transilvania” University of Braşov, Series V, Vol. 8 (57), No. 1, pp. 147-158.
Dincă, M.S. and Dincă, G. 2014. The analysis of economic performances using return on investment. Journal of Applied Economic, 2(28), pp. 244-253.
Drumea, C., 2004. Diagnosticul financiar-strategic al firmei. Braşov: Ed. Infomarket.
Neacşu, N.A., 2015. Implementation of ISO 22000 - a tool to increase business efficiency and customer satisfaction. A Case Study: SC Prodlacta Brasov.
Bulletin of the „Transilvania” University of Braşov , Vol. 8 (57), Series V, No.1, pp.105-110.
Vasilache, V., 2009. The Rate of Financial Return – An Illustration of How Well Capital is invested in the Company. Contabilitatea, expertiza şi auditul afacerilor, pp. 38-43.