Food Science and Technology
DOI:
D httpsI://doi.org/10.1590/fst.02018
OSSN 0101-2061 (Print) OSSN 1678-457X (Dnline)
1 Introduction
Color is the first quality attribute of food evaluated by consumers, and is therefore an important component of food quality relevant to market acceptance. Rapid and objective measurement of food color is required for quality control in the commercial application (Wu & Sun, 2013). The sensory characteristics of foods may vary depending on the quality of the raw material or the duration and temperature of storage. These changes in sensory characteristics of food can be determined using instrumental devices as well as by the perception of color, tissue, taste and smell through human senses. However, human senses may not always produce precise results since the color change in food is identified subjectively. For this reason, the determination of the characteristic color changes in the food without a homogenous color using instrumental analysis method is especially important.
Consumers initially accept or reject a food based on its color and other visual attributes. Subjective evaluation in sensory analysis is determined by the change in color and brightness, the perception of the finger touching and chewing and the sensory differences in flavor and smell characteristics from the
aromatic properties. The human eye can discern thousands of color shades and intensities compared with approximately only 24 shades of gray. On machine vision an image of the sample is digitized into pixels containing levels of the three primary colors (red, green and blue = RGB color system) (Gumus et al., 2011). Skin color of fish is an important quality indicator and affects purchase decisions. However, the brightness control on the fish skin is critical to the color measurement and specular reflection changes the perceived color, therefore, the use of polarized light is required for accurate color measurement in these cases.
There are various researches focused on the discoloration of food. The color change of the snapper and gurnard skin and eyes during refrigerator room at 1 ± 0.5 °C was accurately determined using polarized light (Balaban et al., 2014). Omage processing was successfully employed for fish freshness assessment by measuring the color parameters of images captured from gill and eye of ice stored gilthead sea bream (Dowlati et al., 2013). Yagız et al. (2009) also reported the importance of the meat color in consumer acceptance and outlined that proper measurement of color has been an important tool in muscle food research.
Color assessment by different techniques of gilthead seabream
(
Sparus aurata
) during cold storage
Gülgün F. ÜNAL ŞENGÖR1*, Murat D. BALABAN2, Bülent TDPALDĞLU3, Zayde AYVAZ4, Zafer CEYLAN5, Hande DDĞRUYDL1
Received 27 Feb., 2018 Accepted 06 June, 2018
1 Department of Fisheries and Seafood Processing Technology, Istanbul University, Istanbul, Turkey 2 Department of Chemical and Materials Engineering, The University of Auckland, Auckland, New Zealand 3 Department of Marine Biology, Istanbul University, Istanbul, Turkey
4 Department of Marine Technology Engineering, Çanakkale Onsekiz Mart University, Çanakkale, Turkey 5 Department of Fisheries and Seafood Processing Technology, Van Yüzüncü Yıl University, Van, Turkey
*Corresponding authorI: [email protected] Abstract
Dverall objective of the study was assessment for freshness parameters of gilthead seabream (Sparus aurata). The freshness was determined by two conventional method (i.e. Minolta color measurement method) was compared with a novel machine vision technology (i.e image color analysis method). The quality characteristics related to the freshness of the fresh fish are traditionally based on the color measurements of the whole fish by using Minolta color measurement method. This study aimed to compare the use of the image analysis method to see whether the freshness of seafood can be measured more accurately. Dur analysis proved more exact and reliable results in the freshness evaluation of the Sparus aurata based on the color changes in the eyes, gill and skin of the fish. This study revealed that image analysis can be successfully used for the assessment of fish freshness by measuring the color parameters of images captured from skin, gill and eye of the fish during cold storage. Ot is easy and practical to use image color analysis method in the quality control evaluation of fish freshness measurement. This analysis method can be suitable for use in continuous process at the seafood processing factories (e.g. before packaging to sort out fresh vs old fish automatically).
Keywords: color analysis; gilthead seabream; freshness; image analysis method; Minolta technique.
Machine vision has the ability to measures color with high spatial resolution, thus it can outperform other colorimeters while recording and estimating subtle color changes in foods (Dliveira & Balaban, 2006). Machine vision system produces significant information about color attributes and may be used in predicting the total quality of tilapia fillets (Korel et al., 2001). Electronic color measurement devices define color in terms of a* (red/green), b* (yellow/blue) and L* (lightness) values. These three value along with chroma and hue values can be used for describing the color of a food product (Yagız et al., 2009). Although the Minolta colorimeter provides simple and fast color measurements, it has some limitations. The food should have uniform surface and color. Additionally the sampling location on the food, as well as the number of readings have important effects on obtaining mean values of color accurately (Dliveira & Balaban, 2006). Sensorial, physicochemical, rheological, and other conventional methods have been used for assessment of quality of fish and other seafood. Recently, spectroscopic methods and other emerging techniques have shown great potential due to speed of analysis, minimal sample preparation, high repeatability, low cost, and, most of all, the fact that these techniques are noninvasive and nondestructive and, therefore, could be applied to any on online monitoring system (Hassoun & Karoui, 2015).
Most of previous study has focused on finding rapid and objective method to determine fish freshness. Ünal Şengör et al. (2017) demonstrated that time-temperature indicators could be used to monitor the freshness of the fish during cold storage. Recently image analysis is one of the most common methods used to identify the freshness of fish. Omage analysis method enables to perform a flawless measurement of the color changes in the fish which are evaluated subjectively by customers at first glance. Foods are susceptible to color deterioration with decreasing freshness. Color changes of the skin, meat, gill and pupilla of the fish should be evaluated to identify the freshness of the product.
The main objective of this study was to assess the freshness of gilthead sea bream during cold storage by comparing the results of image analysis method and Minolta color measurement technique.
2 Materials and methods 2.1 Sample preparation
Fresh gilthead seabream (Sparus aurata), which were aquacultured in net cages in Bodrum, Turkey, were purchased from Ostanbul central fish market. The average length and weight of the fish samples were 270 mm and 340 g, respectively. Dne hundred and twenty fish were transferred in flake ice and polyethylene boxes to Seafood Processing Technology Laboratory, Ostanbul University immediately after purchasing.
The fishes were assigned to the groups randomly. All groups were stored at 3.7 ± 0.6 °C in cold storage for up to 18 days in polyethylene boxes. Control group (C,30 fish) was not iced to emulate the storage conditions in retail outlets. The second experimental group (Oced onlyI: OD, 45 fish) was kept in ice into polyethylene boxes, which were drilled to drain melted water.
Cover paper (FoodTouch, 2015, Elk Grove, OL, USA) was used the third experimental group; iced and cover paper (OFT, 45 fish). The fish were not individually wrapped with cover paper layer and placed in ice as in retail conditions. Oce flakes covering the fish were changed every other day for Oced only (OD) and Oced and Cover Paper (OFT) groups. The polyethylene boxes were drilled to drain melt water. The cover paper layer was changed every time ice was renewed. The lids of the boxes were kept closed to make sure that the fish was kept in a stable condition during cold storage.
2.2 Image color analysis method
LensEye software (ECS, Gainesville, FL) was used to segment the images using the two-image method (Alcicek & Balaban, 2012), to calibrate the color of every object pixel, and to calculate the average L*, a* and b* values of the objects’ surface. On this method, first an image of the objects is taken using “back-lighting,” with appropriate camera settings described in Table 1. Omage acquisition was performed for each period by using n = 5 fish during storage (0, 2, 4, 6, 8, 10, 12, 14, and 18 days) with machine vision system (MV). A Nikon D300S digital camera (Nikon Corp., Tokyo, Japan) with an 18-135 mm zoom Nikon lens with attachment of a circular polarizing filter was mounted inside the illumination space, close to the top light box and facing towards the top surface of the bottom light box upon which the samples were placed (Top light temperature was 3500 °K and bottom light temperature was 4000 °K). A color reference (Gretag Color Checker, X-Rite Onc., Grand Rapids, MO) was placed in every image to correct the image colors during image analysis. Also, a size reference (5 cm × 5 cm thin gray square) was present in every image. Dnly polarized images were used to assure that color bias due to specular reflection was eliminated (Figure 1). Data collected from LensEye were used to determine the differences between colors of skins, eyes and gills during chilled storage (Equation 1)I:
( )
2/ * 25
Fish surface area cm =fish image pixels reference square pixels (1)
2.3 Skin color
Every pixel of the view area of the fish visible to the camera was included in the color analysis. The average L*, a*, and b* values, as well as distribution of these colors were obtained.
2.4 Quantification of the change of eye and gill colors
A circular region of interest (RDO) that fits into the black area of the eye of the fish was defined in LensEye, and this RDO was used for every fish, assuring equal size for analysis of eye color. The average L* value of this RDO was used. Same measurement and evaluation method was applied for the quantification of the color change of gills.
2.5 Minolta color measurement technique
plate (D65,Y = 93.9, x = 0.3155, y = 0.3319) before each use L*, a*, b* values were measured under D65 illumination. L*, a*, b* values were evaluated by using triple fish samples and dorsal part of each fish were measured three times for skin and flesh, separately. Finally, average value was calculated and recorded. L* value represents lightness from black to white between 0 and 100. While a* value represents from red (+) to green (-), b* value represents from yellow (+) to blue (-) in color measurement of fish.
2.6 Statistical analysis
Data analysis was conducted using OBM SPSS Statistics 22.0 (OBM Corp., Armonk, New York, USA). Data were expressed as mean ± SD. Normal distribution of data was tested by Kolmogorov-Smirnov test for normality. Differences among mean values were examined using the one-way anova Tukey’s range test at P = 0.05 significance level.
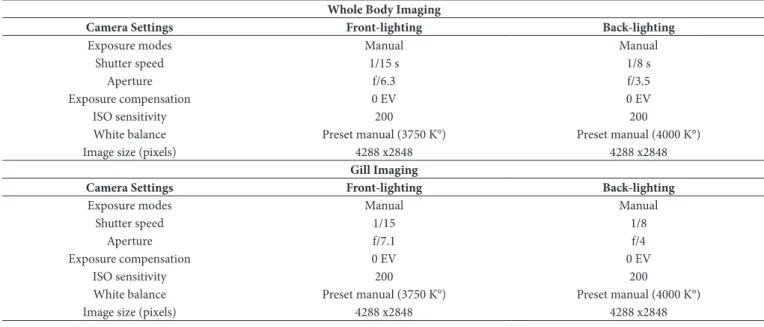
Table 1. The Nikon D300S camera control settings for front-lighting and back-lighting images.
Whole Body Imaging
Camera Settings Front-lighting Back-lighting
Exposure modes Manual Manual
Shutter speed 1/15 s 1/8 s
Aperture f/6.3 f/3.5
Exposure compensation 0 EV 0 EV
OSD sensitivity 200 200
White balance Preset manual (3750 K°) Preset manual (4000 K°)
Omage size (pixels) 4288 x2848 4288 x2848
Gill Imaging
Camera Settings Front-lighting Back-lighting
Exposure modes Manual Manual
Shutter speed 1/15 1/8
Aperture f/7.1 f/4
Exposure compensation 0 EV 0 EV
OSD sensitivity 200 200
White balance Preset manual (3750 K°) Preset manual (4000 K°)
Omage size (pixels) 4288 x2848 4288 x2848
3 Results and discussions
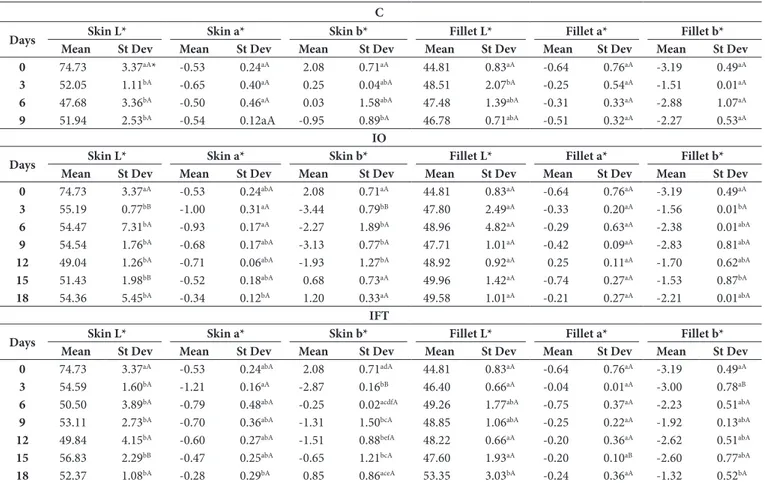
The change in the freshness of the gilthead seabream during cold storage was determined by Minolta color measurement technique and image analysis methods. Table 2 presents the results of Minolta color analysis technique. The color change in the skin of the fish was evaluated based on the L* (brightness) and b* (yellowness) values. The changes in its mean were based on the L* (brightness) and a* (redness) values. The mean values of L* for the skin and flesh of the gilthead seabream were determined as 74.73, and 44.81, respectively.
This study found that the brightness in the skin of the control group fish (group C) disappeared gradually during the storage period, and the skin got darker, while there was no significant change in the brightness of the fish meat in the other groups. On the OD group, there was no significant difference in the brightness of the color of the meat. Ot was only the OFT group fish that had a dominant light color on the eighteenth day of storage. According to Minolta color measurement technique, the initial a* value of the fish meat was -0.64 and the a* values of all groups did not show a significant color change during the entire storage duration. Ot was only the OFT group that had an important change in the a* value of their fish meat. The initial b* value of the fish skin is 2.08 and the b* values of all groups showed that the yellow color was turned into light yellow during the storage
duration. On group C, there was a significant difference in the b* values of fish skin between days 0 and 9. On groups OD and OFT, the difference in the b* values of fish skin on the third day of storage was significant.
On this study, monitoring the changes in L* and b* values of the skin of gilthead seabream is very important to determine the freshness of the fish, since there were difficulties determining the changes between the groups regarding color measurements and making a precise measurement of color in color measurements that were performed using Minolta color device. For instance, there was no exact result about the color changes in the freshness of the fish due to the failure of determining a considerable difference in the fish skin in OD and OFT groups between the third and 12th days of storage and the negative color results produced by Minolta color measurement technique. Similarly, the changes in the a* values of fish meat in all fish groups made it difficult to make a clear decision about the color of the fish. Although some researchers use Minolta color measurement technique results to identify the freshness of the fish meat, there results are not sufficient to make an exact diagnosis of the freshness of the fish meat, and they only provide a general opinion about the sensory characteristics of food. Whereas machine vision (MV) systems can determine L*, a*, and b* values for each pixel of an image and analyze the entire surface of homogeneous and nonhomogeneous shapes and color of samples. MV also
Table 2. Average L*, a*, and b* values from Minolta colorimeter of color assessment of gilthead seabream.
C
Days Skin L* Skin a* Skin b* Fillet L* Fillet a* Fillet b*
Mean St Dev Mean St Dev Mean St Dev Mean St Dev Mean St Dev Mean St Dev
0 74.73 3.37aA* -0.53 0.24aA 2.08 0.71aA 44.81 0.83aA -0.64 0.76aA -3.19 0.49aA
3 52.05 1.11bA -0.65 0.40aA 0.25 0.04abA 48.51 2.07bA -0.25 0.54aA -1.51 0.01aA
6 47.68 3.36bA -0.50 0.46aA 0.03 1.58abA 47.48 1.39abA -0.31 0.33aA -2.88 1.07aA
9 51.94 2.53bA -0.54 0.12aA -0.95 0.89bA 46.78 0.71abA -0.51 0.32aA -2.27 0.53aA
IO
Days Skin L* Skin a* Skin b* Fillet L* Fillet a* Fillet b*
Mean St Dev Mean St Dev Mean St Dev Mean St Dev Mean St Dev Mean St Dev
0 74.73 3.37aA -0.53 0.24abA 2.08 0.71aA 44.81 0.83aA -0.64 0.76aA -3.19 0.49aA
3 55.19 0.77bB -1.00 0.31aA -3.44 0.79bB 47.80 2.49aA -0.33 0.20aA -1.56 0.01bA
6 54.47 7.31bA -0.93 0.17aA -2.27 1.89bA 48.96 4.82aA -0.29 0.63aA -2.38 0.01abA
9 54.54 1.76bA -0.68 0.17abA -3.13 0.77bA 47.71 1.01aA -0.42 0.09aA -2.83 0.81abA
12 49.04 1.26bA -0.71 0.06abA -1.93 1.27bA 48.92 0.92aA 0.25 0.11aA -1.70 0.62abA
15 51.43 1.98bB -0.52 0.18abA 0.68 0.73aA 49.96 1.42aA -0.74 0.27aA -1.53 0.87bA
18 54.36 5.45bA -0.34 0.12bA 1.20 0.33aA 49.58 1.01aA -0.21 0.27aA -2.21 0.01abA
IFT
Days Skin L* Skin a* Skin b* Fillet L* Fillet a* Fillet b*
Mean St Dev Mean St Dev Mean St Dev Mean St Dev Mean St Dev Mean St Dev
0 74.73 3.37aA -0.53 0.24abA 2.08 0.71adA 44.81 0.83aA -0.64 0.76aA -3.19 0.49aA
3 54.59 1.60bA -1.21 0.16aA -2.87 0.16bB 46.40 0.66aA -0.04 0.01aA -3.00 0.78aB
6 50.50 3.89bA -0.79 0.48abA -0.25 0.02acdfA 49.26 1.77abA -0.75 0.37aA -2.23 0.51abA
9 53.11 2.73bA -0.70 0.36abA -1.31 1.50bcA 48.85 1.06abA -0.25 0.22aA -1.92 0.13abA
12 49.84 4.15bA -0.60 0.27abA -1.51 0.88befA 48.22 0.66aA -0.20 0.36aA -2.62 0.51abA
15 56.83 2.29bB -0.47 0.25abA -0.65 1.21bcA 47.60 1.93aA -0.20 0.10aB -2.60 0.77abA
18 52.37 1.08bA -0.28 0.29bA 0.85 0.86aceA 53.35 3.03bA -0.24 0.36aA -1.32 0.52bA
provides the color spectrum and other visual attributes of the sample (Balaban, 2008; Balaban et al., 2008). Ot was reported that the color represented by the Minolta readings was purplish, while that measured using the machine vision system was much closer to the average real color of Atlantic salmon fillets. The average L*, a*, and b* values measured by MV were very close to that of the original sample. Whereas results from Minolta were significantly different (Yagız et al., 2009).
Light source, color measuring method, panelist assessments, etc. have great importance on determining the quality of the food. Direction and intensity of light source, measuring the entire surface area of the food homogenously, physical and emotional state of the panelists affects the determination of the true color of the food. According to Minolta color measurement results initial b* values of skin and flesh in fish were 2.08, -3.19, respectively, yellowish value of skin started decreasing and flesh color changing into colorless. Significant color changes of OD and OFT groups were not observed. As compared to group C samples, brightness of skin decreased and color change from white to dark color was determined. On groups C, OD and OFT, the Minolta color analysis results showed that the brightness of meat color increased gradually, yet the change in the a* and b* values of the meat did not create a considerable difference. Thus, the changes in the meat color were evaluated based on the L* value. The changes in
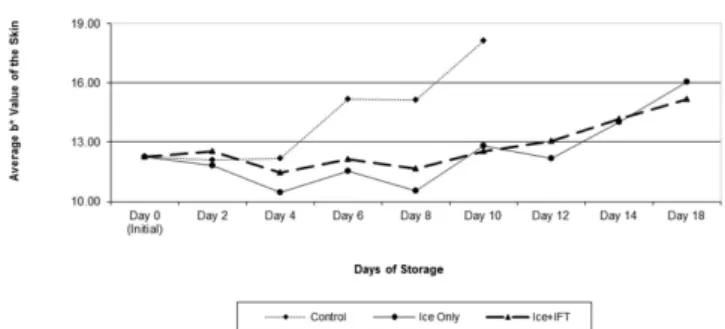
the L* and b* values of fish skin are still important to determine the freshness of the entire fish, and Minolta color measurement results showed that there was reduction in the brightness and yellowness (L* and b*) of the skin in all groups. The Minolta color measurement results of this study were consistent with those of the study conducted by Caklı et al. (2007). However, the MV results in Table 3 showed that the color change in the skin could be defined more precisely checking the b* values of the skin. Dn the sixth day of storage the b* value was15.17 in group C, 11.52 in group OD and 12.12 in group OFT whereas the initial b* value was 12.26.
From the twelveth day of storage, there was a linear increase in the b* value of the fish skin in all fish groups (Figure 2). Using the MV system, the study found that this color change in fish skin indicated that the difference was significant (p < 0.05).
As seen in the MV results on Figure 2, the color development in the fish skin in all groups emerged parallel to the increase in the b* value. The statistical analysis showed that the difference was statistically significant (p < 0.05). The color change in the L* value of fish skin and eye increased rapidly in the control group starting from the eighth day of storage, while the a* value of gill color (Figure 3) had a considerable color loss starting from the same day. Similar situations were observed in the eye
Table 3. Average L*, a*, and b* values from machine vision system of color assessment of gilthead seabream.
Control
Days Gill L* Gill a* Gill b* Eyes L* Eyes a* Eyes b* Skin L* Skin a* Skin b*
0 32.16 ± 3.52aA 24.32 ± 6.35aA 8.27 ± 4.37Aa 26.51 ± 1.13bA 5.07 ± 0.56aA -3.20 ± 0.50aA 58.61 ± 2.88aA -1.89 ± 0.38Aa 12.26 ± 0.62aA
2 35.78 ± 2.91aA 20.91 ± 3.20abA 5.50 ± 2.78abcA 31.56 ± 1.72abA 5.84 ± 1.12aA -3.31 ± 0.63aA 61.55 ± 2.38abA -2.60 ± 0.43aAB 12.10 ± 1.37aA
4 33.81 ± 2.52aA 15.45 ± 5.78abA 1.64 ± 2.88acA 30.90 ± 0.84bA 5.14 ± 0.57aA -3.11 ± 0.36abA 57.50 ± 3.20aA -1.85 ± 0.40aA 12.16 ± 0.66aA
6 35.19 ± 5.04aA 24.56 ± 6.45aA 10.37 ± 5.71bA 33.31 ± 1.99abA 2.06 ± 1.31bA -1.78 ± 0.80abA 63.20 ± 1.78bA -3.81 ± 0.86cA 15.17 ± 0.65bA
8 32.95 ± 6.24aA 23.21 ± 6.55aA 7.03 ± 5.02abcA 31.78 ± 4.64bA 3.71 ± 1.47abA -1.03 ± 1.76abA 61.54 ± 1.77abA -1.91 ± 0.29aA 15.12 ± 0.48bA
10 34.70 ± 1.19aA 12.32 ± 3.45bA -0.07 ± 1.26cA 39.95 ± 10.6aA 5.61 ± 1.94aA 1.26 ± 5.64bA 57.21 ± 3.01aA -0.44 ± 0.42dA 18.13 ± 1.17cA
Ice Only
0 32.16 ± 3.52aA 24.32 ± 6.35aA 8.27 ± 4.37abA 26.51 ± 1.13dA 5.07 ± 0.56abA -3.20 ± 0.50aA 58.61 ± 2.88abA -1.89 ± 0.38aeA 12.26 ± 0.62bA
2 36.34 ± 3.71aA 21.83 ± 7.32abA 4.97 ± 4.51abA 33.97 ± 1.29abB 4.87 ± 0.75abA -4.97 ± 0.65aB 60.75 ± 4.23abA -3.13 ± 0.48bA 11.81 ± 0.85abA
4 34.08 ± 4.70aA 16.74 ± 6.56abA 3.86 ± 5.74abA 31.95 ± 0.76bA 4.74 ± 0.46abA -3.73 ± 0.57aA 55.40 ± 1.69aA -2.15 ± 0.27aceA 10.48 ± 0.49aB
6 33.74 ± 4.50aA 22.21 ± 5.37abA 6.69 ± 4.00abA 33.97 ± 3.60abA 2.96 ± 1.15abA -4.31 ± 0.85aB 61.80 ± 1.86bA -2.58 ± 0.44bcdB 11.52 ± 0.35abB
8 40.74 ± 7.60aA 25.26 ± 4.75aA 11.73 ± 5.69aA 35.90 ± 2.47abcA 2.73 ± 1.62aA -3.74 ± 0.86aB 60.56 ± 1.79abA -2.43 ± 0.20abB 10.54 ± 0.53aB
10 38.76 ± 4.89aA 12.06 ± 5.34bA -0.55 ± 3.44bA 38.03 ± 2.19acA 4.72 ± 1.09abA -3.25 ± 0.56aA 55.94 ± 3.10abA -1.67 ± 0.31eB 12.82 ± 0.27bcB
12 39.97 ± 3.31aA 17.03 ± 6.94abA 2.07 ± 3.91abA 39.25 ± 2.43cA 5.91 ± 1.55abA -2.56 ± 0.89acA 56.28 ± 4.36abA -2.15 ± 0.43adeA 12.18 ± 0.28bA
14 35.89 ± 9.07aA 17.84 ± 8.42abA 7.80 ± 10.60abA 37.73 ± 3.13acA 6.03 ± 3.45abA 0.97 ± 2.51bA 58.25 ± 3.30abA -1.74 ± 0.42aeA 14.01 ± 0.84cA
18 37.99 ± 2.86aA 14.22 ± 3.83abA 0.64 ± 1.96bA 39.20 ± 2.57cA 6.29 ± 1.86bA 0.19 ± 2.90bcA 59.11 ± 2.08abA -2.20 ± 0.19abeA 16.03 ± 1.37dA
Ice+IFT
0 32.16 ± 3.52aA 24.32 ± 6.35aA 8.27 ± 4.37bA 26.51 ± 1.13cA 5.07 ± 0.56aA -3.20 ± 0.50abcA 58.61 ± 2.88aA -1.89 ± 0.38aA 12.26 ± 0.62aA
2 33.66 ± 2.18abA 17.31 ± 5.71abA 2.34 ± 2.78abA 31.98 ± 0.97adA 5.64 ± 0.48aA -4.09 ± 0.84cA 60.27 ± 4.23abA -2.09 ± 0.13aB 12.56 ± 0.57abA
4 35.11 ± 5.02abA 17.97 ± 6.17abA 5.95 ± 5.54abA 32.65 ± 1.50adeA 4.31 ± 0.50abcA -3.53 ± 1.28abcA 58.78 ± 3.46abA -2.37 ± 0.33aA 11.46 ± 0.24aA
6 29.67 ± 4.59aA 21.85 ± 5.38abA 10.19 ± 4.68bA 30.16 ± 4.66dA 2.62 ± 1.46bA -2.71 ± 1.26abcA 62.16 ± 2.97aA -2.27 ± 0.33aB 12.12 ± 0.71abB
8 35.03 ± 3.80abA 22.47 ± 6.55abA 6.43 ± 3.81abA 34.05 ± 0.76abA 3.30 ± 0.37bcA -3.63 ± 0.79acB 60.59 ± 2.80abA -2.39 ± 0.30aB 11.64 ± 0.48abC
10 35.19 ± 2.02abA 13.51 ± 4.61abA 0.70 ± 2.39aA 36.42 ± 1.08beA 5.04 ± 0.99acA -2.68 ± 0.50abcA 58.31 ± 2.47abA -1.58 ± 0.22abB 12.54 ± 0.99abB
12 39.54 ± 2.93bA 18.92 ± 5.15abA 3.38 ± 2.33abA 36.52 ± 1.56bA 5.26 ± 1.05aA -3.18 ± 0.39abcA 57.37 ± 3.12abA -2.09 ± 0.60aA 13.06 ± 0.96bcA
14 34.44 ± 6.19abA 17.17 ± 8.12abA 3.03 ± 5.83abA 33.19 ± 1.09abdB 5.13 ± 0.70aA -1.96 ± 0.69bB 57.05 ± 1.75abA -0.86 ± 0.81bA 14.18 ± 0.68cdA
18 35.95 ± 1.79abA 10.52 ± 3.71bA -1.30 ± 1.71aA 36.67 ± 1.01bA 6.07 ± 0.99aA -2.44 ± 0.33abA 55.94 ± 1.83bB -1.06 ± 0.52bB 15.16 ± 0.98dA
and gill color changes in all other fish groups, yet there was no significant difference (p > 0.05).
The skin color in OD and OFT groups was consistent until the twelveth day of storage, and there was an obvious yellow color development in the fish skin in both groups starting from that day. Ot was maximized in OD group with b* value of 16.03, and with a 15.16 b* value in the OFT group on the eighteenth day of storage. However, this difference was not statistically significant (p > 0.05). Dcãno-Higuera et al. (2011) reported that color evaluation was one of the most important parameters used in the quality control of fishery products. They also reported that there was no significant change in the L* value of fish skin regarding storage duration, and at the end of the storage duration, the fish skin had a darker yellow color and there was significant difference in the b* value of fish skin.
Ot was also reported that one of the most important quality parameters of seafood was color value (Dcãno-Higuera et al., 2011). On this study, significant change in fish skin of L* value was not determined and more intensive yellow color was determined during storage. There was no statistically significant difference among the Minolta color measurement results in this study. However, according to MV results indicated that the difference among the fish groups regarding the b* value of the skin was significant (p < 0.05). This difference in the skin color was consistent with the results acquired by Dcãno-Higuera et al. (2011).
Monitoring the changes in all sensory characteristics of the fish is necessary to make an exact determination of the freshness of gilthead sea bream. At this point, monitoring the color change in the gill and pupilla of the fish is not possible by using Minolta color measurement technique. Thus, the researcher needed to assess all sensory characteristics of the fish by image analysis method. All sensory characteristics of gilthead sea bream (color changes in eyes, gill and skin) were measured using image analysis. Table 3 presents the color results of that analysis. The researcher photographed the eyes and gills of the fish as well as the entire body during the storage, and the difference in the quality based on visual parameters were demonstrated objectively. The color changes in the skin, gills and eyes of gilthead seabream were determined regarding the mean b*, L*, a* and values. Figures 2, 3 and 4 present the color changes in the skin, gills and eyes of the gilthead seabream depending on the storage duration.
As seen on Figure 2, the yellow color development in the fish skin emerge in consistency with the increase in b* value. The statistical analysis revealed that the difference between the groups was significant (p < 0.05). The skin color change in control group fish increased rapidly starting from the sixth day of storage, while there was no significant change in the L* value of eyes and a* value of gill color (p > 0.05). This was similar in eye and gill color changes in all other fish groups, and there were no significant differences (p > 0.05). On OD and OFT groups, the color change in fish skin was consistent until the twelveth day of storage, and there was pale yellow color development in both groups starting from that day. Ot was maximized in the OD group on the eighteenth day of storage with b* value of 16.03.
On recent years, some researchers have focused on determining the color changes in the skin, eyes and gill of the fish during storage in ice using image analysis. Dowlati et al. (2013) studies on the changes in the eyes and gills of gilthead seabream, Balaban et al. (2014) studied on the color changes in the skin and eyes of snapper and gurnard, Cheng & Sun (2014) conducted quality control analysis for fish and other aquaculture using hyperspectral imaging, and Dutta et al. (2016) used image analysis to identify the quality and freshness of fish, and they
Figure 2. The quality changes of b* value of skin gilthead seabream (Sparus aurata) during storage days.
Figure 3. The quality changes of a* value of gill gilthead seabream (Sparus aurata) during storage days.
using Minolta instrument. Color L* and b* values of gilthead sea bream skin, eyes, and gills increased during storage time. According to results of the presented study, the color changes in the sensory characteristics of the fish have been found to be indicative of fish freshness.
Acknowledgements
This work was financially supported by Scientific Research Projects Coordination Unit of Ostanbul University (Project noI: 18587 and 18487). The authors thank Sedef Ondustrial Onc. (Ostanbul, Turkey) for supplying data logger and Mr. Veysel Sağdıçlar, general manager of Sağdıçlar Fishing, for supplying flake ice.
References
Alcicek, Z., & Balaban, M. D. (2012). Development and application of “The Two Omage” method for accurate object recognition and color analysis. Journal of Food Engineering, 111(1), 46-51. httpI://dx.doi. org/10.1016/j.jfoodeng.2012.01.031.
Balaban, M. D. (2008). Quantifying non-homogeneous colors in
agricultural materials. Part OI: method development. Journal of
Food Science, 73(9), 431-437. httpI://dx.doi.org/10.1111/j.1750-3841.2008.00807.x.
Balaban, M. D., Aparicio, J., Zotarelli, M., & Sims, C. (2008). Quantifying non-homogeneous colors in agricultural materials. Part OOI: comparison of machine vision and sensory panel evaluations. Journal of Food Science, 73(9), 438-442. httpI://dx.doi.org/10.1111/j.1750-3841.2008.00967.x. Balaban, M. D., Stewart, K., Fletcher, G. C., & Alçiçek, Z. (2014). Colour change of the snapper (Pagrus auratus) and gurnard (Chelidonichthys
kumu) skin and eyes during storageI: effect of polarization and
contact with ice. Journal of Food Science, 79(12), 456-462. httpI:// dx.doi.org/10.1111/1750-3841.12693. PMidI:25384622.
Caklı, S., Kılınc, B., Cadun, A., Dincer, T., & Tolasa, S. (2007). Quality
differences of whole ungutted sea bream (Sparus aurata) and sea
bass (Dicentrarchus labrax) while stored in ice. Food Control, 18(5), 391-397. httpI://dx.doi.org/10.1016/j.foodcont.2005.11.005. Cheng, J. H., & Sun, D. W. (2014). Hyperspectral imaging as an effective
tool for quality analysis and control of fish and other seafoodsI: current research and potential applications. Trends in Food Science & Technology, 37(2), 78-91. httpI://dx.doi.org/10.1016/j.tifs.2014.03.006. Dowlati, M., Mohtasebi, S. S., Dmid, M., Razavi, S. H., Jamzad, M.,
& De la Guardia, M. (2013). Freshness assessment of gilthead seabream (Sparus aurata) by machine vision based on gill and eye color changes. Journal of Food Engineering, 119(2), 277-287. httpI:// dx.doi.org/10.1016/j.jfoodeng.2013.05.023.
Dutta, M. K., Ossac, A., Minhas, N., & Sarkar, B. (2016). Omage processing based method to assess fish quality and freshness. Journal of Food Engineering, 177, 50-58. httpI://dx.doi.org/10.1016/j. jfoodeng.2015.12.018.
FoodTouch. (2015). MicrobeGuard active packaging paper products.
Ollinois. Retrieved from httpI://www.microbeguard.com/images/ pdf/_seafood_guide
Gumus, B., Balaban, M. D., & Unlusayin, M. (2011). Machine vision applications to aquatic foodsI: a review. Turkish Journal of Fisheries and Aquatic Sciences, 11(1), 171-181. httpI://dx.doi.org/10.4194/ trjfas.2011.0124.
Hassoun, A., & Karoui, R. (2015). Quality evaluation of fish and other seafood by traditional and nondestructive instrumental methodsI:
all reported acquiring accurate and reliable results. Yagız et al. (2009) reported that different factors (the geometry of color measurement, level of brightness on the surface, roughness and tissue of the surface) affected reading the color. The MV system makes it possible to measure the color changes in food and determine whether the color is close to the original color.
On this study, the brightness value of the fish eye was measured based on the L* value. The color of the eyes progressively changed to a lighter color as evidence by the increase in the L* values through storage days (Figure 4). Because of polarized light was used, the effect of the wetness and reflection of the eyes did not negatively effect the results. At the beginning, the L* value of the eyes of the fish was 26.51. This value increased to 33.31 in group C, 33.97 in group OD, and 30.16 in group OFT on the sixth day of storage, respectively. Dn the tenth day of storage, these L* values reached 39.95, 38.03 and 36.42 in respective groups (Figure 4). At the end of the storage time the brightness and convexity of the pupilla disappeared while the pupilla became opaque and sunk. On this study, the average L* values of the gilthead seabream eyes increased significantly with storage days. Dowlati et al. (2013) found that the L* increased (p < 00.01) from 21.25 to 51.41 during ice storage for farmed gilthead seabream. Researches focused on whole fish, fillet, skin, fish eyes and gills color changes during ice storage. Balaban et al. (2014) reported that the average L* values of the snapper and gurnard eyes, the side touching ice resulted increased significantly with storage time (P < 0.05). Dowlati et al. (2013) indicated that fish eyes (pupil) tended to be white and cloudy over the period of storage. Balaban et al. (2014) found that the eyes exposed to freshwater ice were absorbed water and became opaque.
The red color in the gill of the fish was measured considering the a* value. Figure 3 presents the changes in the gill color. The a* value of that was measured redness in color gill changes of gilthead seabream. The color of the gills for each of sample group also changed decreasing in the a* value through storage days. The typical reddish color of the gill of fresh fish was altered during the storage period, it got pale, and became pink and yellow starting from the outer part through the inner part of the gill.
Dowlati et al. (2013) reported that typical images of fish gill color changes during ice storage. Furthermore, the fish gills tend to be slightly pale and grey-yellowish over the period of storage, as previously elucidated for eyes color changes. Figures 2,3,and 4 indicate the effect of storage time on the b*, a*, L* values of gilthead seabream skin, gills and eyes . The L* and b* values linearly increased with storage time, while the a* value continuously decreased especially after 8 th days for all group fish samples. Similar findings were reported on the effect of ice storage time on the L* and b* values of fish skin (Kılınc et al., 2007; Balaban et al., 2014).
4 Conclusion
advantages and limitations. Critical Reviews in Food Science and Nutrition, 57(9), 1976-1998. httpI://dx.doi.org/10.1080/10408398. 2015.1047926. PMidI:26192079.
Kılınc, B., Caklı, S., Cadun, A., Dıncer, T., & Tolasa, S. (2007). Comparison of effects of slurry ice and flake ice pretreatments on the quality of aquacultured sea bream (Sparus aurata) and sea bass (Dicentrarchus labrax) stored at 4 °C. Food Chemistry, 104(4), 1611-1617. httpI:// dx.doi.org/10.1016/j.foodchem.2007.03.002.
Korel, F., Luzuriaga, D., & Balaban, M. D. (2001). Dbjective quality
assessment of raw tilapia (Oreochromis niloticus) fillets using
electronic nose and machine vision. Journal of Food Science, 66(7), 1018-1024. httpI://dx.doi.org/10.1111/j.1365-2621.2001.tb08228.x. Dcãno-Higuera, V. M., Maeda-Martinez, A. N., Marquez-Ríos, E.,
Canizales-Rodríguez, D. F., Castillo-Yáñez, F. J., Ruíz-Bustos, E., Graciano-Verdugo, A. Z., & Plascencia-Jatomea, M. (2011). Freshness assessment of ray fish stored in ice by biochemical, chemical and physical methods. Food Chemistry, 125(1), 49-54. httpI://dx.doi. org/10.1016/j.foodchem.2010.08.034.
Dliveira, A. C. M., & Balaban, M. D. (2006). Comparison of a colorimeter with a machine vision system in measuring color of gulf of mexico sturgeon fillets. Applied Engineering in Agriculture, 22(4), 583-587. httpI://dx.doi.org/10.13031/2013.21211.
Ünal Şengör, G. F., Balaban, M. D., Ceylan, Z., & Dogruyol, H. (2017). Determination of shelf life of gilthead seabream (Sparus aurata)
with time temperature indicators. Journal of Food Processing and
Preservation, 42(2), 1-10. httpI://dx.doi.org/10.1111/jfpp.13426. Wu, D., & Sun, D. W. (2013). Colour measurements by computer